

Market Data

July 29, 2018
Global Steel Production: China Hits High of 53 Percent in June
Written by Peter Wright
China’s share of global steel production is setting a new high each month.
Global steel production was down by 1.1 percent in June, but May’s production hit an all-time high and June was the second highest month ever, according to the latest Steel Market Update analysis of World Steel Association data. In three months through June, Chinese production grew by 9.0 percent year over year as the rest of the world grew by 3.4 percent. In 2018, China is increasing its share of global steel production, which now stands at an all-time high of 53.0 percent.
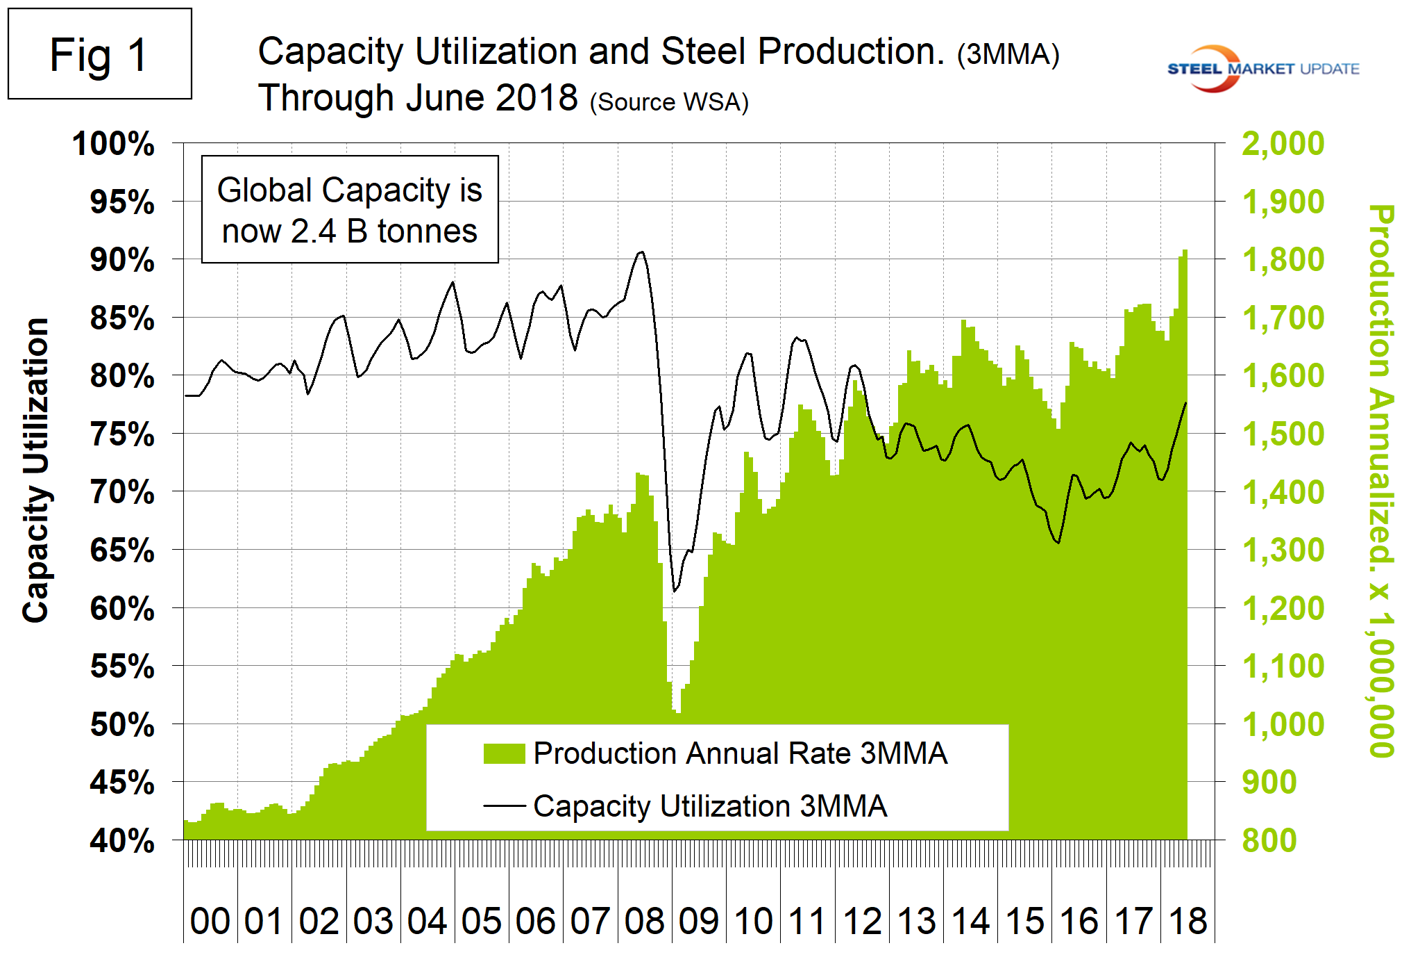
In 2017, total global steel production was 1.645 billion metric tons, up by 5.0 percent from 2016. In the six months through June 2018, global production was at an annual rate of 1.758 billion metric tons, smashing all previous records. Capacity utilization in June was 78.5 percent. The three-month moving averages (3MMA) of production and capacity utilization in April through June that we prefer to use were 151,326,000 metric tons and 78.5 percent, respectively. This was the highest capacity utilization since June 2012. Figure 1 shows monthly production and capacity utilization since January 2000. May and June were the first months for the annualized production rate to exceed 1.8 billion metric tons. On a tons-per-day basis, production in June was 5.046 million metric tons with a 3MMA of 4.989 million tons. This was another all-time high on both counts. In December 2016, the OECD’s steel committee estimated that global capacity would increase by almost 58 million metric tons per year between 2016 and 2018 bringing the total to 2.43 billion tons. That forecast is coming to pass as capacity is now 2.4 billion tons.
As we dig deeper, we start with seasonality. On average, global production peaked in the early summer in the years 2010 through 2016, but last year the second half downtrend was delayed until November. Figure 2 shows the average tons per day of production for each month since 2008. In those 11 years on average, June has been up by 0.57 percent; this year June was up by 1.31 percent.
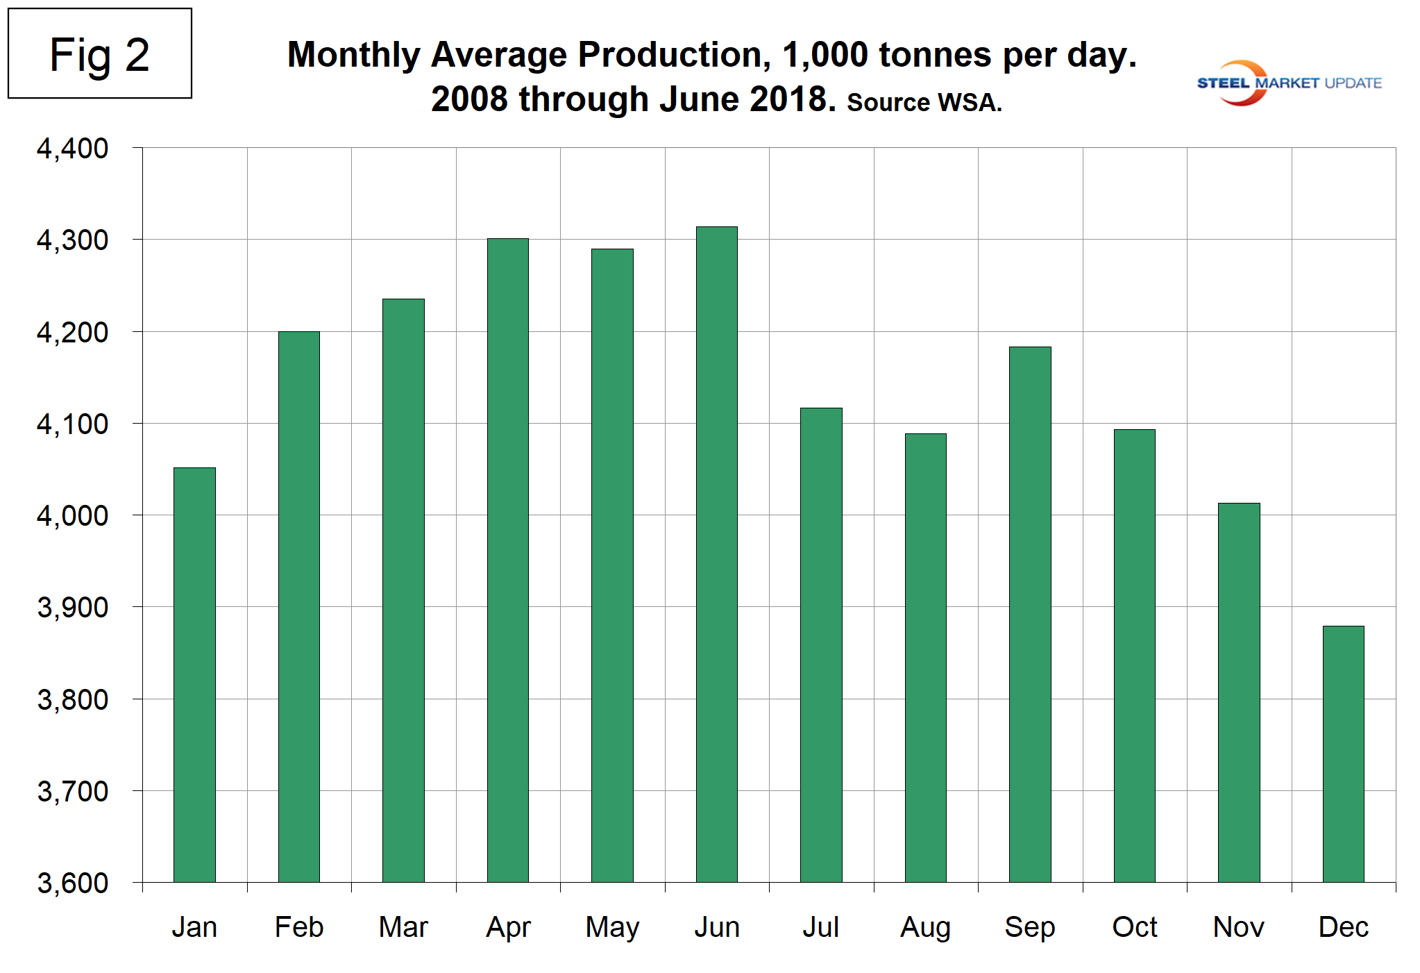
Figure 3 shows the monthly year-over-year growth rate on a 3MMA basis since January 2005. Growth in May was 5.3 percent and 6.3 percent in June.
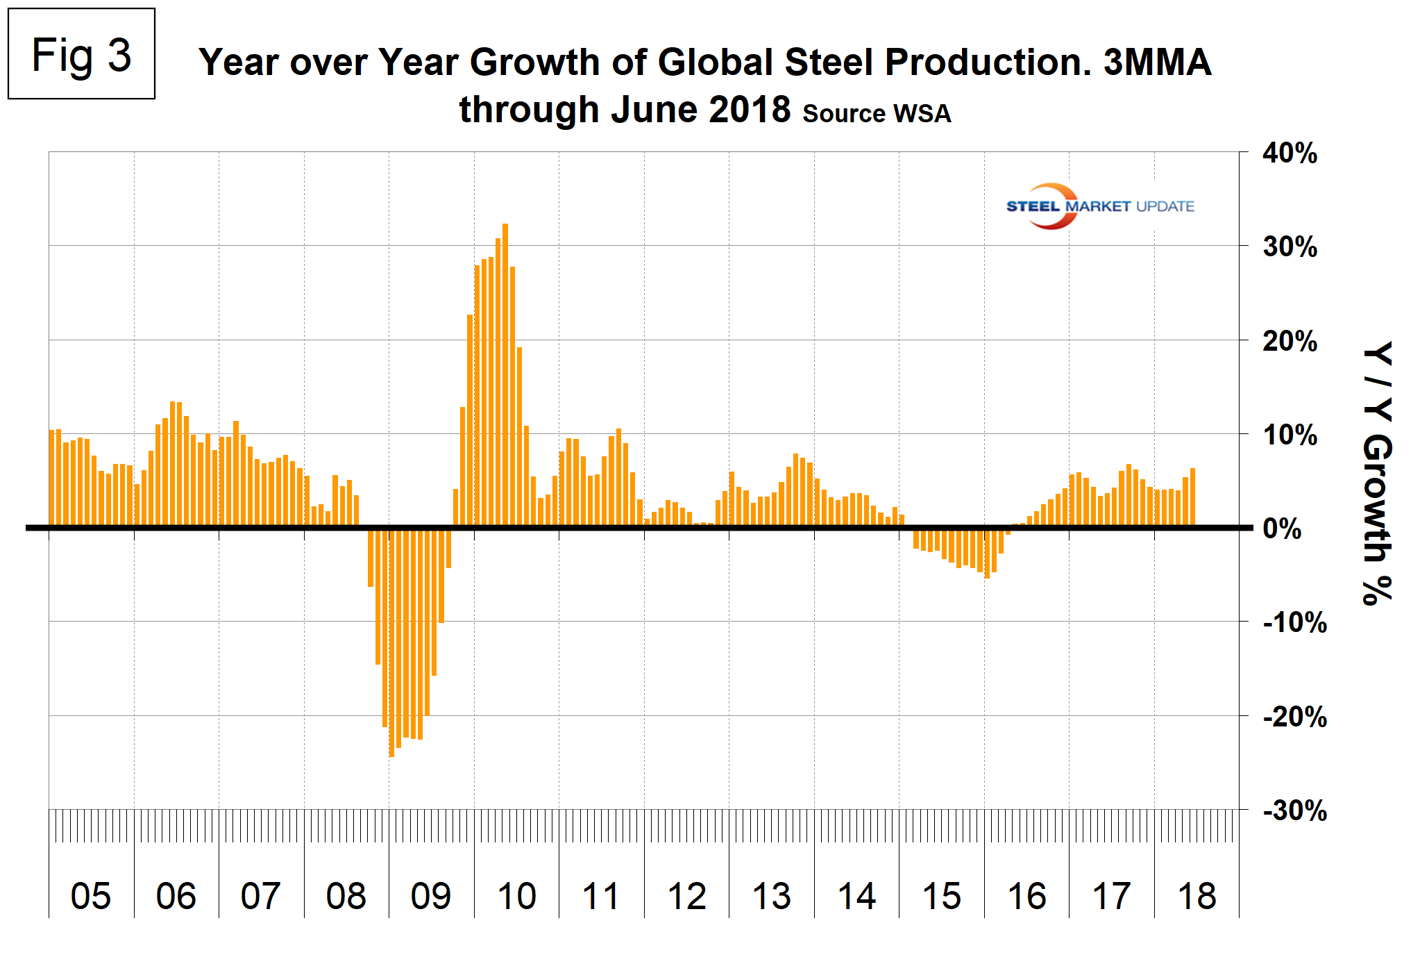 Table 1 shows global production broken down into regions, the production of the top 10 nations in the single month of June, and their share of the global total. It also shows the latest three months and 12 months of production through June with year-over-year growth rates for each period. Regions are shown in white font and individual nations in beige. The world overall had positive growth of 6.3 percent in three months and 5.4 percent in 12 months through June. When the three-month growth rate exceeds the 12-month growth rate, as it did in May and June, we interpret this as a sign of positive momentum. These were the first months of positive momentum since November last year. On the same basis, China grew by 9.0 percent and 6.5 percent. On a regional basis, other Europe and South America had negative growth in the three months through June. All other regions were positive. India had the second highest growth rate (second only to China). Table 1 shows that North America was up by 2.7 percent in three months. Within North America, the U.S. was up by 3.2 percent, Canada was down by 1.7 percent and Mexico was up by 3.1 percent.
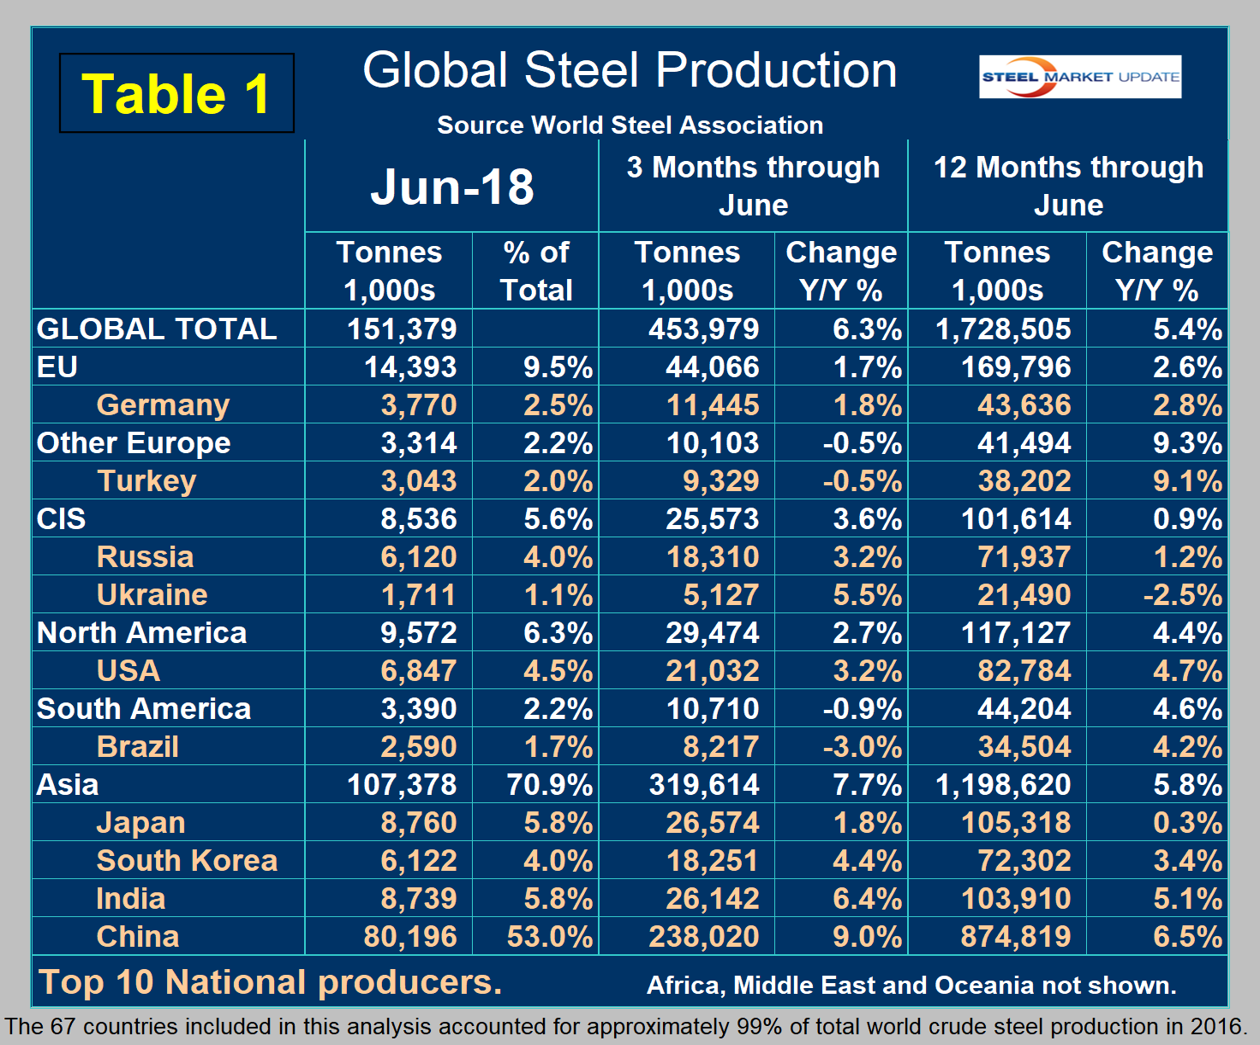
In the 12 months of 2017, 115.3 million metric tons were produced in NAFTA of which 70.8 percent, 11.9 percent and 17.3 percent were produced in the U.S., Canada and Mexico, respectively.
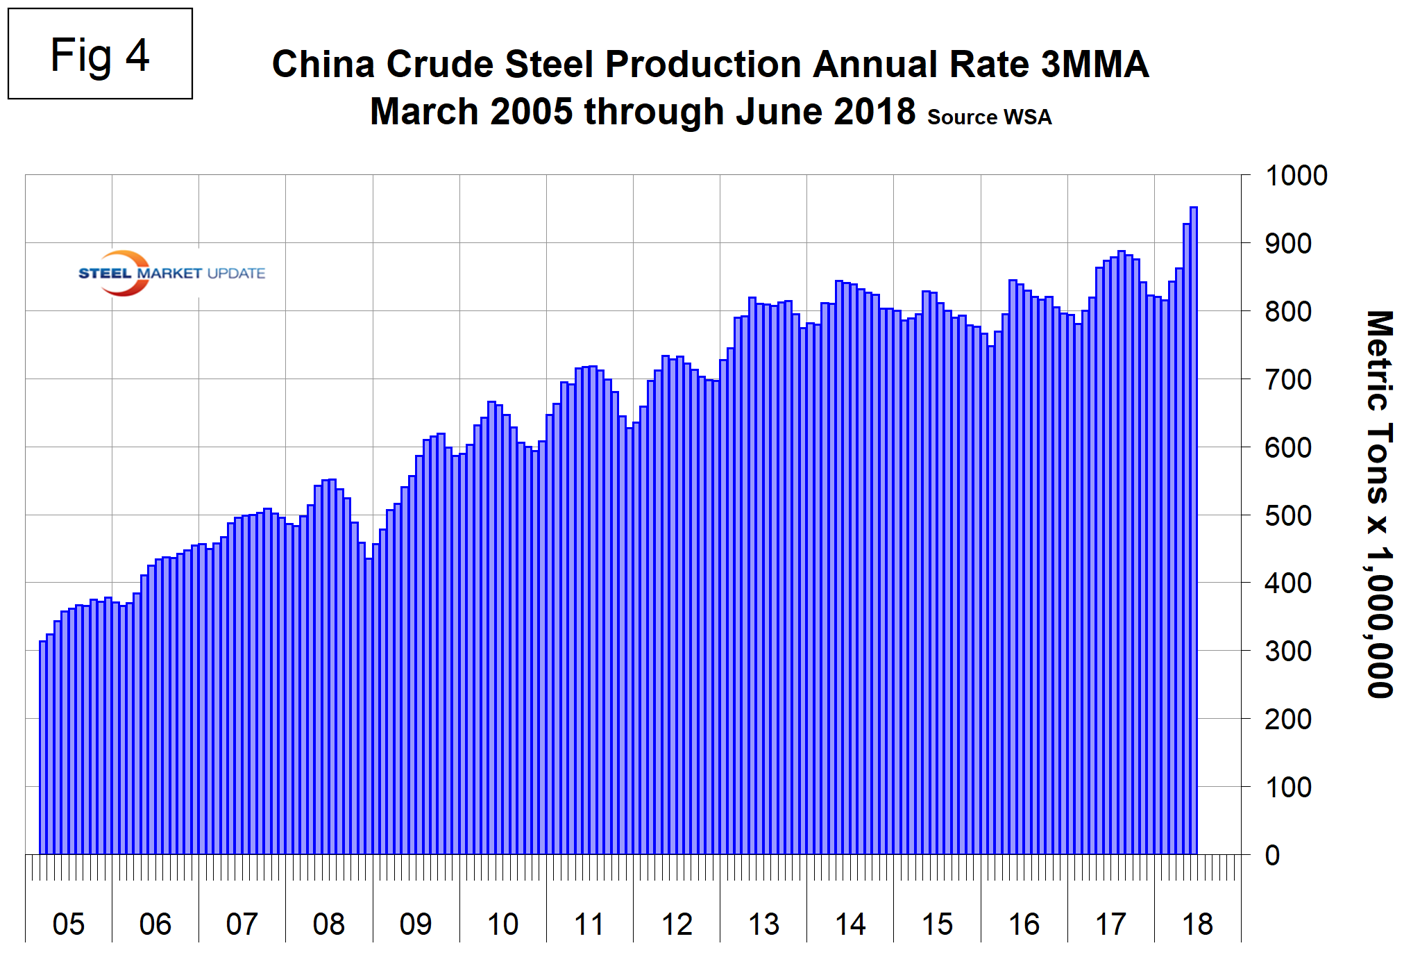
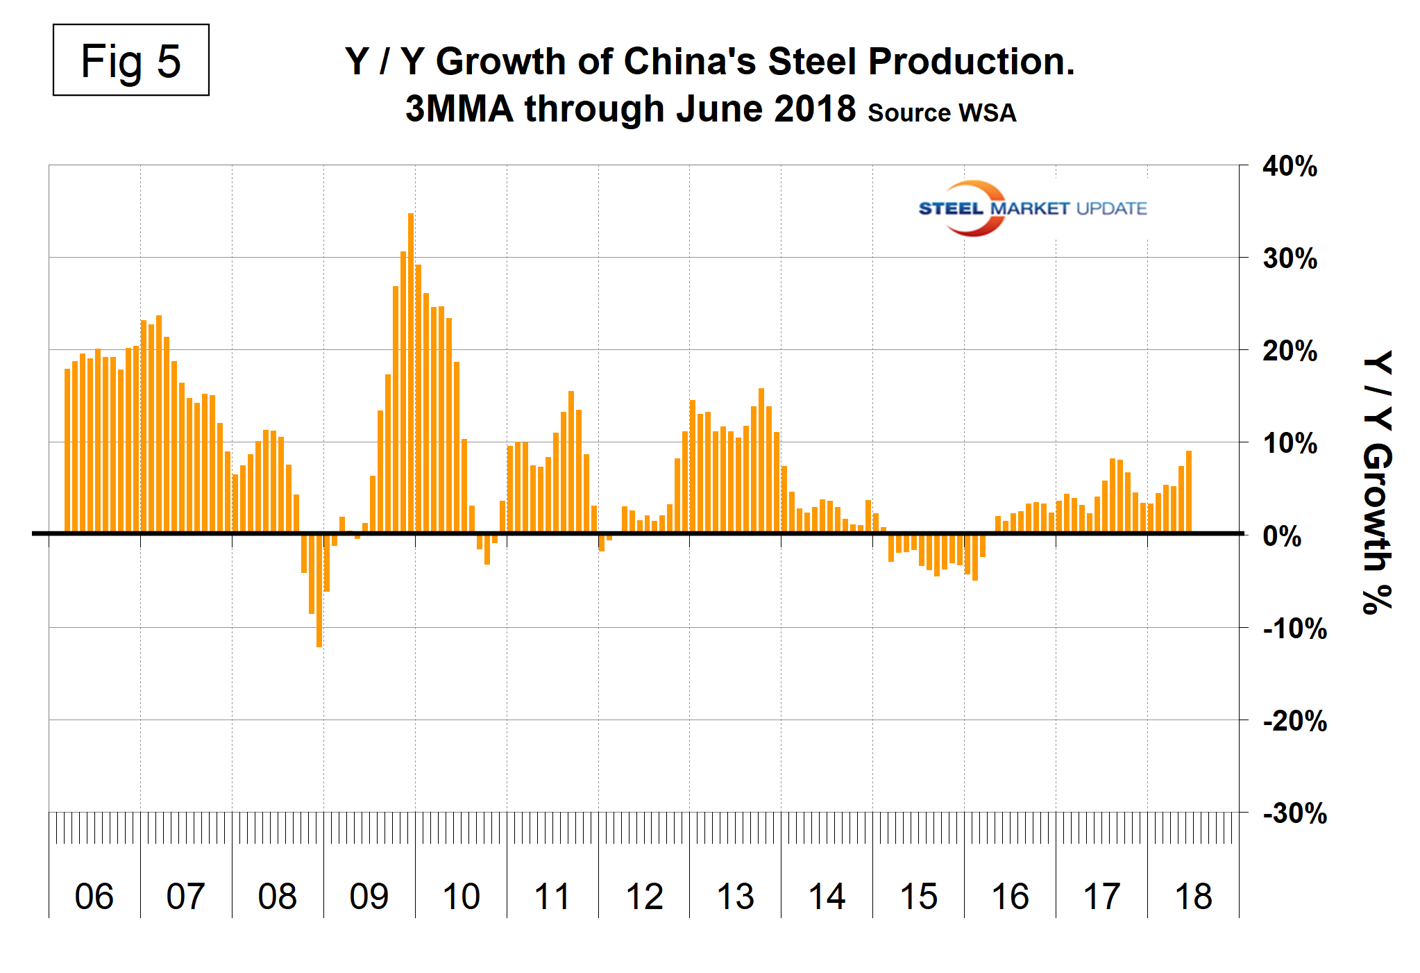
Figure 4 shows China’s production since 2005 and Figure 5 shows the year-over-year growth. Sequentially in the six months January through June 2018, China’s share of global production was 48.0 percent, 49.3 percent, 49.9 percent, 51.7 percent, 52.4 percent and 53.0 percent. As we have said before in these SMU updates, the much publicized capacity reductions in China are not the same thing as cutting production.
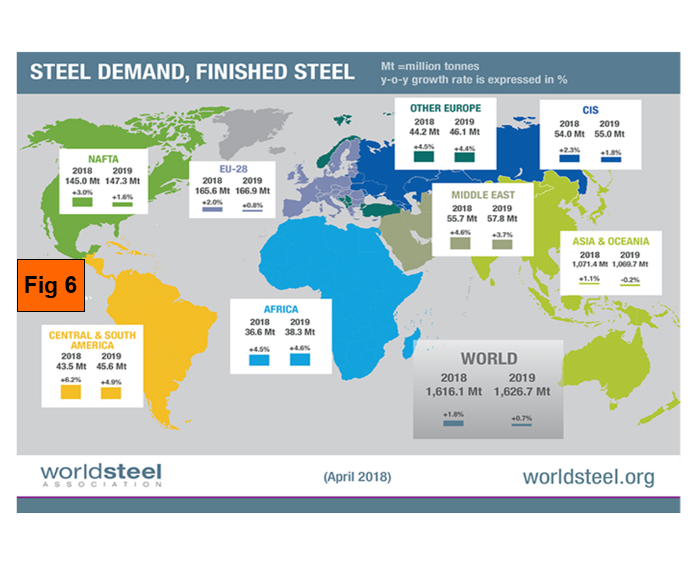
 The April WSA Short Range Outlook (SRO) for apparent steel consumption in 2018 and 2019 is shown by region in Figure 6. WSA forecasts global steel demand will reach 1,616.1 million metric tons in 2018, an increase of 1.8 percent over 2017. In 2019, it is forecast that global steel demand will grow by 0.7 percent to reach 1,626.7 million tons. Commenting on the outlook, WSA Economics Committee Chairman T.V. Narendran said, “In the next couple of years, the global economic situation is expected to remain favorable with high confidence and strengthening recovery of investment levels in advanced economies. Benefitting from this, steel demand in both developed and developing economies is expected to show sustained growth momentum with risks relatively limited. However, possible adverse impact from rising trade tensions and the probable U.S. and EU interest rate movements could erode this current momentum.” The outlook for steel demand in the U.S. remains robust on the back of the strong economic fundamentals – strong consumption and investment due to high confidence, rising income and low interest rates. The manufacturing sector is being supported by a low dollar and increasing investment, while rising housing prices and steady non-residential sector growth point to a healthy construction sector. Though the recent tax reform is further expected to boost steel demand through its positive impact on investment, there is some concern over a possible overheating of the economy. The announced infrastructure plan is unlikely to affect steel demand in the short term.”
WSA is one of the largest industry associations in the world. Members represent approximately 85 percent of the world’s steel production, including over 160 steel producers, national and regional steel industry associations and steel research institutes.
 SMU Comment: Once again, production records tumbled in June. In the latest three months of data, China’s production grew almost three times as fast as the rest of the world. There have been reports that the One Belt One Road program will absorb the expanded output, but we don’t know the magnitude of that effect. Reality seems to be that old plants are being closed as existing ones increase production and new plants come on stream. In its April forecast, the IMF raised its projection for global growth in 2018 and 2019, which will have a positive effect on global steel consumption, particularly in the developing world.


