Market Data

August 2, 2018
Data Sources Positive for U.S. Manufacturing
Written by Peter Wright
There are no clouds on manufacturing’s horizon. Economic indicators of manufacturing activity are virtually all positive for the remainder of 2018, according to Steel Market Update’s analysis of nine data sources that describe the state of manufacturing in the United States.
We have reported on most of these separately in our Steel Market Update publications, and therefore will be brief in this summary. We don’t expect these data sources to all point in the same direction. Our intent in summarizing them in one document is to provide a consensus of the state of this critical steel consuming sector. Based on American Iron and Steel Institute estimates of steel mill shipments by market classification, almost 50 percent of the steel consumed in the U.S. is manufacturing-oriented. This breaks down to about 27 percent in ground transportation including infrastructure, 9 percent in machinery and equipment, 5 percent in appliances, 4 percent in defense and about 4 percent in containers.
The Industrial Production Index
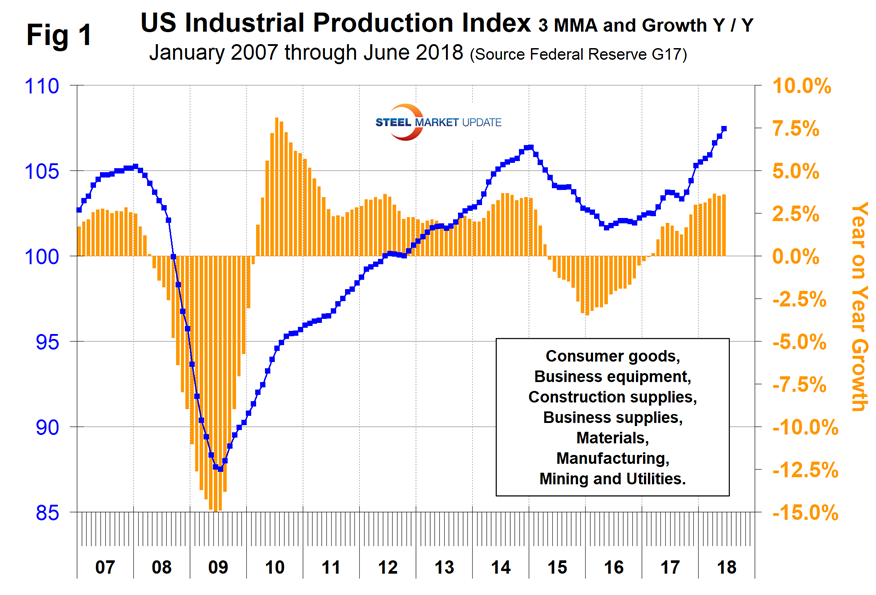
Figure 1 shows the IP index since January 2007 with the year-over-year growth. The three-month moving average (3MMA) of the year-over-year growth is shown by the brown bars in Figure 1. March 2017 was the first month of positive growth in the 3MMA since April 2015. Growth steadily improved from September 2017 through April 2018 when it leveled off at 3.6 percent in May and June. Manufacturing capacity utilization improved from 74.48 percent in January last year to 75.41 percent in June 2018, also on a 3MMA basis.
U.S. Factory Orders
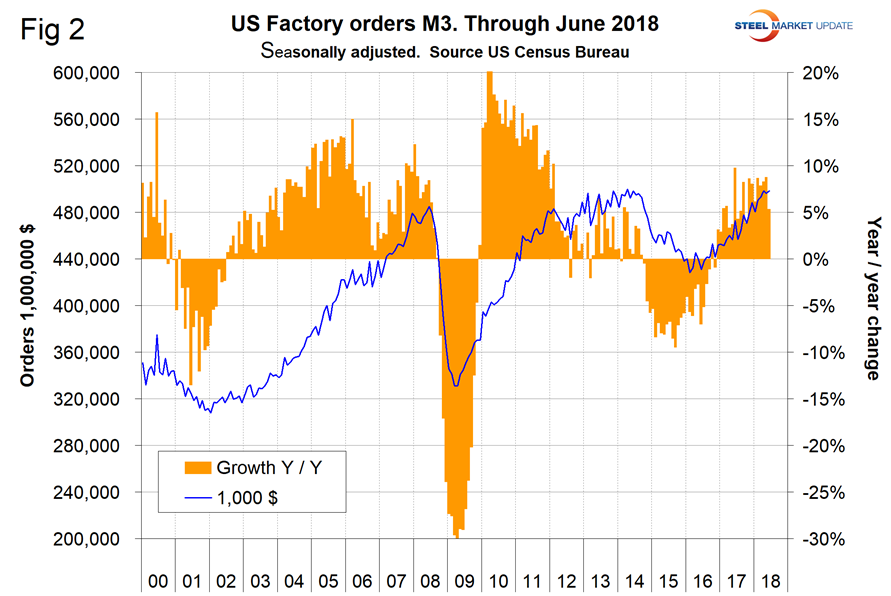
U.S. factory orders reported by the Census Bureau have been steadily increasing since mid-2016 (Figure 2). In June, year-over-year growth was 5.4 percent.
New Orders for Iron and Steel Products
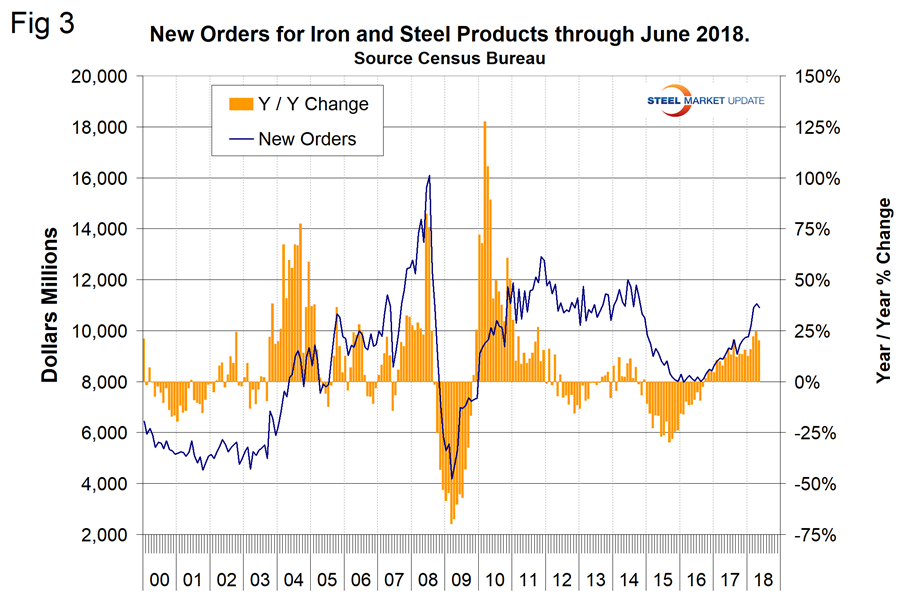
Within the Census Bureau M3 manufacturing survey is a subsection for new orders for iron and steel products. Figure 3 shows the history since January 2000 with an excellent growth rate of 20.1 percent year over year for May 2018, which was the third straight month at greater than 20 percent. Data at this level of detail is one month behind the advance report that covers total U.S. factory orders. New orders for iron and steel products in May were up by 36.2 percent from the recent low in August 2016.
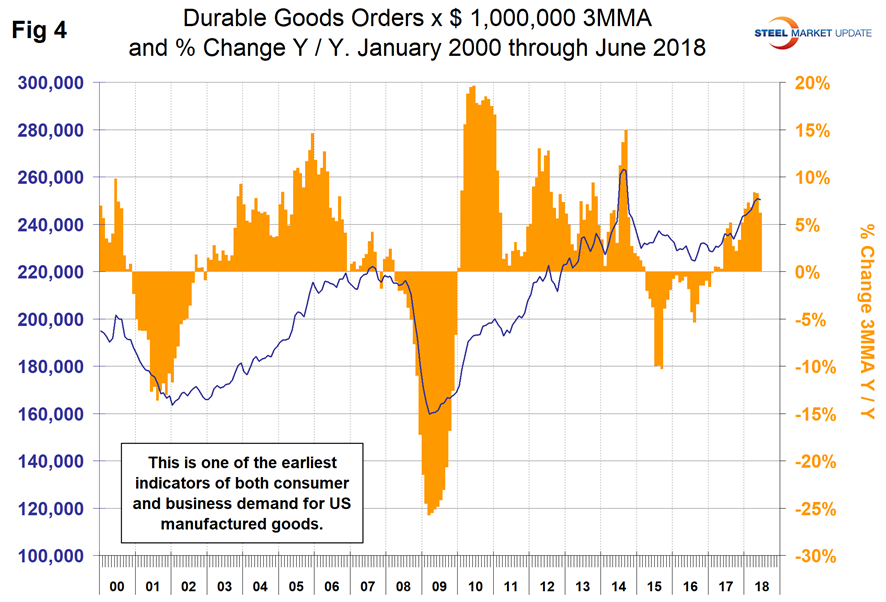
New Orders for Durable Goods
The U.S. Census Bureau announced on Thursday that new orders for manufactured durable goods in June decreased by 0.1 percent on a 3MMA basis month over month and were up by 6.2 percent year over year. Figure 4 shows the 3MMA of monthly orders for durable goods since January 2010, and that the percent change year over year is currently the highest since 2014.
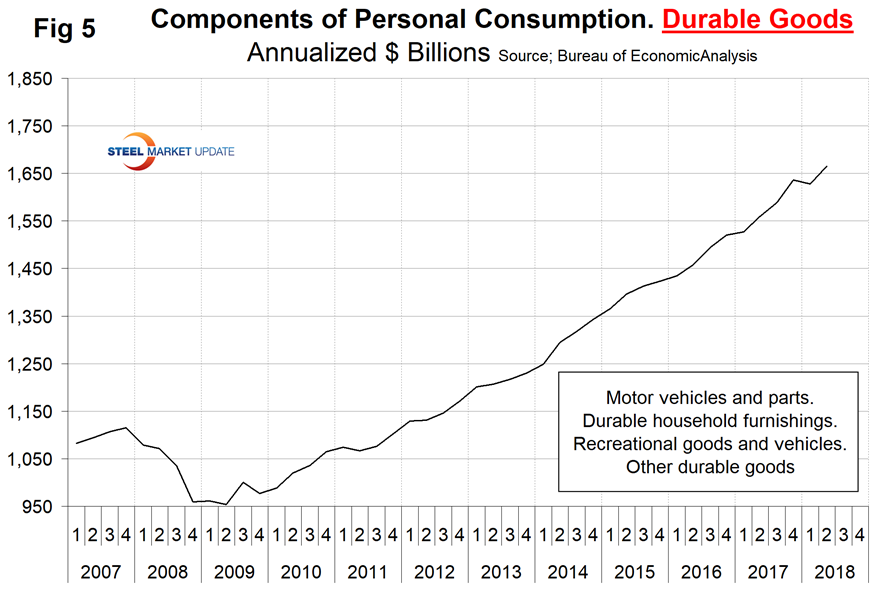
The Durable Goods Portion of GDP
The first estimate of Q2 2018 GDP came in at 4.1 percent annualized growth, which was up from 2.2 percent in Q1 2018. A subcomponent of the quarterly data is durable goods, which is part of the personal consumption calculation. It therefore contains no military hardware or civil aircraft data. This is shown in Figure 5 and, presumably because of the exclusions just mentioned, looks nothing like Figure 4. The durable goods portion of GDP declined in Q1 2018, but the long-term trend is still very positive.
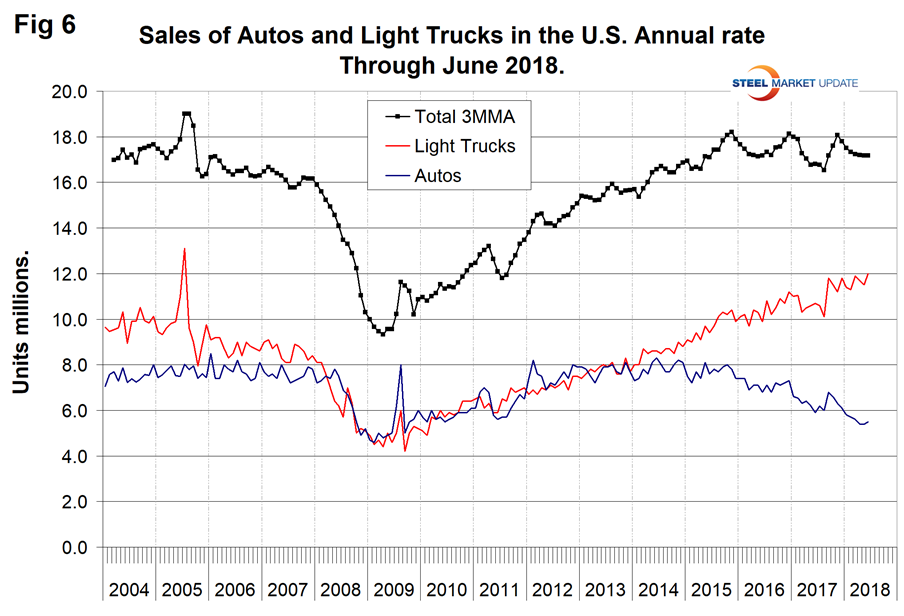
Light Vehicle Production in NAFTA
Our past reports have included auto assembly data for the U.S., Canada and Mexico, but that source has dried up, so we are reporting on U.S. auto sales. Another complication is that effective April 2018, GM no longer reported its sales results. Automobile sales have trended down slightly in the last 2 ½ years, but in June were up by 4.8 percent year over year. Sales are still strong on a historical basis (Figure 6). The preference for light trucks, which includes SUVs and crossovers, is still increasing. Import market share in June was 22.3 percent and has been drifting up since March last year.
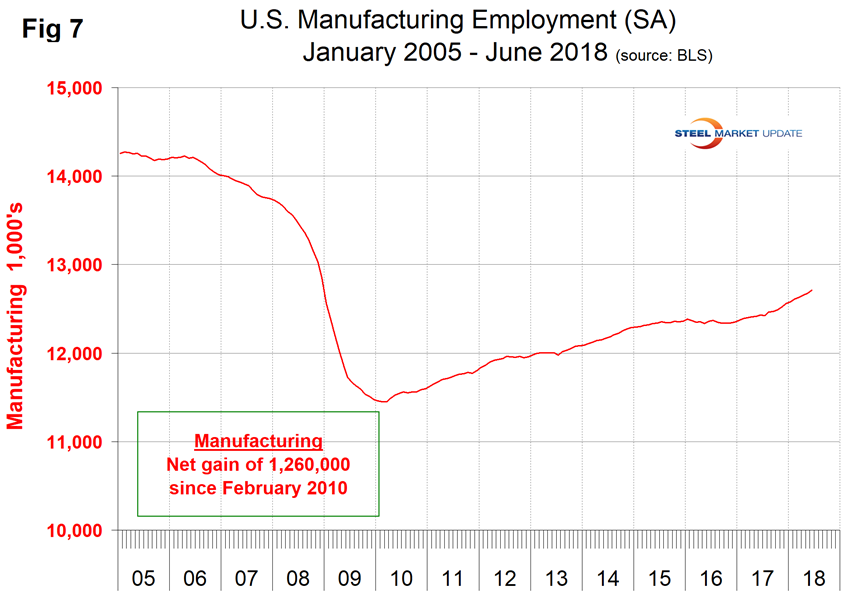
Manufacturing Employment
Manufacturing employment plummeted during the recession and gradually improved from the spring of 2010 through 2014. Growth was flat in 2015 and declined slightly in 2016 when 23,000 jobs were lost during the year as a whole. There was a turnaround in 2017, and in the 10 months August 2017 through June 2018, 289,000 jobs were created in manufacturing (Figure 7). The motor vehicles and parts subcomponent of manufacturing employment had a net gain of only 35,000 in the same time frame.
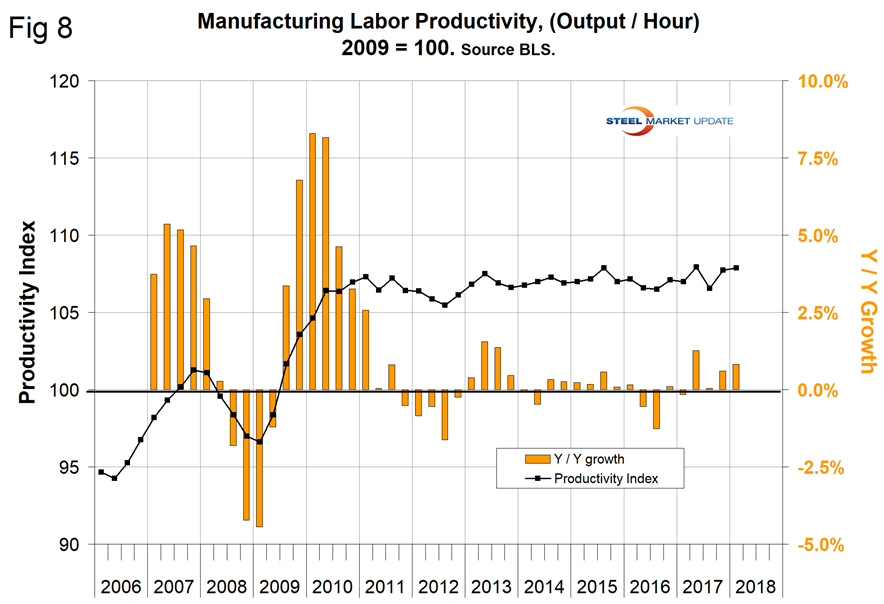
Manufacturing Productivity
The Bureau of Labor Statistics reported that in Q1 2018 manufacturing productivity improved by 0.8 percent year over year (Figure 8). Productivity growth was erratic in 2017, but there has been a gradual improvement for three years.
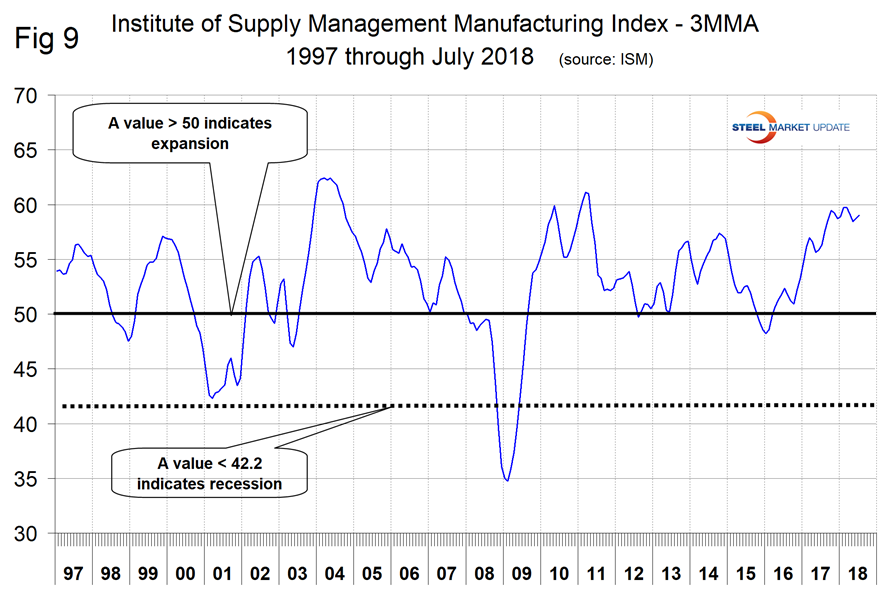
The ISM Manufacturing Index
The Institute for Supply Management’s Manufacturing Index is a diffusion index. ISM states: “Diffusion indexes have the properties of leading indicators and are convenient summary measures showing the prevailing direction of change and the scope of change. An index value above 50 percent indicates that the manufacturing economy is generally expanding; below 50 percent indicates the opposite.” Figure 9 shows the 3MMA of the ISM index from January 1997 through July 2018 with an improving trend since January 2016. In July, the 3MMA of the index at 59.0 was up by 0.27 from June and still historically high.
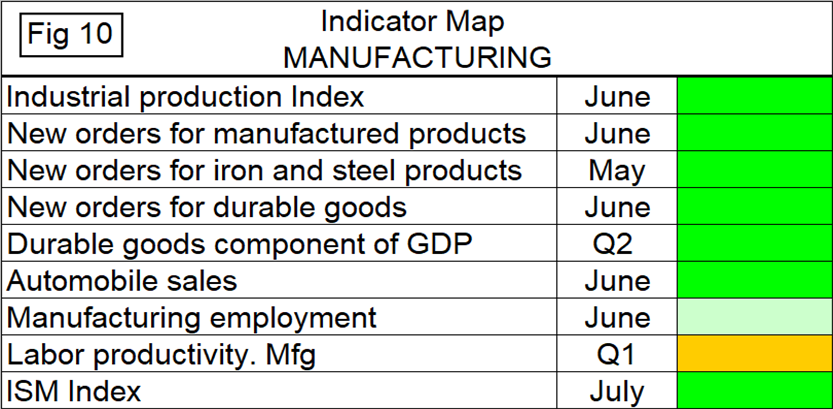
SMU Comment: Figure 10 shows a map of the nine indicators that we are currently tracking. The weakest indicator of these is the increase in labor productivity, which we find surprising considering all we read about artificial intelligence and automation.