

Market Data

August 22, 2018
Architecture Billings Slip in July
Written by Sandy Williams
Architecture billings growth slowed in July, according to the American Institute of Architects. The AIA Architecture Billings Index slipped to 50.7 from 51.3 in June. A score over 50 indicates billing growth, but on a regional basis only the South registered growing demand with an index reading of 55.2. Regional averages in the remainder of the country were West at 49.6, Midwest 49.3 and Northeast 48.0. Architecture billings are considered a leading indicator of construction activity and demand for steel and other construction materials.
“Billings at architecture firms in the South remained robust in July, offsetting declining billings in other regions of the country,” said AIA Chief Economist Kermit Baker. “Despite the dip in the overall ABI number in July, firms are still reporting a healthy increase in new projects.”
The design contracts index posted at 53.8 and the project inquiries index at 50.5.
Planning for multi-family residential led the sector index breakdown with a score of 54.6, followed by institutional at 51.1, commercial/industrial at 50.1 and mixed practice contracting to 48.2.
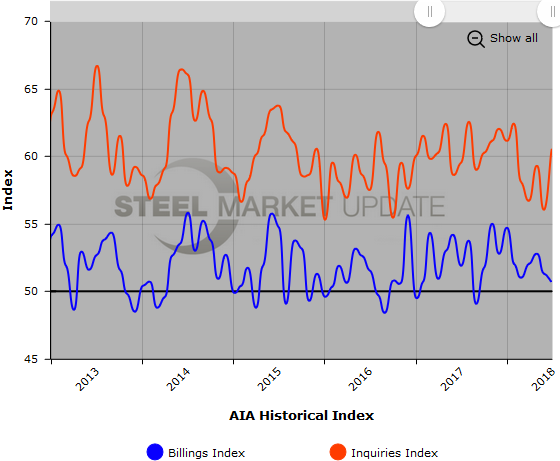
Below is a graph showing the history of the AIA Architecture Billings Index and Inquiries Index. You will need to view the graph on our website to use its interactive features; you can do so by clicking here. If you need assistance logging into or navigating the website, please contact Brett at 706-216-2140 or Brett@SteelMarketUpdate.com.
About the AIA Architecture Billings Index
The Architecture Billings Index (ABI), produced by the American Institute of Architects, reflects the approximate nine- to 12-month lead time between architecture billings and construction spending. The survey panel asks participants whether their billings increased, decreased or stayed the same in the month that just ended. The regional and sector categories are calculated as a three-month moving average, whereas the national index, design contracts and inquiries are monthly numbers. The monthly ABI index scores are centered on the neutral mark of 50, with scores above 50 indicating growth in billings and scores below 50 indicating a decline.


