

Market Data

November 6, 2018
Indicators Strengthening for U.S. Manufacturing
Written by Peter Wright
Steel Market Update is sharing the following Premium-level article with its Executive-level members this issue. For more information on upgrading to a Premium subscription, email info@SteelMarketUpdate.com.
Economic indicators of manufacturing activity remain strong. This report summarizes 11 data streams that describe the state of U.S. manufacturing in general and the steel industry in particular. We have reported on most of these separately in our Steel Market Update publications and therefore will be brief in this summary. We don’t expect these data sources to all point in the same direction. Our intent in summarizing them in one document is to provide a consensus of the state of this critical steel consuming sector. Based on American Iron and Steel Institute estimates of steel mill shipments by market classification, almost 50 percent of the steel consumed in the U.S. is manufacturing-oriented. This breaks down to about 27 percent in ground transportation, 9 percent in machinery and equipment, 5 percent in appliances, 4 percent in defense and about 4 percent in containers.
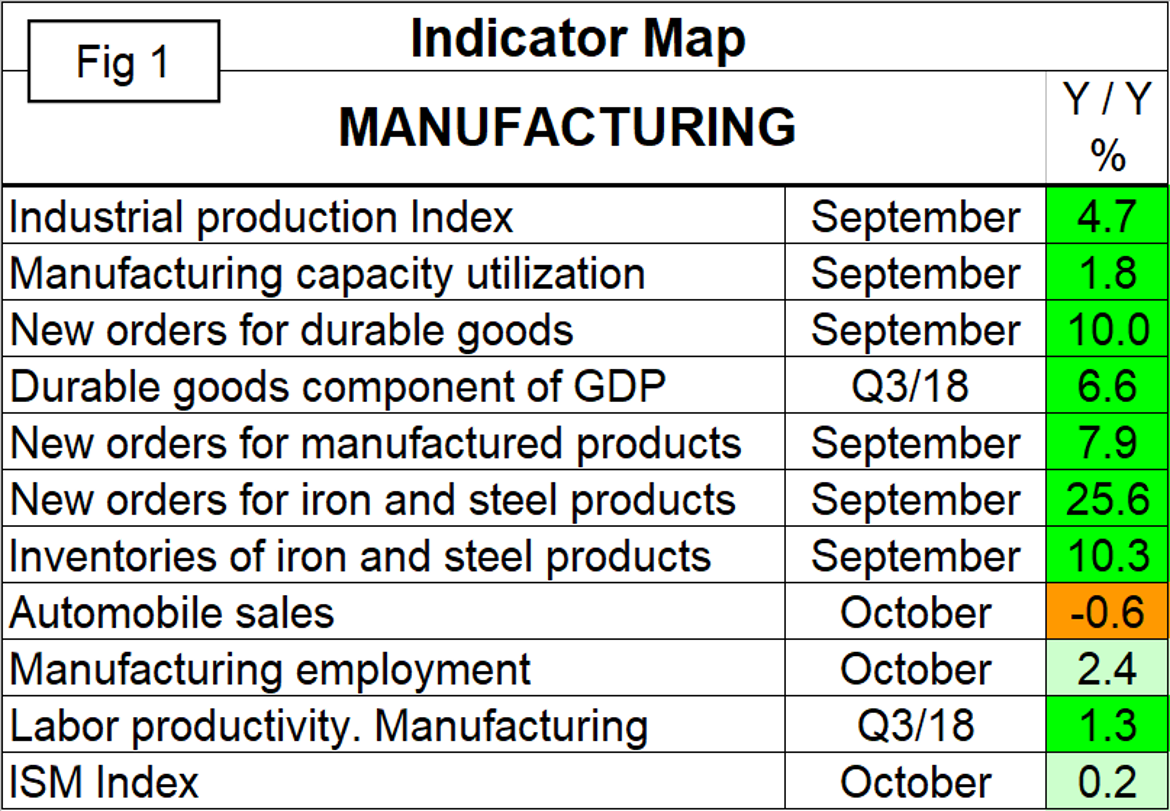
Figure 1 summarizes the 11 individual data streams. All indicators except automobile sales are strengthening.
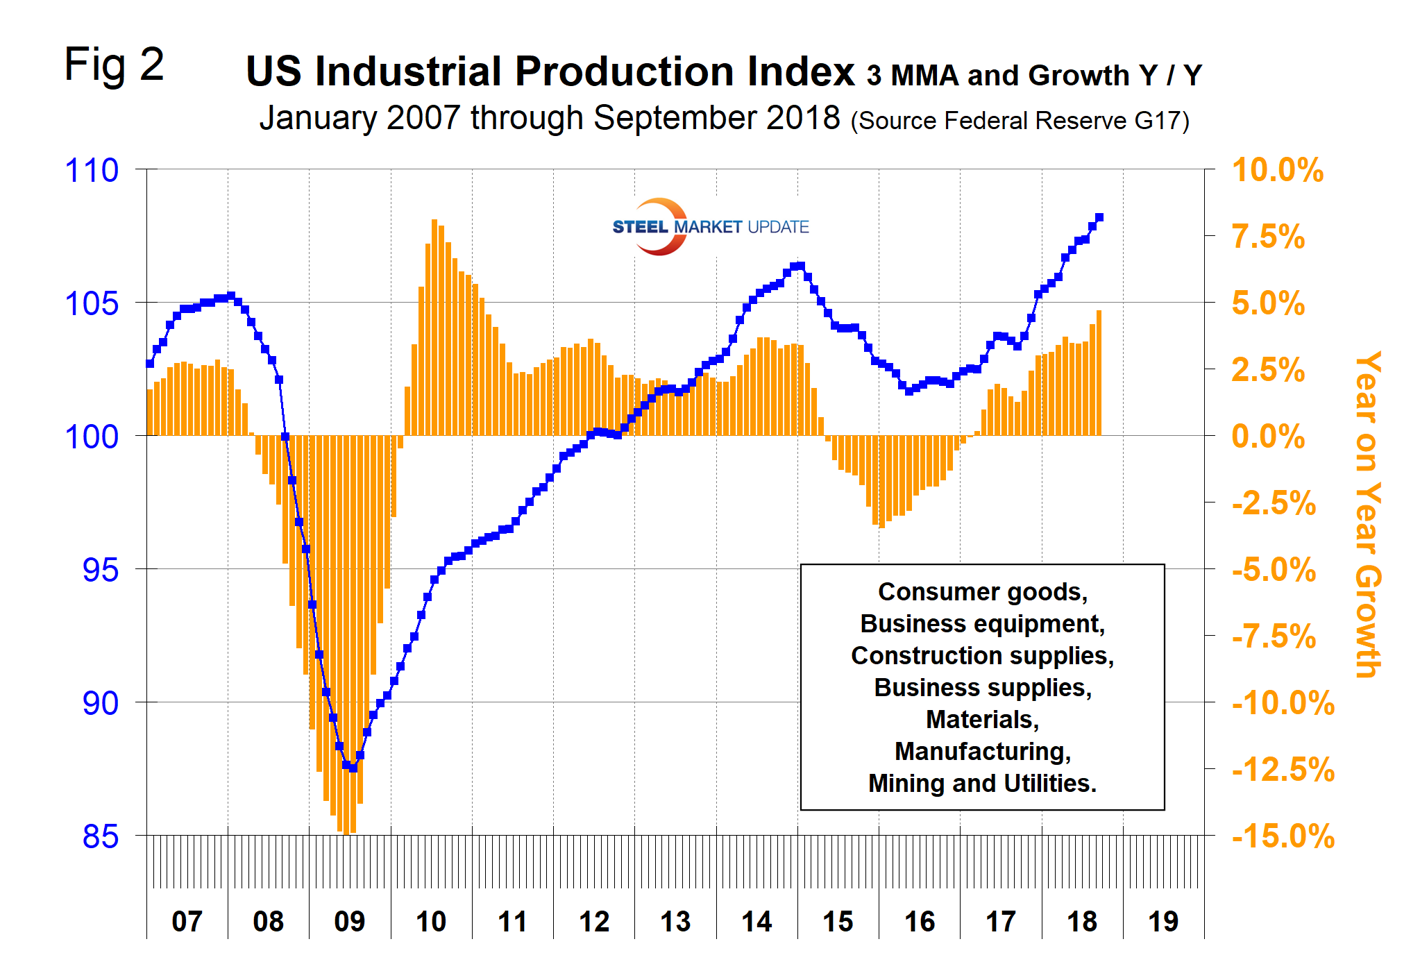
The Industrial Production Index
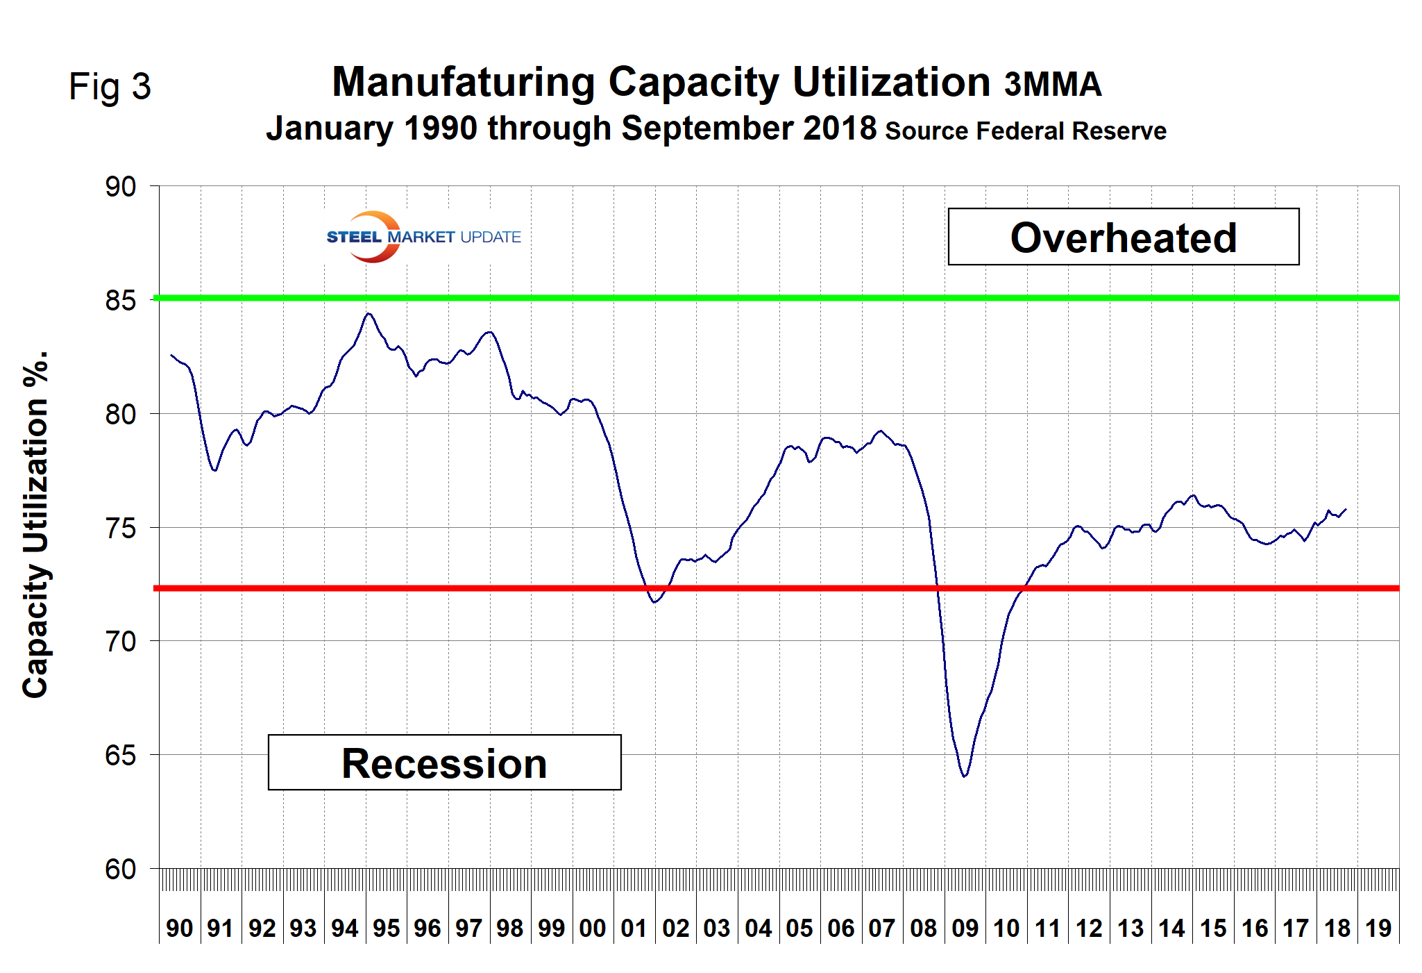
Figure 2 shows the three-month moving average (3MMA) of the IP index since January 2007 as the blue line and the year-over-year growth as the brown bars. March 2017 was the first month of positive growth in the 3MMA since April 2015. Growth has been above 3 percent every month since February, reaching 4.7 percent in September. Manufacturing capacity utilization improved from 74.48 percent in January last year to 75.8 percent in September 2018, also on a 3MMA basis (Figure 3).
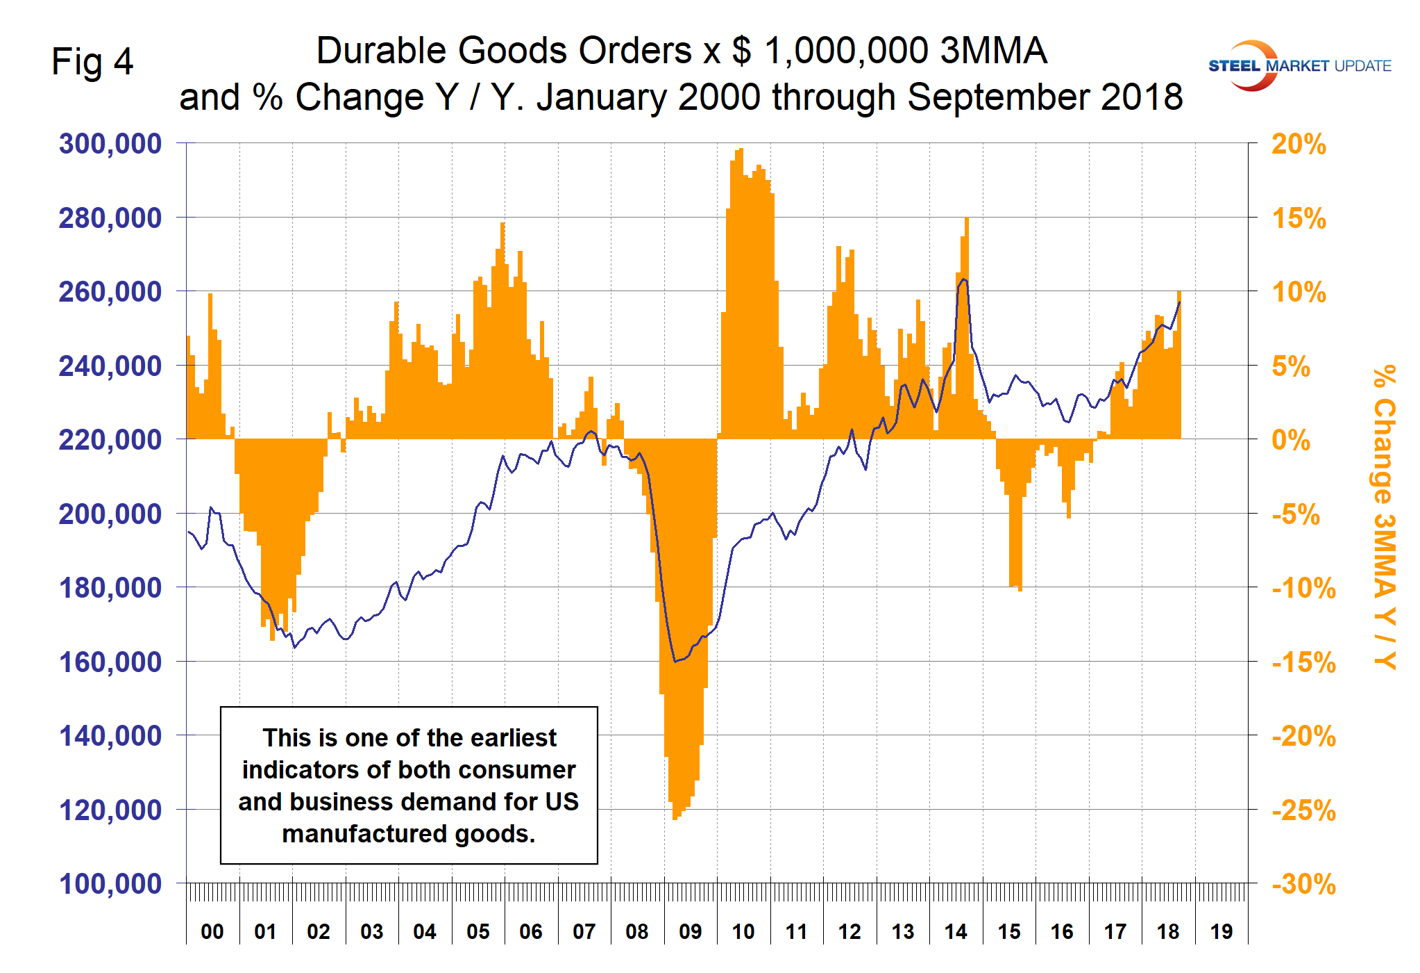
New Orders for Durable Goods (Advance Report)
The U.S. Census Bureau announced last week that new orders for manufactured durable goods in September increased by 1.4 percent on a 3MMA basis month over month and were up by 10.0 percent year over year. Figure 4 shows the 3MMA since January 2010 and that the year-over-year improvement in 2018 has been the highest since 2014. The September increase was mainly driven by the volatile military aircraft segment, which in this instance masked the relevance for steel people. Nevertheless, the underlying trend is good.
The Durable Goods Portion of GDP
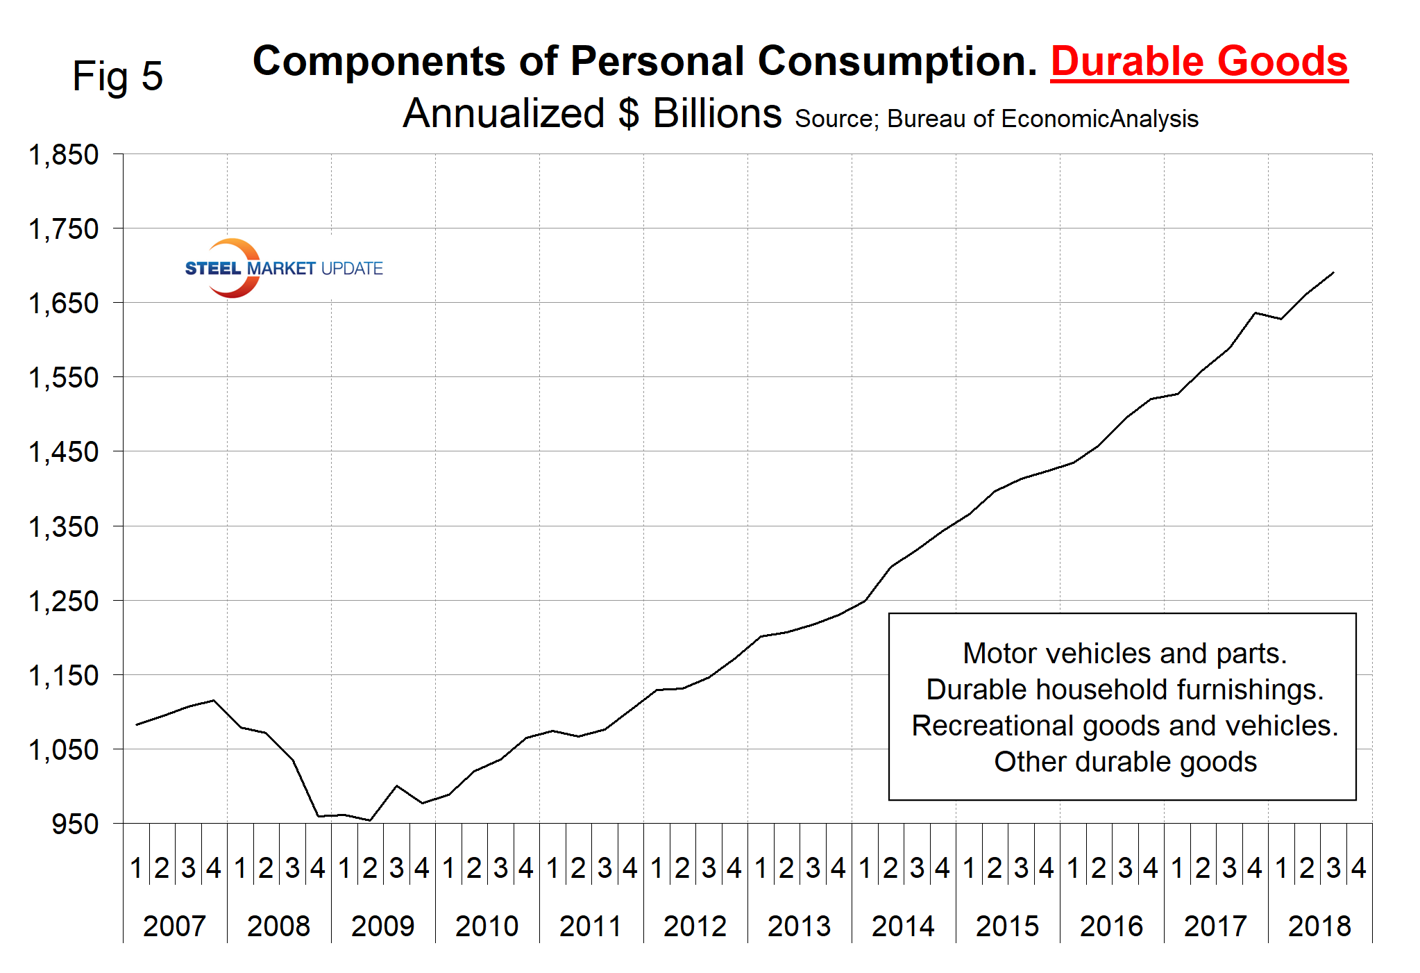
The first estimate of Q3 2018 GDP came in at 3.5 percent annualized growth, which was up from 2.2 percent in Q1 2018. A subcomponent of the quarterly data is durable goods, which is part of the personal consumption calculation. It therefore contains no military hardware or civil aircraft data. This is shown in Figure 5 and, presumably because of the exclusions just mentioned, looks nothing like the blue line in Figure 4. The durable goods portion of GDP declined in Q1 2018, but the long-term trend is still very positive.
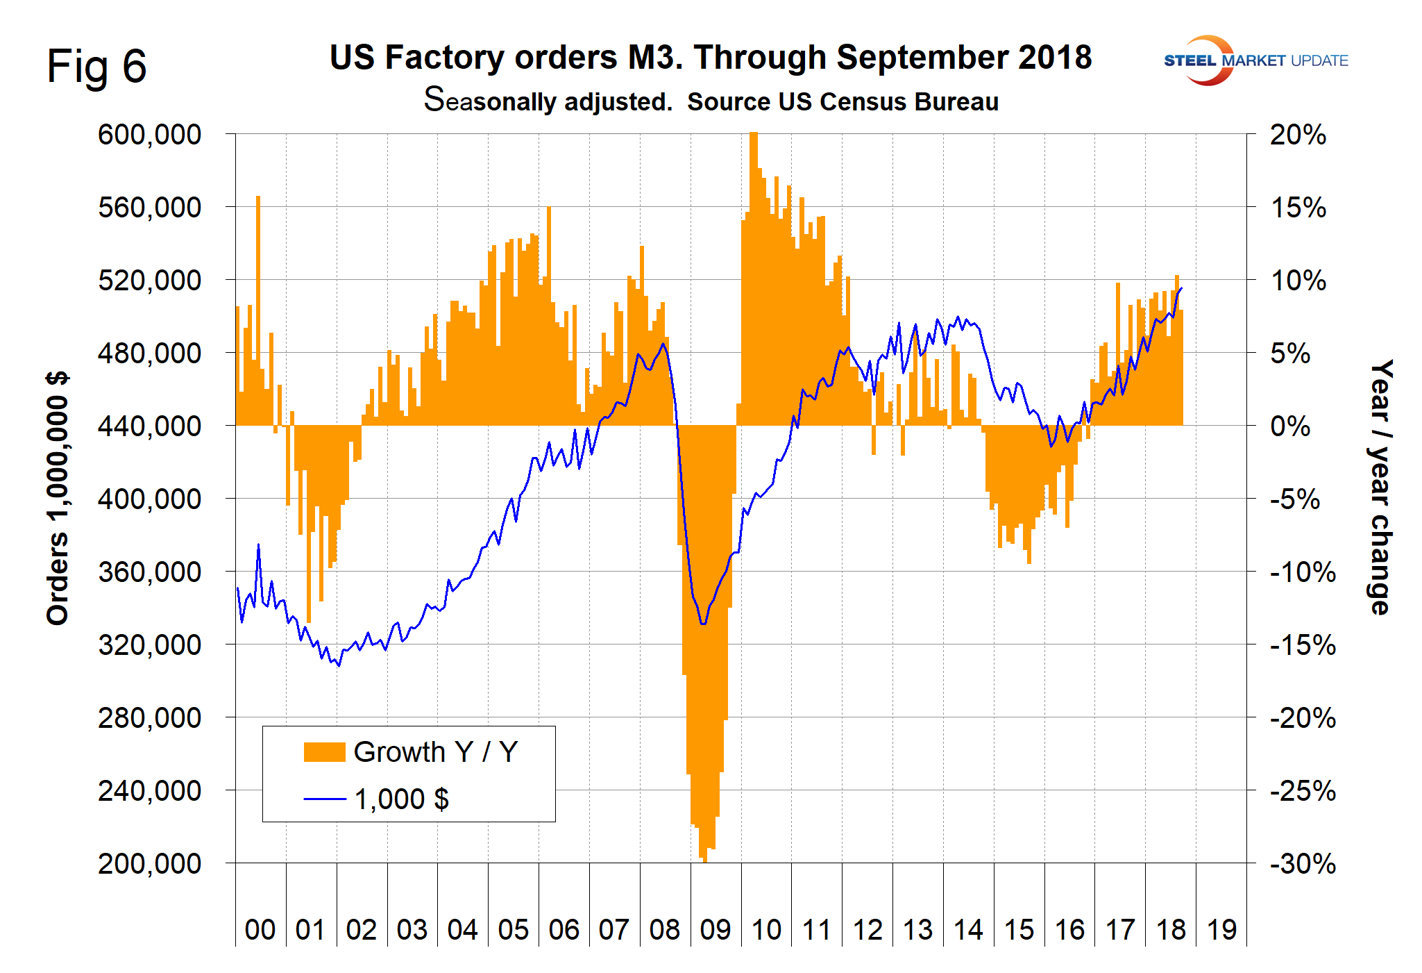
New Orders for Manufactured Products
New orders for manufactured products as reported by the Census Bureau have been steadily increasing since mid-2016. In September, year-over-year growth was 7.9 percent (Figure 6).
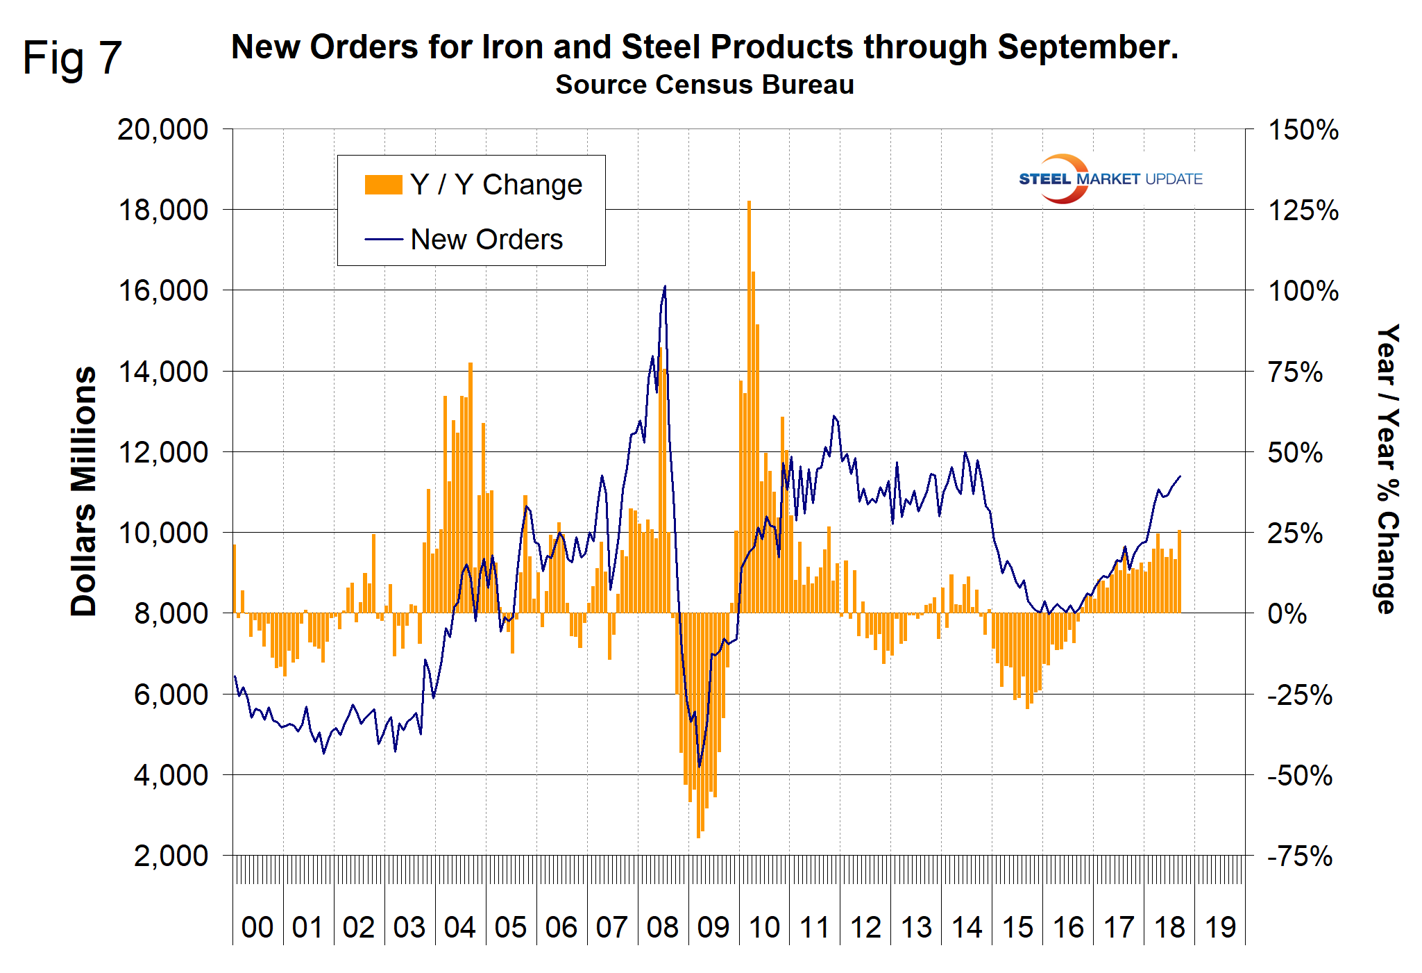
Within the Census Bureau M3 manufacturing survey is a subsection for new orders for iron and steel products. Figure 7 shows the history since January 2000 with an excellent growth rate of 25.6 percent year over year for September.
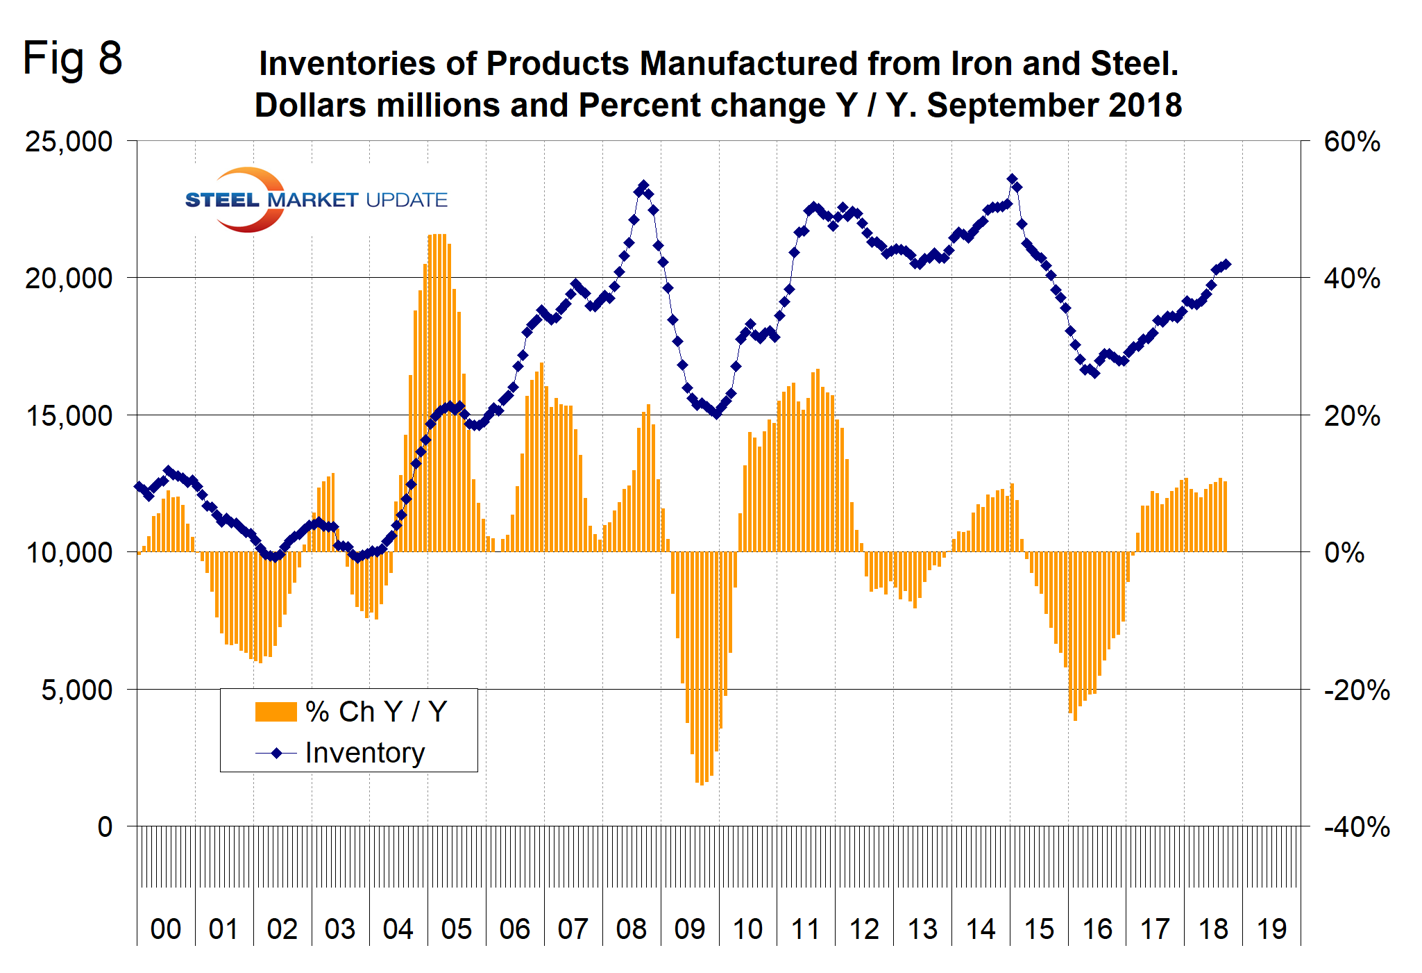
As orders for iron and steel products have surged, inventories have been built in anticipation of a continuation of the excellent order situation. The inventory build was at a rate of 10.3 percent year over year in September (Figure 8).
Light Vehicle Sales in the U.S.
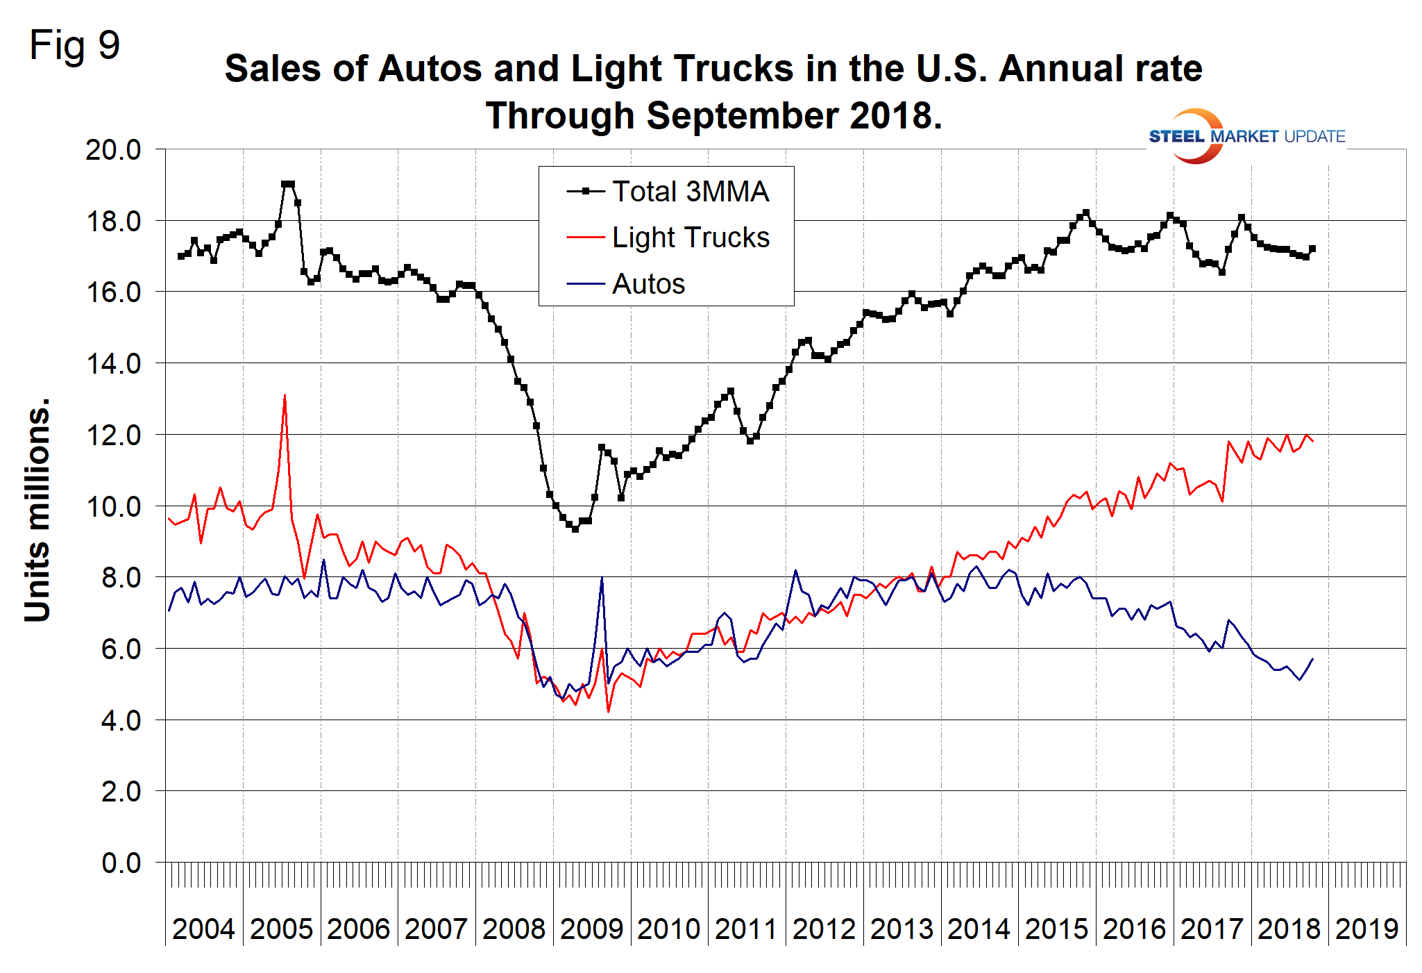
Automobile sales have trended down slightly in the last 2½ years and in October were down by 0.6 percent year over year on a rolling 12-months basis. Sales in September totaled 17.5 million units annualized comprised of 67 percent light trucks and 33 percent autos. The light truck category includes SUVs and crossovers. Sales are still higher than the pre-recession level, but only just (Figure 9). Import market share in September was 22.9 percent and has been drifting up since March last year.
Manufacturing Employment
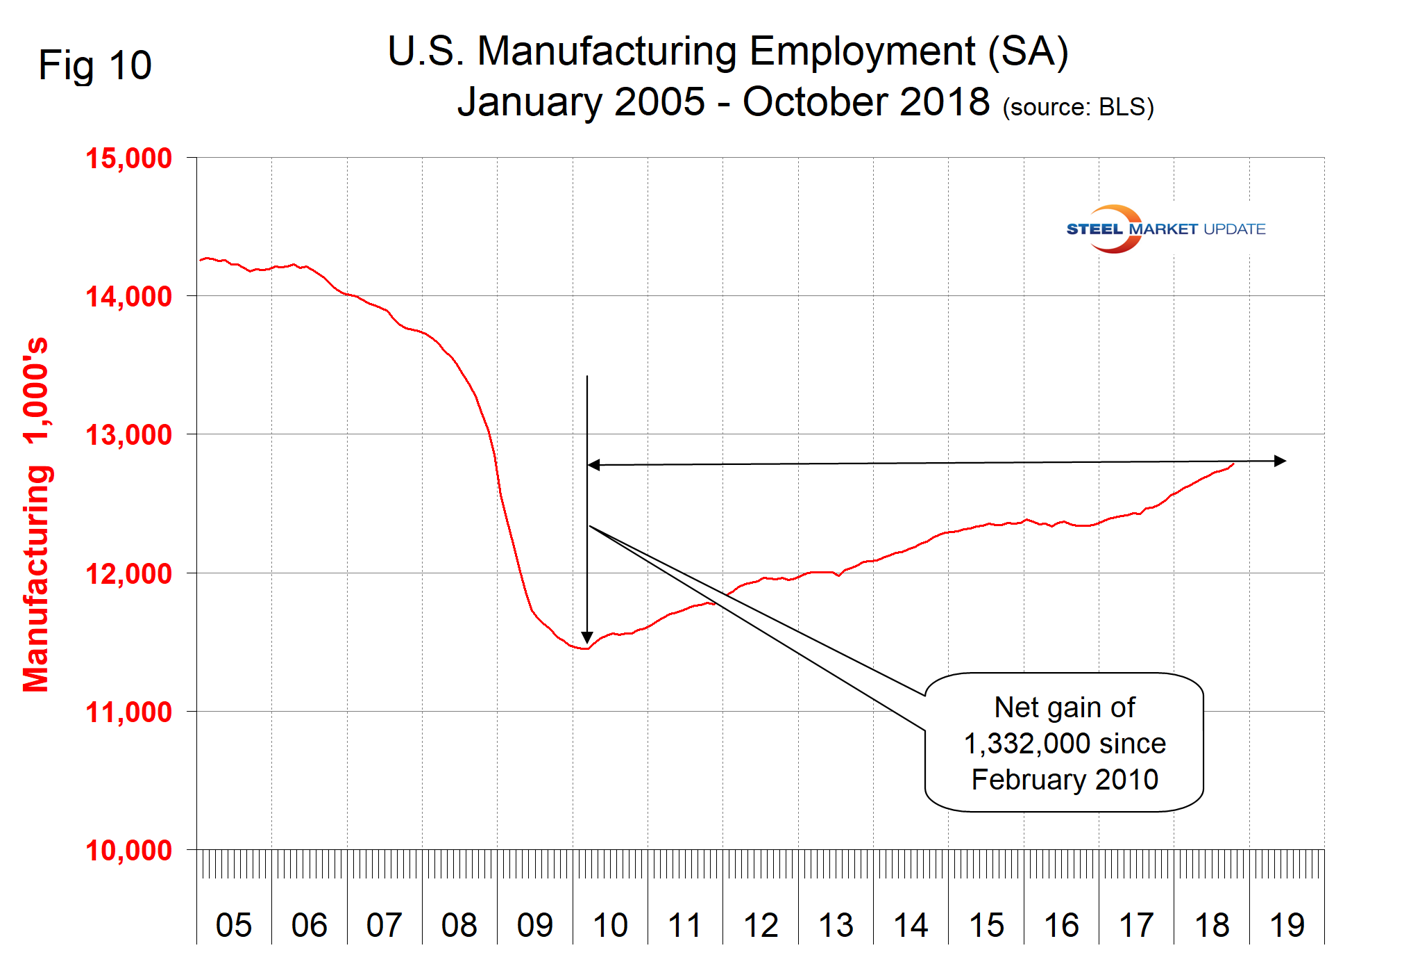
Manufacturing employment plummeted during the recession and gradually improved from the spring of 2010 through 2014. Growth was flat in 2015 and declined slightly in 2016 when 23,000 jobs were lost during the year as a whole. There was a turnaround in 2017, and in the 12 months November 2017 through October 2018, 296,000 manufacturing jobs were created (Figure 10). The motor vehicles and parts subcomponent of manufacturing employment had a net gain of only 19,000 in the same time frame.
Manufacturing Productivity
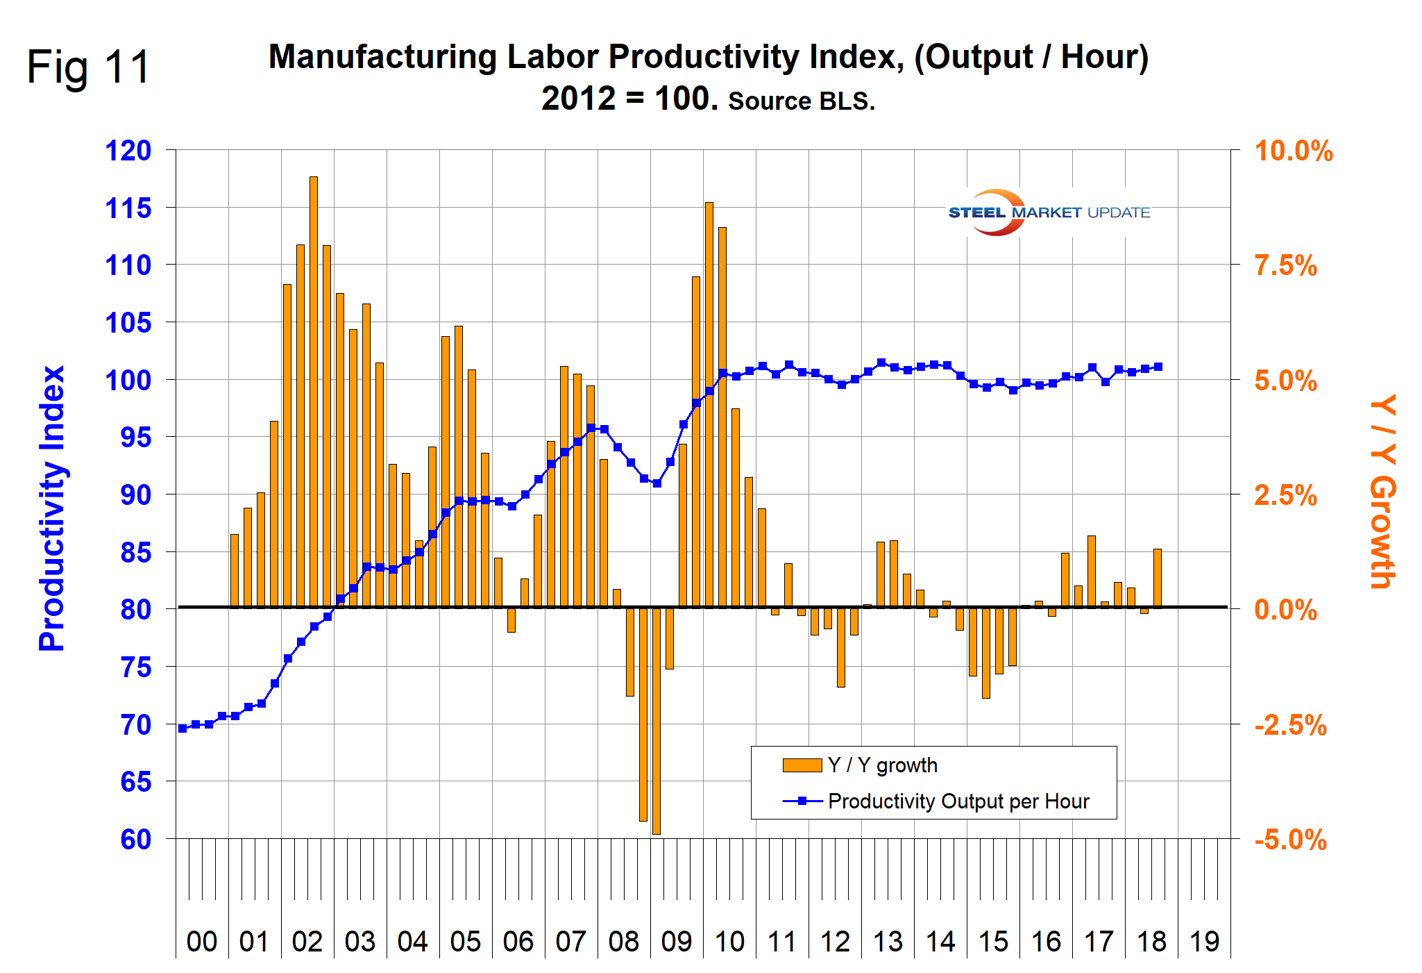
The Bureau of Labor Statistics reported last week that in Q3 2018 manufacturing productivity surged by 1.3 percent year over year, its second-best quarter since Q3 2013 (Figure 11).
The ISM Manufacturing Index
The Institute for Supply Management’s Manufacturing Index is a diffusion index. ISM states: “Diffusion indexes have the properties of leading indicators and are convenient summary measures showing the prevailing direction of change and the scope of change. An index value above 50 percent indicates that the manufacturing economy is generally expanding; below 50 percent indicates the opposite.”
Figure 12 shows the 3MMA of the ISM index from January 1997 through October 2018. The index surged from January 2016 through October 2017, but has since leveled out. In October 2018, the 3MMA of the index was 59.60, down from 59.87 in August, but still eked out a small gain year over year. A value greater than 50 indicates expansion.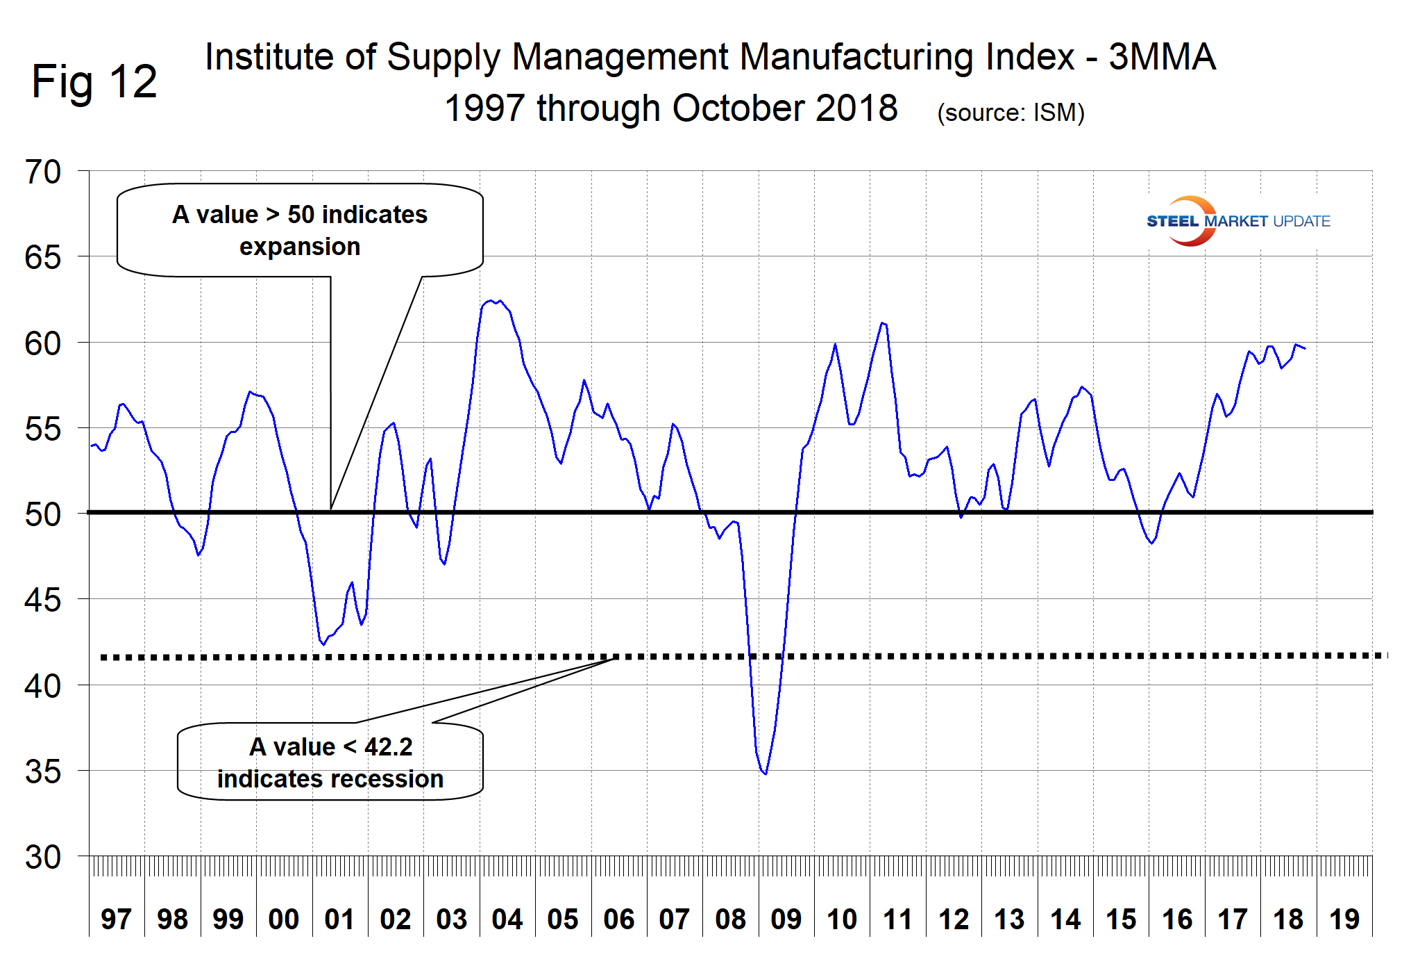
SMU Comment: Manufacturing activity is strong. The most encouraging current data point is the surge in labor productivity in the third quarter. The only slight negative is automobile sales, which have drifted down from an unsustainable level in late 2015 when they reached an annualized rate of over 18 million units.


