

Market Data
April 30, 2019
SMU Energy Analysis: Oil Prices Rebound
Written by Peter Wright
Monthly oil production in the U.S. in January was second only to the all-time high set in December 2018. The price of West Texas Intermediate crude oil had recovered to $63.43/barrel on April 15, up from its recent low of $44.48 on Dec. 27.
On April 23, Economy.com wrote: “Oil prices rebounded in the first quarter following the implementation of OPEC’s cut agreement and plunging Venezuelan output. The price of West Texas Intermediate averaged $54.80 per barrel in the first three months of 2019, still down 13% from a year earlier but up sharply from about $45 per barrel in late 2018. The price of WTI topped $60 per barrel in late March for the first time since early November. Aside from lower OPEC output levels, positive economic news from China and a small drop in U.S. oil output in January also supported prices in early April.”
![]()
The spot price of West Texas Intermediate (WTI) FOB Cushing, Okla., had a recent peak on Oct. 3 of $76.40 / barrel. The price declined to $44.48 on Dec.27 and had recovered to $63.43 on April 15. The total number of operating rigs exploring for oil has declined by 71 since Jan. 4. The prices of oil and natural gas drive the consumption of energy-related steel products including oil country tubular goods, pipe fittings and well head equipment, among others. Welded tubular goods (not including OCTG) consumed about 5.5 million tons of hot rolled sheet in 2018.
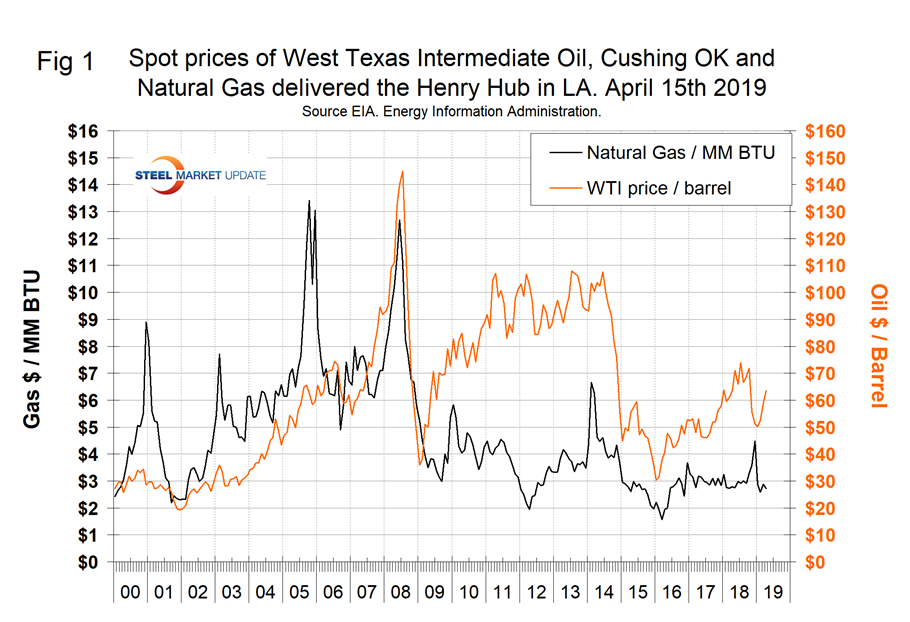
Figure 1 shows historical oil and gas prices from January 2000 through April 15, 2019. Our price and inventory data come from the EIA (Energy Information Administration). On April 15, the WTI priced in Cushing was $63.43 / barrel and on April 12 (latest data available) natural gas at the Henry Hub in Oklahoma was priced at $2.72 / MM BTU.
In its latest short term outlook on April 9, the EIA forecasts Brent crude oil spot prices averaged $66 per barrel in March, up $2/b from February 2019. Brent prices for the first quarter of 2019 averaged $63/b, which is $4/b lower than the same period in 2018. Despite lower crude oil prices than last year, Brent prices in March were $9/b higher than in December 2018, marking the largest December-to-March price increase since December 2011 to March 2012. EIA forecasts Brent spot prices will average $65/b in 2019 and $62/b in 2020, compared with an average of $71/b in 2018. EIA expects that West Texas Intermediate (WTI) crude oil prices will average $8/b lower than Brent prices in the first half of 2019 before the discount gradually falls to $4/b in late-2019 and through 2020. EIA estimates that U.S. crude oil production averaged 12.1 million barrels per day (b/d) in March, up 0.3 million b/d from the February average. EIA forecasts that U.S. crude oil production will average 12.4 million b/d in 2019 and 13.1 million b/d in 2020, with most of the growth coming from the Permian region of Texas and New Mexico. EIA forecasts that dry natural gas production will average 91.0 billion cubic feet per day (Bcf/d) in 2019, up 7.6 Bcf/d from 2018. EIA expects natural gas production will continue to grow in 2020 to an average of 92.5 Bcf/d. EIA expects strong growth in U.S. natural gas production to put downward pressure on prices in 2019 and in 2020. EIA expects Henry Hub natural gas spot prices will average $2.82/MMBtu in 2019, down 33 cents/MMBtu from 2018. The forecasted 2020 Henry Hub spot price is $2.77/MMBtu.
On April 15, the EIA reported that U.S. commercial crude oil inventories (excluding those in the Strategic Petroleum Reserve) declined by 1.4 million barrels from the previous week, but year to date were up by 13.7 million barrels and year over year up by 27.6 million barrels. Figure 2 shows the inventory level, including the strategic petroleum reserve and the year-over-year change.
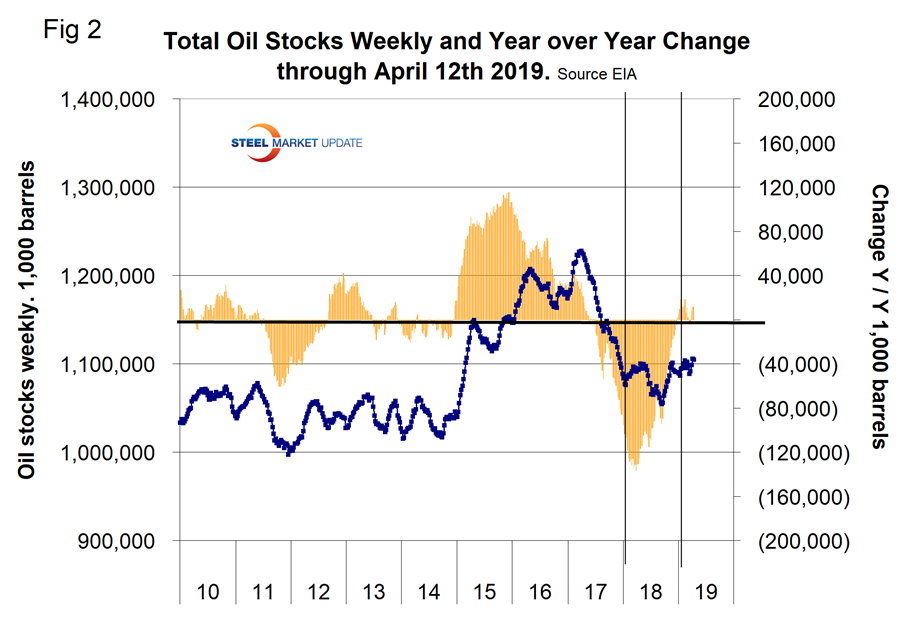
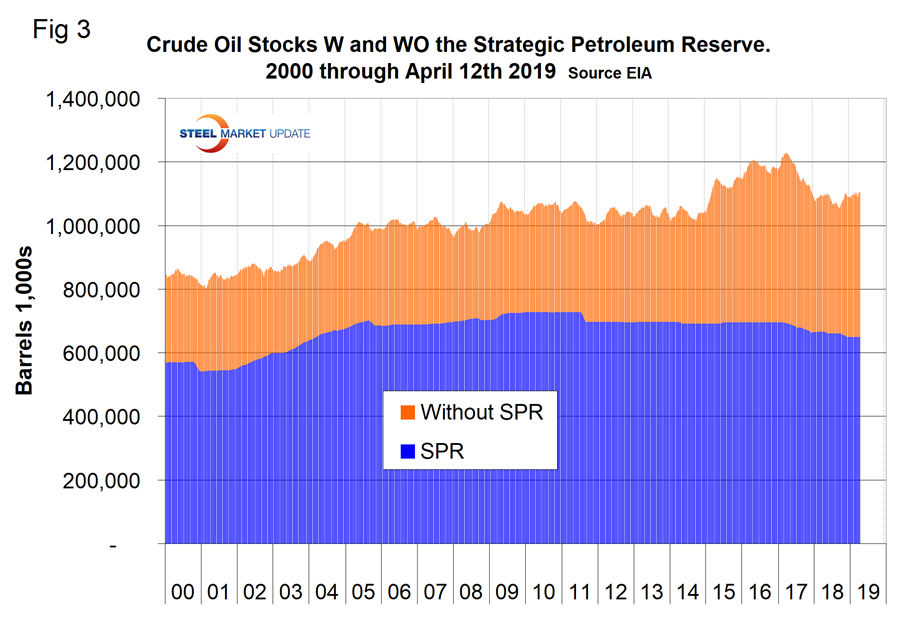
Figure 3 breaks total crude inventory into the working portion and the strategic petroleum reserve.
The total number of operating rigs in the U.S. on April 18 was 1,012, which was down by 71 since Jan. 4. Oil rigs were down by 60 and gas by 11. Figure 4 shows the total number of operating rigs in the U.S. and the weekly change.
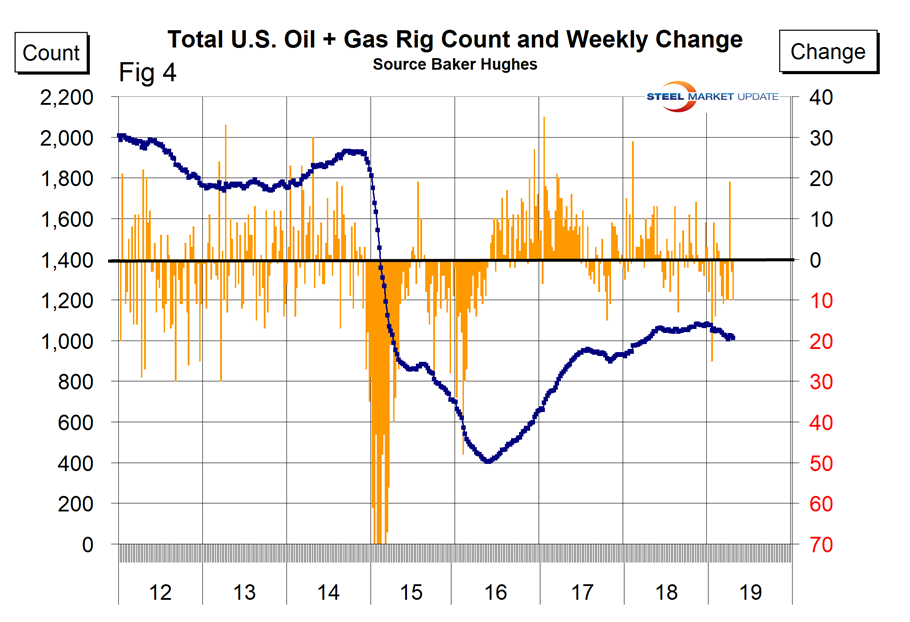
The oil rig count had a low point of 316 on June 27, 2016, and stood at 825 on April 18, 2019. The count has increased by 83 since Jan. 5 last year.
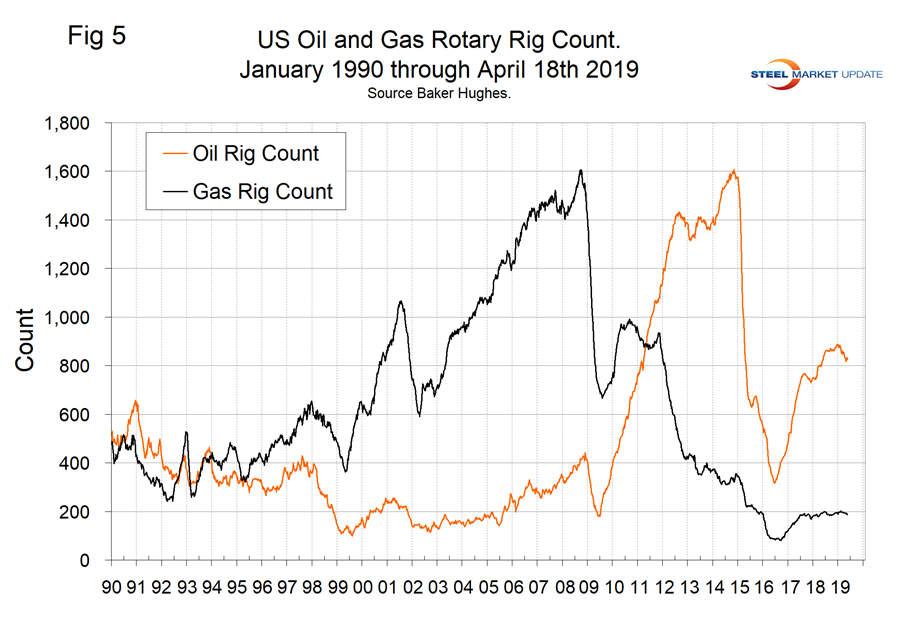
The U.S. gas rig count rose from its low point of 81 on Aug. 5, 2016, to 187 on April 18. The year-over-year growth rate of total U.S. operating rigs was negative 0.1 percent in the latest data with oil up by 0.6 percent and gas down by 2.6 percent. Figure 5 shows the Baker Hughes U.S. Rotary Rig Counts for oil and gas equipment in the U.S. (explanation below).
On a regional basis in the U.S., the big three states for operating rigs are Texas, Oklahoma and North Dakota. Figure 6 shows the land rig count in those states since 2000.
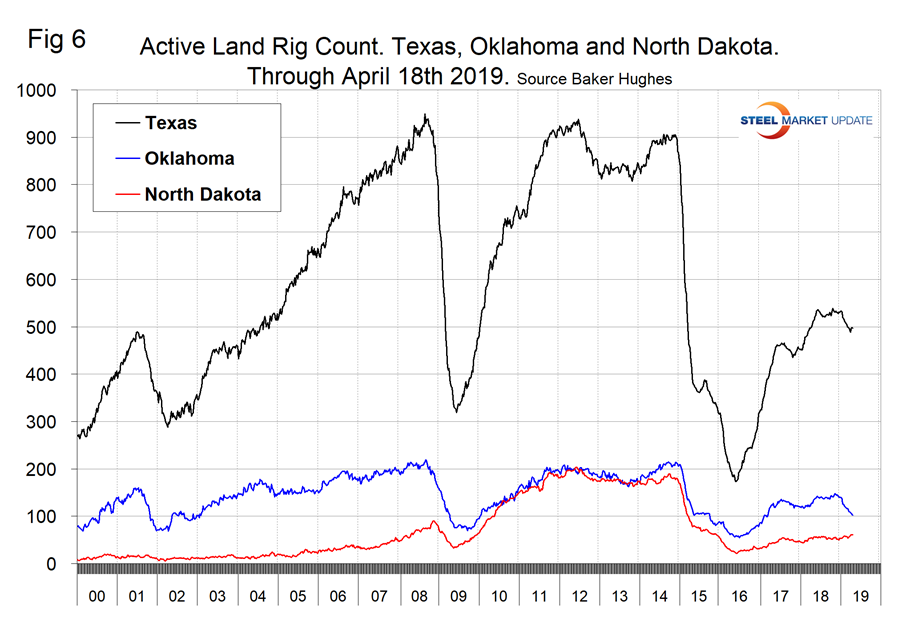
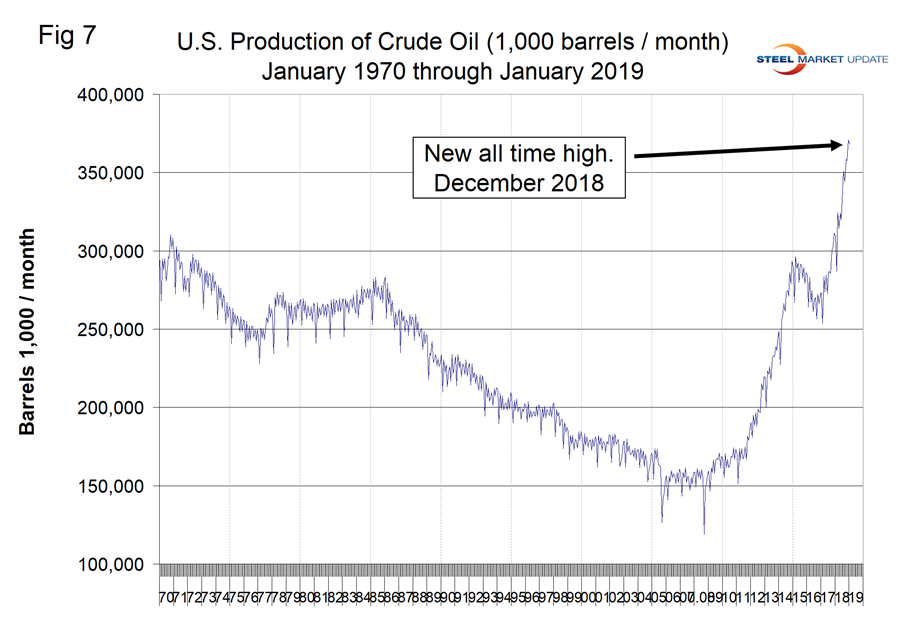
Figure 7 illustrates the monthly U.S. oilfield production of crude from January 1970 through January 2019 (latest data available) in thousands of barrels / month. The historical high was October 1970 at 310.4 million barrels. Production steadily declined to half that level in the late 2000s before the fracking revolution. December 2017 broke the record that had stood for 47 years with 310.7 million barrels produced, and December 2018 set a new record at 370.8 million barrels. January declined to 368 million barrels, but was still the second highest on record.
U.S. exports of total petroleum products set a record high in 2018, reaching an annual average of 5.6 million barrels per day (b/d), an increase of 366,000 b/d from 2017 levels. The three largest petroleum product exports from the United States in 2018 were distillate, propane, and motor gasoline. U.S. exports of motor gasoline (including blending components) and propane reached record highs in 2018, and exports of distillate reached their second-highest volume on record, following the high set in 2017.
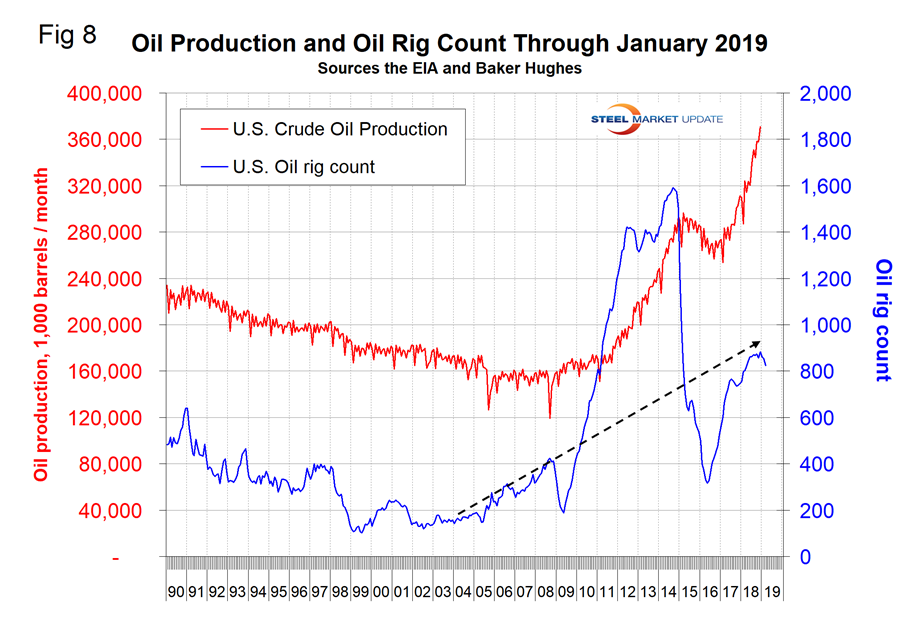
Figure 8 compares oil production and the oil rig count and shows how the increase in exploratory wells drove production from 2009 through late 2014 when the oil price collapsed. The subsequent decline in production was much less marked and is again setting new records.
Baker Hughes Rotary Rig Count: This is a weekly census of the number of drilling rigs actively exploring for or developing oil or natural gas in the United States. Rigs are considered active from the time they break ground until the time they reach their target depth and may be establishing a new well or sidetracking an existing one. The Baker Hughes Rotary Rig count includes only those rigs that are significant consumers of oilfield services and supplies.


