

Market Data
September 18, 2019
SMU Energy Analysis: Drone Strike Shakes Up World Oil Market
Written by Peter Wright
The weekend drone strikes against Saudi oil production sent WTI futures as much as 15.5 percent higher overnight Sept. 15 to $63.34 per barrel, the biggest intraday percentage gain since June 22, 1998, according to various reports. The market is watching intently to gauge the duration and the impact of the outage on world energy prices.
![]()
On Sept. 16, Warren Patterson of ING wrote: “Early Saturday saw the use of drones to attack crude oil processing plants in Saudi Arabia, with the 7MMbbls/d Abqaiq plant hit, whilst the 1.45MMbbls/d Khurais oilfield was also hit. The Saudi energy ministry has said as a result of the attacks, 5.7MMbbls/d of crude oil output has been affected, along with 2bcf/d of natural gas production. The Iranian-backed Houthis in Yemen have claimed responsibility for the attack, and it follows the attacks we saw on Saudi oil infrastructure earlier this summer. However, this time around it has been significantly more disruptive, with 58 percent of Saudi oil output affected. Clearly, these latest developments are bullish for the oil market. In recent months, market participants have failed to price in a risk premium around Middle East tensions, despite a number of incidents over the summer. Instead, the market has been focused on trade developments and the broader macro environment. However, now with almost 20 percent of OPEC production taken offline over the weekend, this is likely to change. How bullish will really depend on how long the outage lasts. There have been reports that production could return to normal in a matter of days, which, if the case, means the upside would reflect more of a risk premium rather than a significant tightening in the market. However, we believe any indication or confirmation from the Saudis of a prolonged outage would see Brent trading back above U.S.$70/bbl in the near term.”
In response to the disruption in Saudi oil production, President Trump authorized a release of crude from United States’ Strategic Petroleum Reserve, as necessary.
The prices of oil and natural gas drive the consumption of energy-related steel products including oil country tubular goods, pipe fittings and well head equipment, among others. Welded tubular goods (not including OCTG) consumed about 5.5 million tons of hot rolled sheet in 2018.
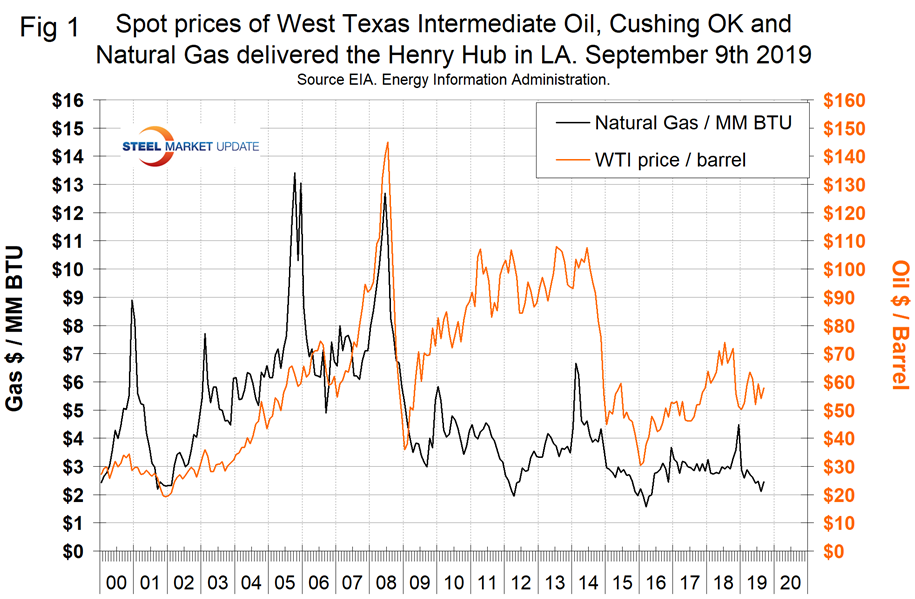
Figure 1 shows historical oil and gas prices from January 2000 through Sept. 9, 2019. This is the latest data from the Energy Information Administration (EIA), which is the source of our price, production and inventory data. On Sept 9, WTI was priced on the spot market at $58.88 per barrel, up from $46.31 on Jan. 2. On Sept.6, natural gas at the Henry Hub in Oklahoma was priced at $2.46 per MMBtu, (million British Thermal Units.) up 35 cents on the month and down from $2.92 on Jan. 2.
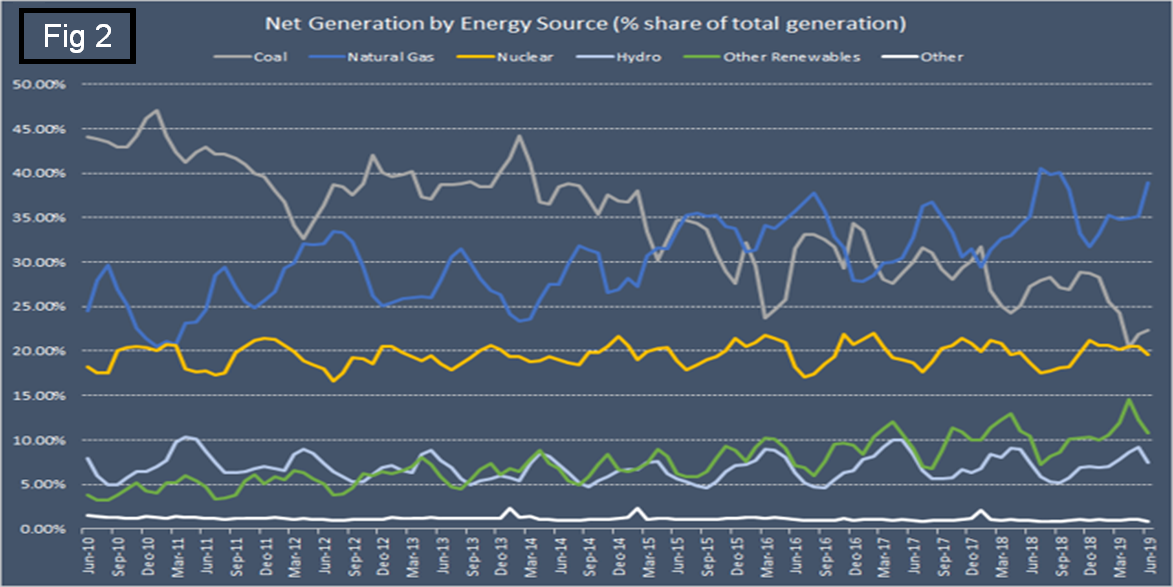
The latest data indicates that the weight of the electric power sector in the natural gas market continues to grow. The EIA’s latest Electric Power Monthly Report shows that, in June, the share of total electricity supplied by natural gas-fired power plants increased by more than 3 percentage points year over year, from 35.13 percent to 38.91 percent (Figure 2). It was the largest share of natural gas-fired generation for the month of June ever recorded. At the same time, the share of coal has dropped by more than 4 percentage points over the same period to just over 22.00 percent.
On Sept. 6, the EIA reported that U.S. commercial crude oil inventories (excluding those in the Strategic Petroleum Reserve) declined for the fourth consecutive week. Figure 3 shows the inventory level, including the strategic petroleum reserve and the year-over-year change.
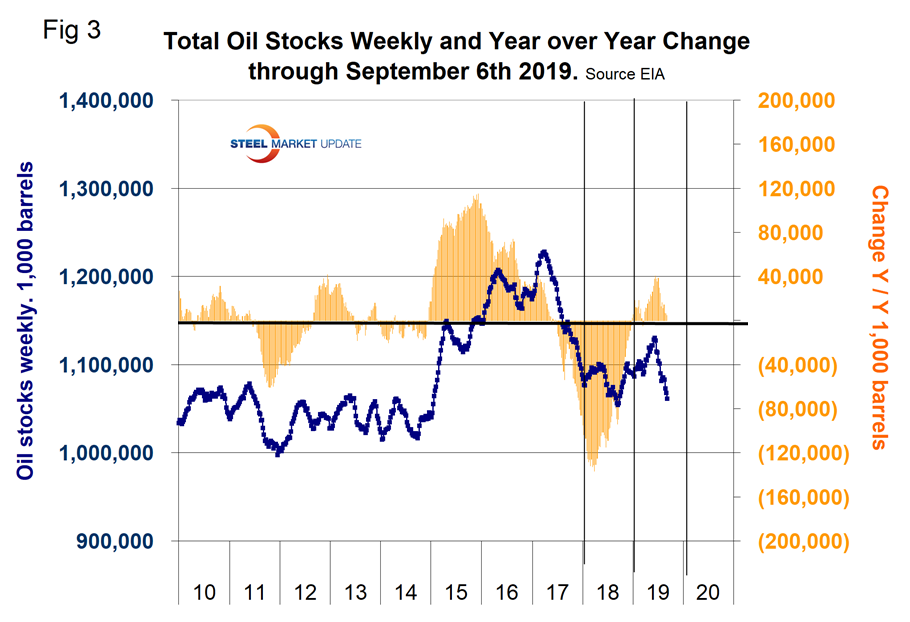
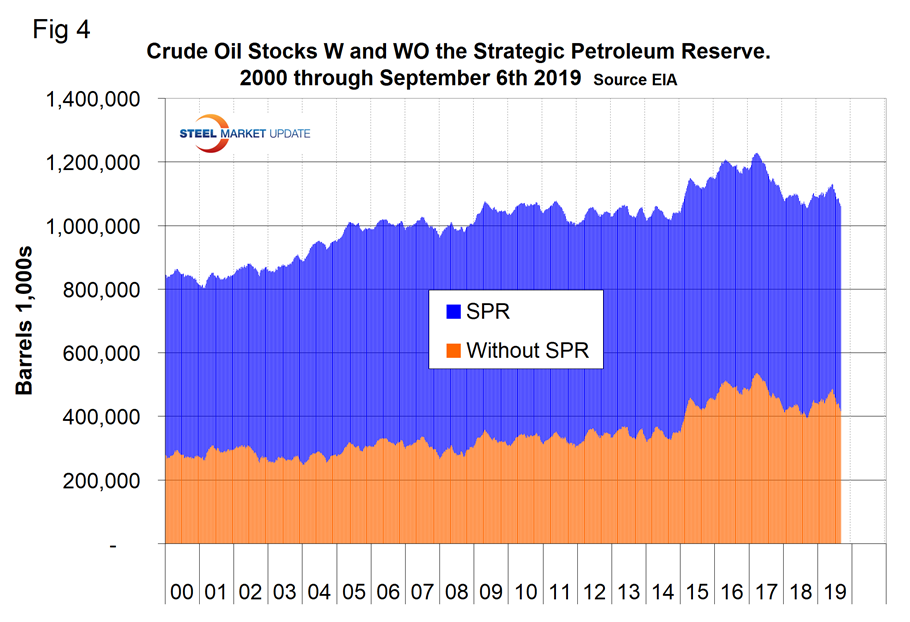
Figure 4 breaks total crude inventory into the working portion and the strategic petroleum reserve.
The total number of operating rigs in the U.S. on Sept. 13 was 886, down by 197 since the end of last year. Oil rigs were down by 152 and gas by 45. Figure 5 shows the total number of operating rigs in the U.S. and the weekly change.
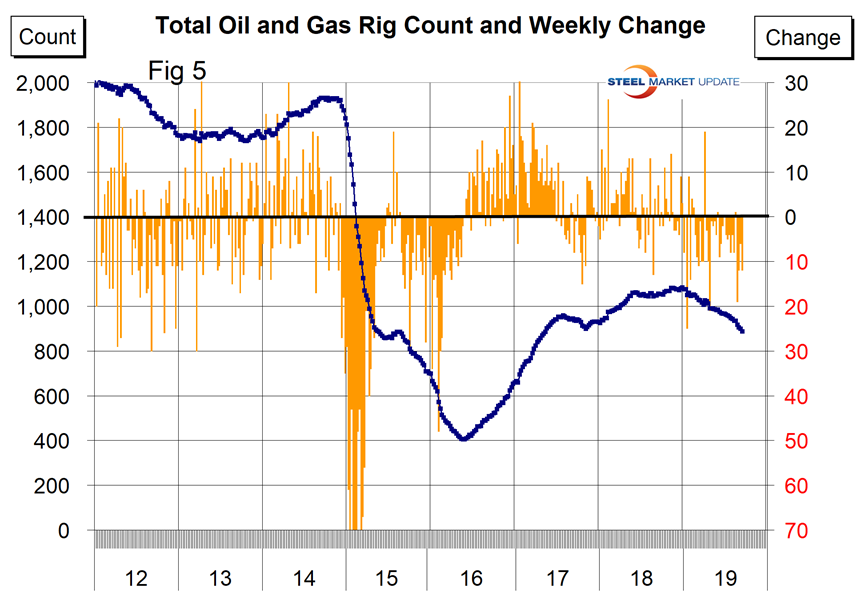
The oil rig count had a low point of 316 on June 27, 2016, and stood at 733 on Sept. 13, 2019.
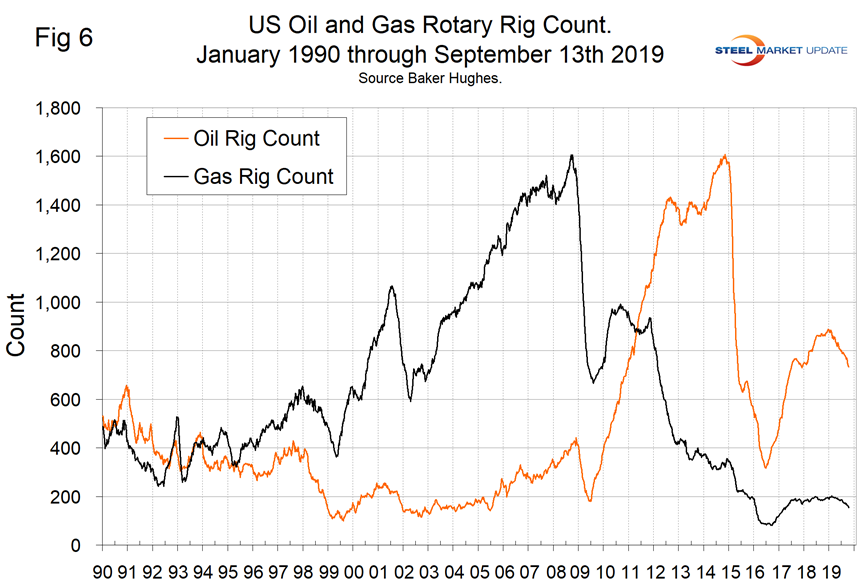
The U.S. gas rig count rose from its low point of 81 on Aug. 5, 2016, to 202 on Jan. 11, 2019, before falling back to 153 on Sept. 13, 2019. The year-over-year growth rate of total U.S. operating rigs was negative 16.0 percent in the latest data with oil down by 15.5 percent and gas down by 17.7 percent. Figure 6 shows the Baker Hughes U.S. Rotary Rig Counts for oil and gas equipment in the U.S. (explanation below).
On a regional basis in the U.S., the big three states for operating rigs are Texas, Oklahoma and North Dakota. Figure 7 shows the land rig count in those states since 2000.
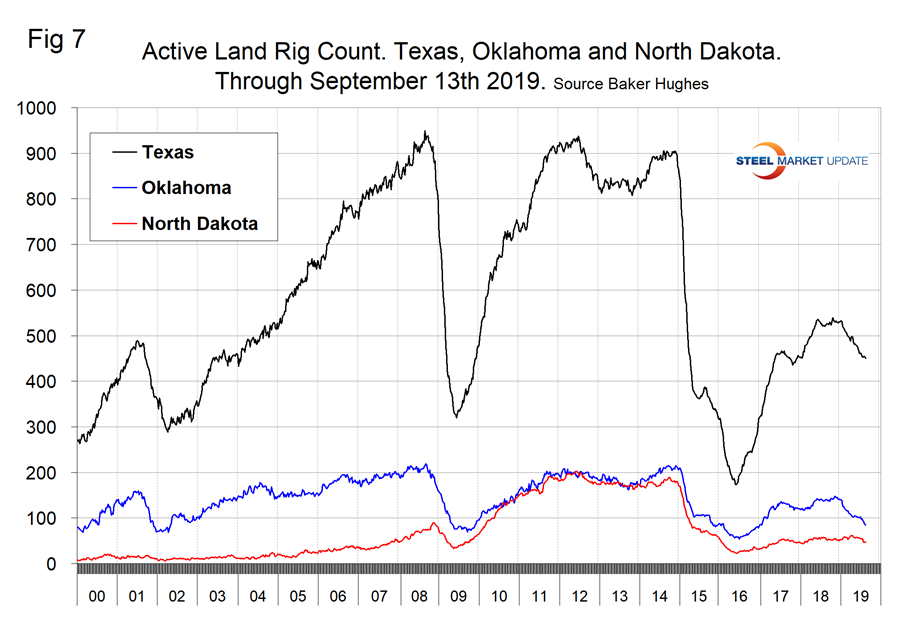
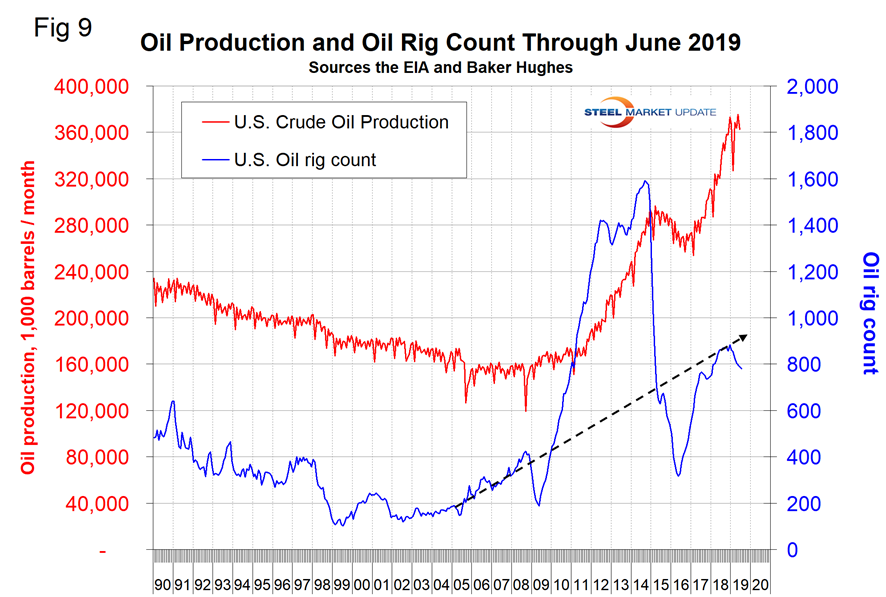
Figure 8 illustrates the monthly U.S. oilfield production of crude from January 1970 through June 2019 (latest data available) in thousands of barrels per month. The historical high was October 1970 at 310.4 million barrels. Production steadily declined to half that level in the late 2000s before the fracking revolution. December 2017 broke the record that had stood for 47 years with 311.2 million barrels produced. May 2019 set another record of 375.6 million barrels and June declined slightly to 362.5 million barrels.
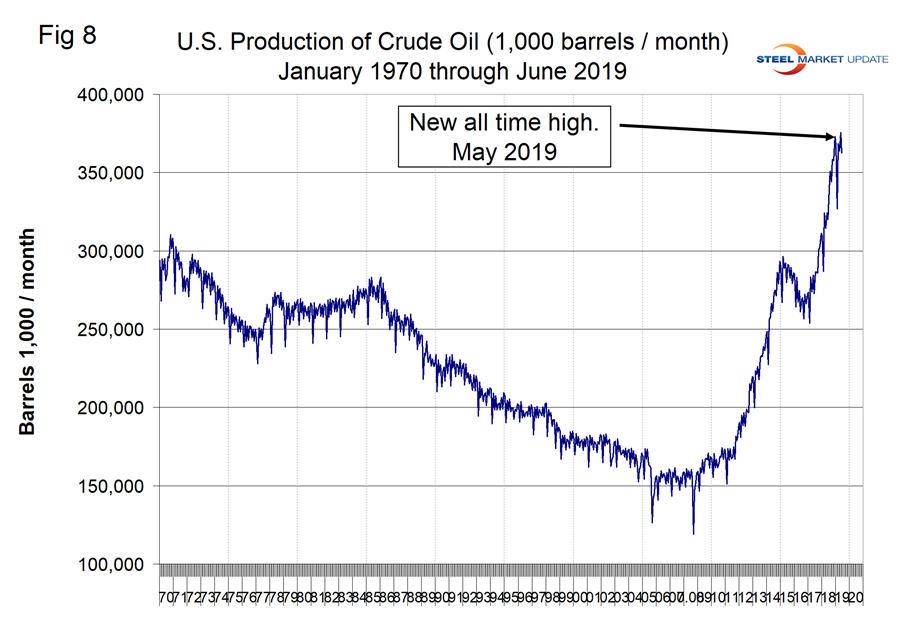
Figure 9 compares oil production and the oil rig count and shows how the increase in exploratory wells drove production from 2009 through late 2014 when the oil price collapsed.
Baker Hughes Rotary Rig Count: This is a weekly census of the number of drilling rigs actively exploring for or developing oil or natural gas in the United States. Rigs are considered active from the time they break ground until the time they reach their target depth and may be establishing a new well or sidetracking an existing one. The Baker Hughes Rotary Rig count includes only those rigs that are significant consumers of oilfield services and supplies.


