

Market Data

October 1, 2019
Global Steel Production: China’s Domination Increases
Written by Peter Wright
From June through August, global steel production increased by 3.1 percent, but excluding China, growth declined by 2.1 percent with the result that China’s share reached another all-time high of 55.9 percent.
We have a new perspective this month on global capacity. About a year ago, the World Steel Association stopped reporting global capacity utilization for antitrust reasons. This responsibility was handed over to the OECD, which has now released its estimates of capacity by nation for 2018 and annually back to 2000. The OECD publishes a single annual global number that we have now incorporated into our data for the last 18 years. We have included the U.S. and China capacity and capacity utilization in this update. At the end of this piece is the latest statement from the OECD on global steel capacity.
![]()
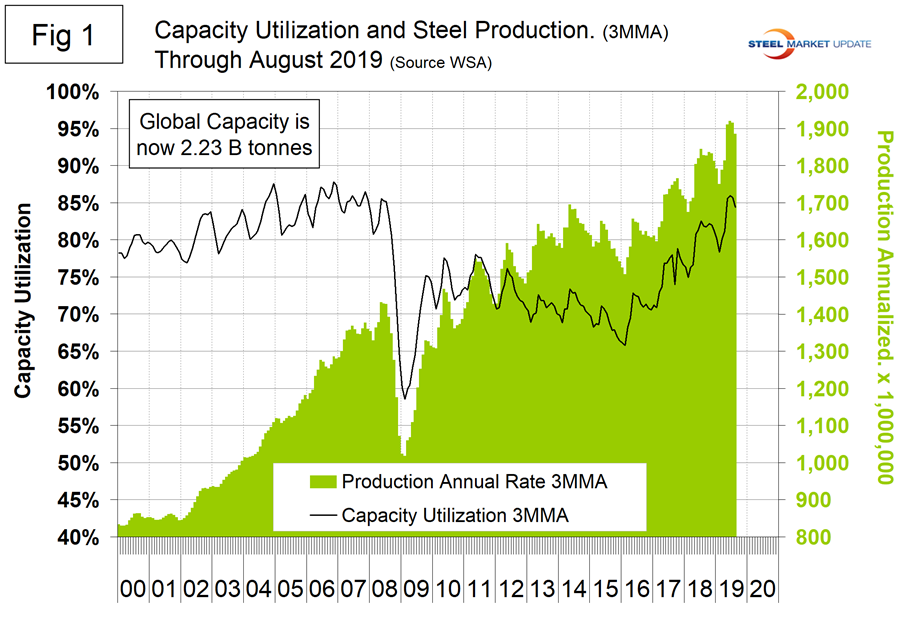
Figure 1 shows annualized monthly production on a three-month moving average (3MMA) basis and capacity utilization since January 2000. The OECD data shows that global capacity declined each year 2016 through 2018, a fact we weren’t aware of and that the WSA results did not indicate. Capacity in 2018 was 2.234 billion metric tons, down from 2.322 billion tons in 2015. Based on the OECD data, capacity utilization is higher than we have previously reported and in August on a 3MMA basis was 84.4 percent. On a tons-per-day basis, production in August was 5.033 million metric tons, down from June’s all-time high of 5.299 million metric tons.
On average, global production on a tons-per-day basis peaked in the early summer in the years 2010 through 2016, but in 2017 and 2018 the second half downtrend was delayed until the fourth quarter. Figure 2 shows the average tons per day of production for each month since 2011. On average, August decreased 0.65 percent. This year, August decreased by 0.11 percent.
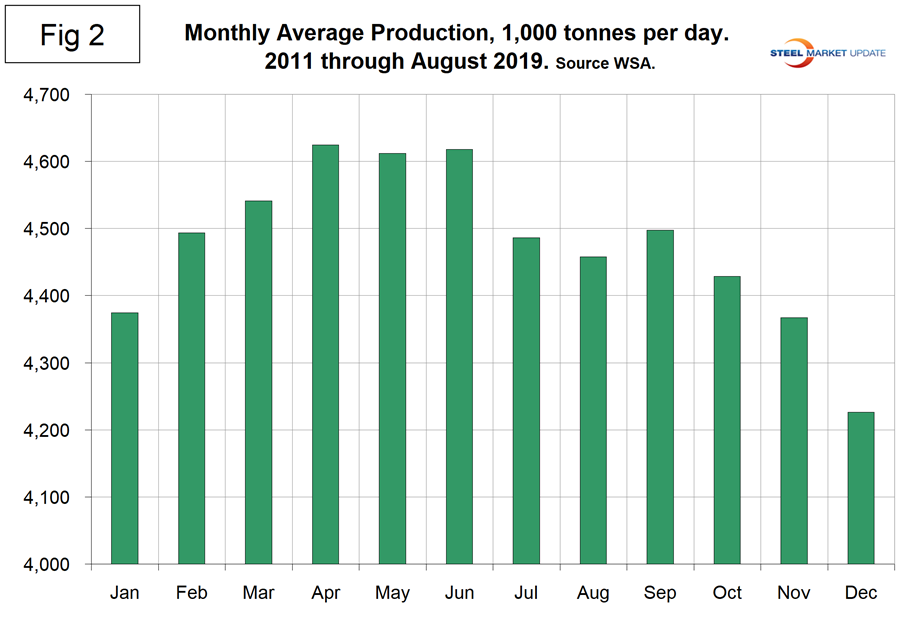
Figure 3 shows the year-over-year growth rate of global production since January 2005. Growth in three months through August was 3.1 percent, down from 5.9 percent in April and May. All of this growth occurred in China. In the rest of the world, growth of steel production was negative 2.1 percent in three months through August.
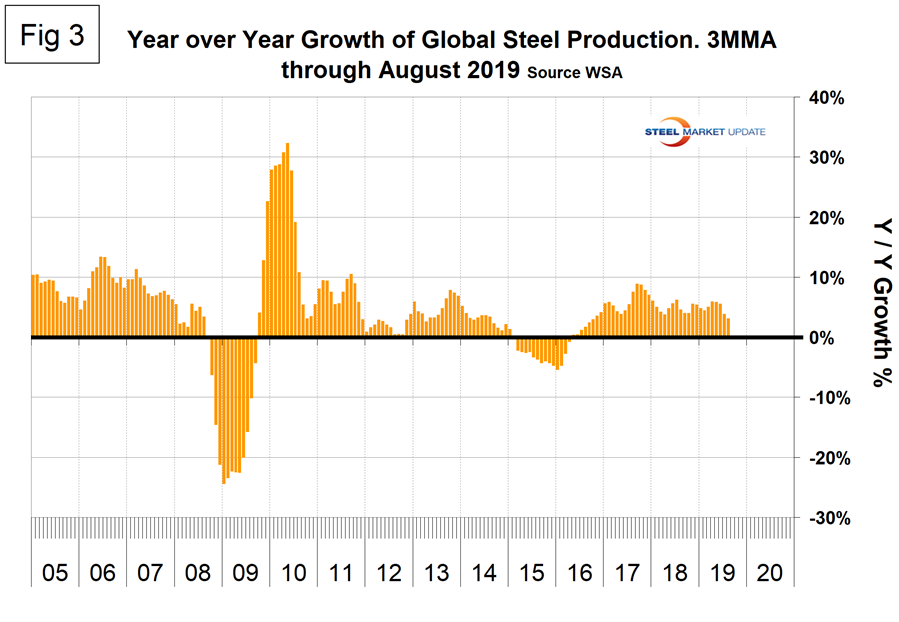
Table 1 shows global production broken down into regions, the production of the top 10 nations in the single month of August, and their share of the global total. It also shows the latest three months and 12 months of production through August with year-over-year growth rates for each period. Regions are shown in white font and individual nations in beige. The world overall had positive growth of 3.1 percent in three months and 4.8 percent in 12 months through August. When the three-month growth rate is lower than the 12-month growth rate, as it was in July and August, we interpret this to be a sign of negative momentum. On the same basis in August, China grew by 7.8 percent and 9.2 percent, therefore also had negative momentum. All regions except Asia had negative growth in three months through August year-over-year. Table 1 shows that North America was down by 1.9 percent in three months. Within North America, production was up by 1.1 percent in the U.S., down by 0.2 percent in Canada and down by 15.6 percent in Mexico. (Canada and Mexico are not shown in Table 1.)
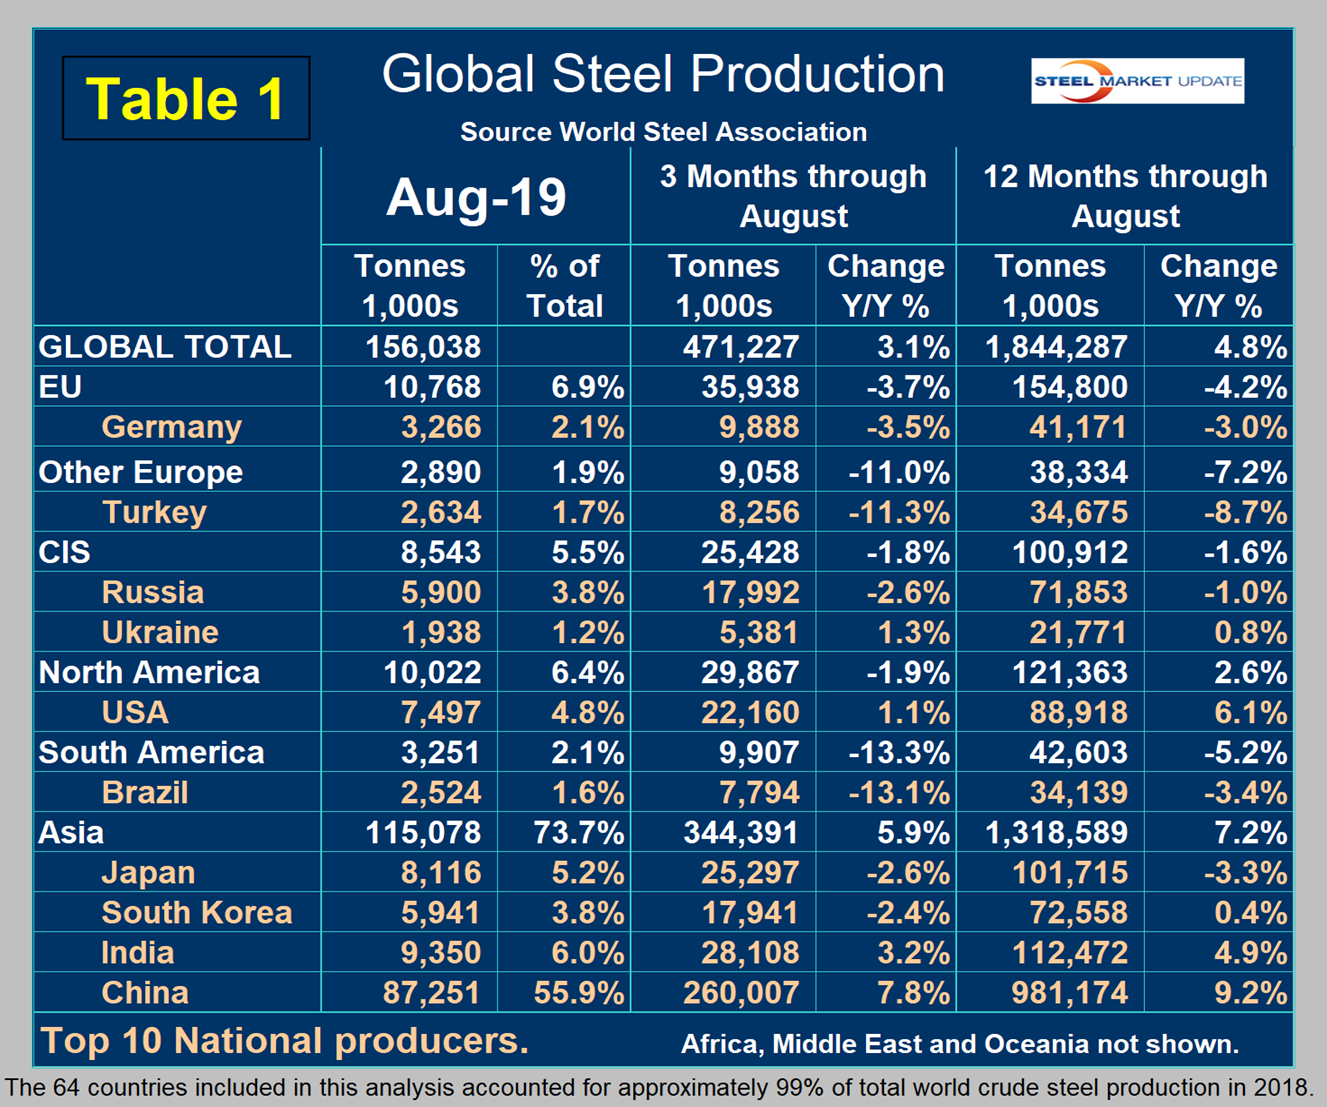
In the 12 months of 2018, 119.9 million metric tons were produced in North America of which 72.3 percent was produced in the U.S., 10.9 percent in Canada and 16.8 percent in Mexico. Based on the OECD data, U.S. capacity in 2018 was 112.6 million metric tons with a capacity utilization of 76.9 percent.
Figure 4 shows China’s production since 2005. As just stated, global steel production was up by 3.1 percent in three months through August year-over-year and China was up by 7.8 percent, both with negative momentum. The updated OECD data shows China’s capacity in 2018 to be 1,023,400,000 metric tons, and the WSA reported China’s production to be 924,752,000 metric tons, which yields a capacity utilization of 90.4 percent. This is much higher than we had previously thought. In the three months June through August, world steel production excluding China contracted by 2.1 percent.
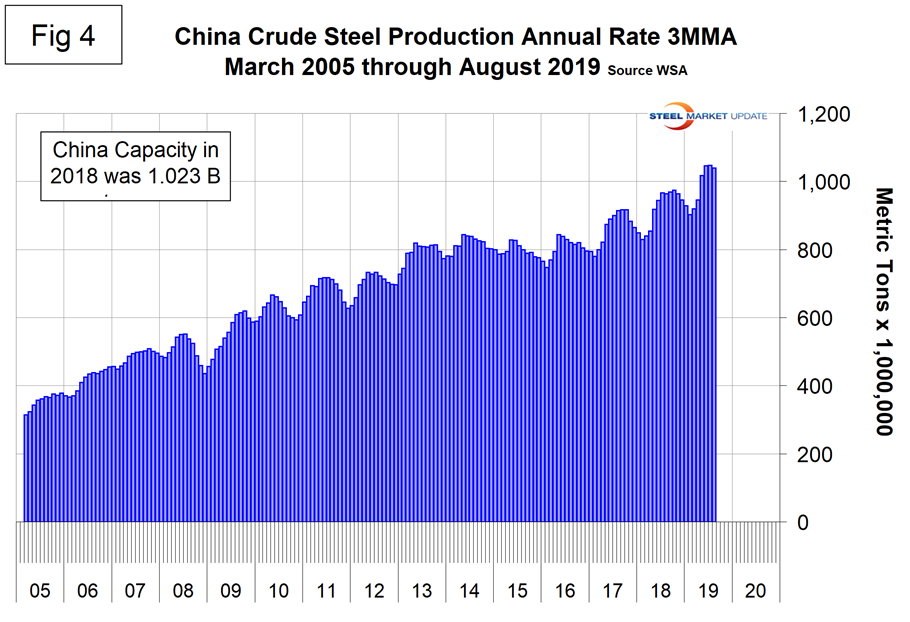
Figure 5 shows the growth of China’s steel production since January 2013 and Figure 6 shows the growth of global steel excluding China. China’s domination of the global steel market is increasing and in each month April through August for the first time had an annualized production rate of over one billion metric tons.
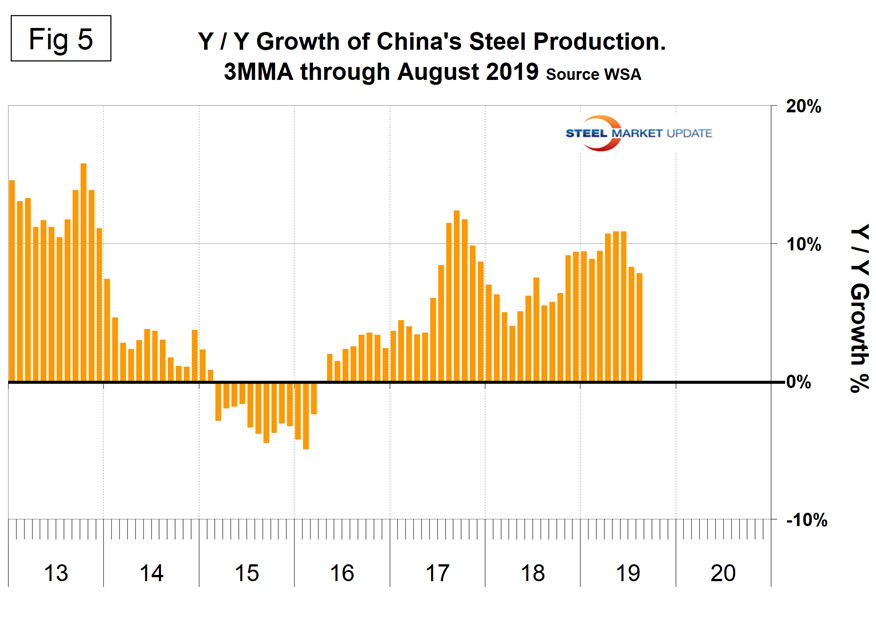
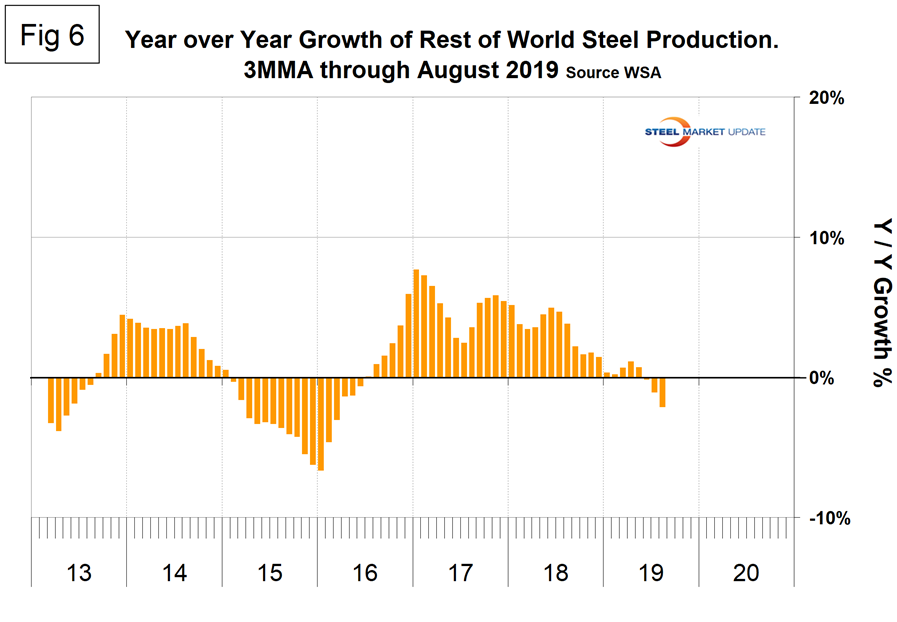
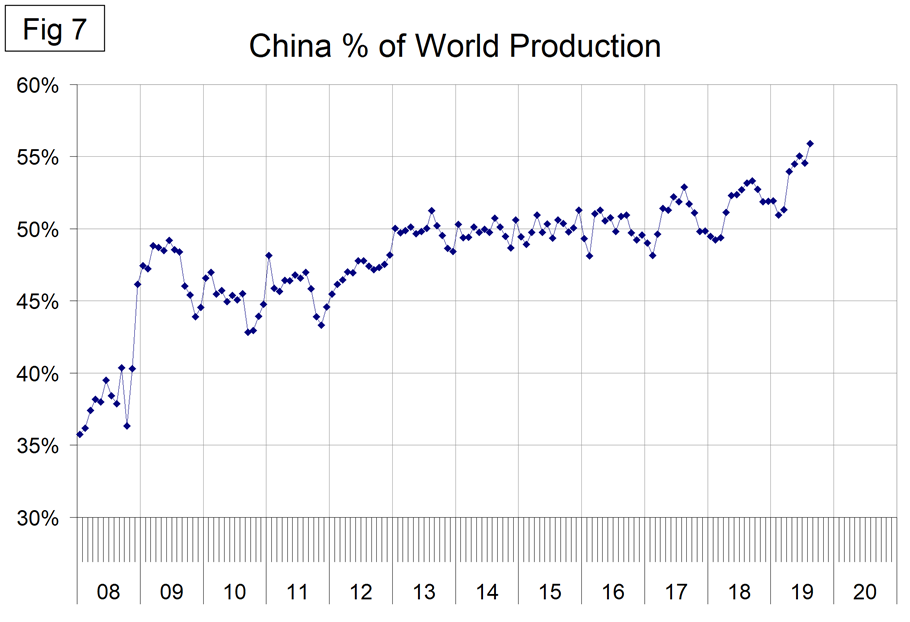
Figure 7 shows the growth of China’s share of global steel production, which in August was another all-time high of 55.9 percent.
The April 2019 WSA Short Range Outlook (SRO) for apparent steel consumption in 2018 and 2019 is shown by region in Figure 8. The WSA forecasts global steel demand will reach 1.735 billion metric tons in 2019, an increase of 1.3 percent over 2018. (Note the essence of this piece is crude steel production, therefore the numbers are greater than for steel consumption, which relates to rolled products.)
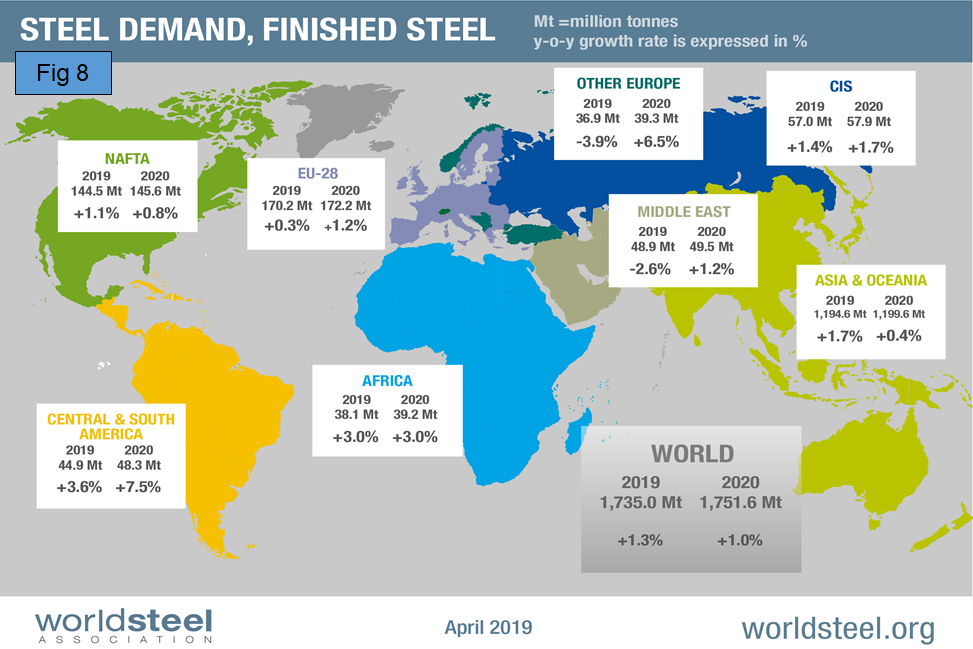
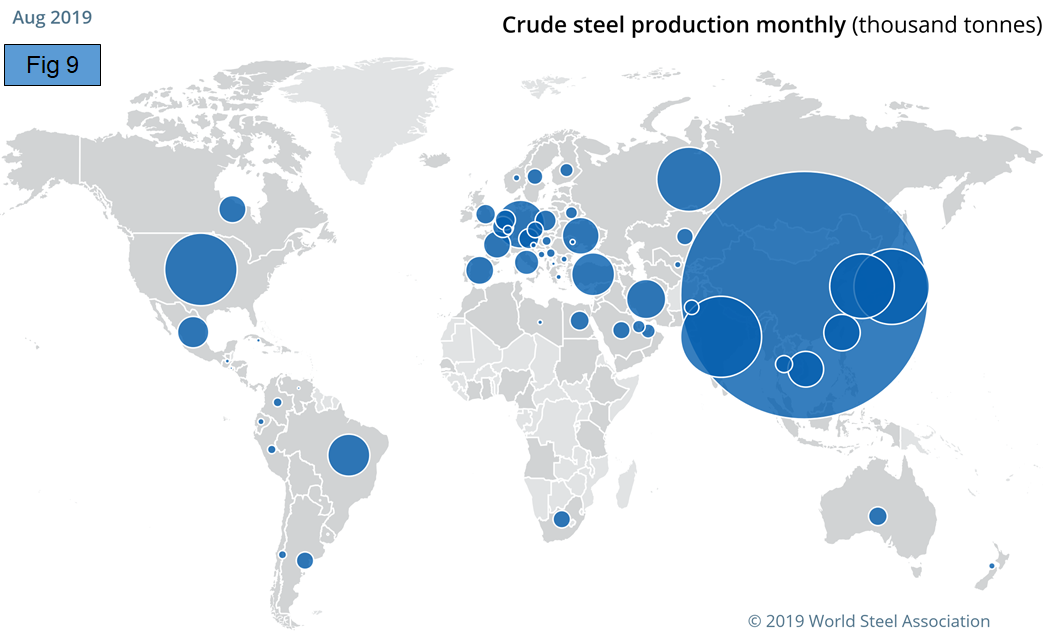
Figure 9 is a schematic from the WSA showing the relative production of the major steel producing nations in August.
SMU Comment: In October, the WSA will update its forecast of finished steel consumption in 2019 and 2020 and the IMF will update its Global Economic Outlook. Both these reports are likely to indicate a slowdown in which case global steel production will be negatively impacted in the coming months. In 2019, the U.S. growth pattern is slowing as the effect of fiscal stimulus declines. Construction and manufacturing growth is expected to moderate. Investment in oil and gas exploration is also expected to decelerate.
This analysis is based on data made public monthly by the World Steel Association. The WSA is one of the largest industry associations in the world. Members represent approximately 85 percent of the world’s steel production, including over 160 steel producers, national and regional steel industry associations and steel research institutes.
OECD Statement: The Secretariat of the OECD Steel Committee provides monitoring reports on crude steelmaking capacity developments on a regular basis, using a wide range of publicly available and commercial data sources. This paper presents an updated overview of regional capacity trends, including an assessment of gross capacity additions in the period until 2021, as well as information on cross-border capacity investments. The latest available data suggest that global steelmaking capacity (in nominal crude terms) declined marginally in 2018. While investment and closure data from the first half of 2018 had suggested the possibility of a slight increase in global steelmaking capacity for the year as a whole, incoming information on closures as well as recent reports indicating that some investment projects were postponed have led to a slight downward adjustment in the estimate for year 2018 global steelmaking capacity. However, many investment projects continue to take place around the world and others are in the planning stages. Should these projects be realized, global steelmaking capacity could increase by approximately 4-5 percent between 2019 and 2021 in the absence of closures, amounting to additional capacity ranging from 88 million to 110 million metric tons during this period. Asia is expected to experience a considerable increase in steelmaking capacity over the next few years, while many capacity additions are also planned in the Middle East region. The information on announced investment projects also suggests that steelmaking capacity in the other regions could also increase somewhat in the coming years.


