

Market Data
October 23, 2019
SMU Energy Analysis: Saudi Attack Has Little Impact on Oil Price
Written by Peter Wright
Crude oil prices have returned to the levels prior to the attack on the Saudi Aramco Abqaiq crude oil processing facility on Sept. 14.
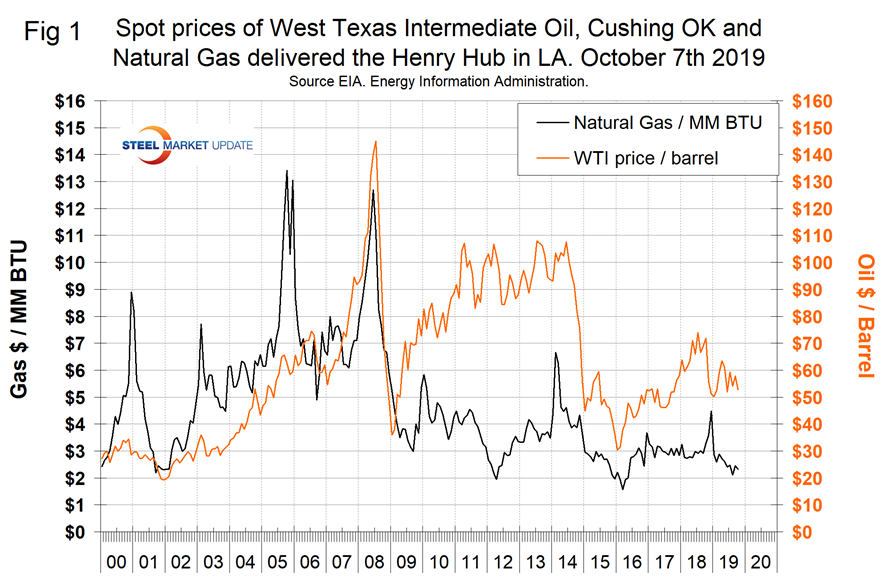
The spot price of West Texas Intermediate (WTI) FOB Cushing, Okla., exceeded $60 per barrel for one day on Sept. 16 when it reached $63.10 before falling back to $52.76 on Oct. 7. That was the extent of the reaction to the attack on the Saudi oil fields. On Oct. 7, Brent was priced at $59.46 per barrel. The total number of operating rigs exploring for oil has declined by 227, or 17.5 percent, since the end of last year.
![]()
The prices of oil and natural gas drive the consumption of energy-related steel products including oil country tubular goods, pipe fittings and well head equipment, among others. Welded tubular goods (not including OCTG) consumed about 5.5 million tons of hot rolled sheet in 2018.
Figure 1 shows historical oil and gas prices on an early month basis from January 2000 through Oct. 7. 2019. Our price and inventory data come from the Energy Information Administration (EIA). On Oct. 4, natural gas at the Henry Hub in Oklahoma was priced at $2.33 per MMBtu (million British Thermal Units), down 13 cents on the month. Natural gas is priced to continue making inroads against coal as an electric power generator. The attack on Saudi Aramco’s Abqaiq crude oil processing facility on Sept. 14 initially disrupted about 5 percent of global liquid fuels supply and caused a significant increase in crude oil prices on the first trading day following the disruption. The company has restored most operational capacity at the facility, however, and has met customer demand by selling oil from inventories and reducing domestic refinery intake. By early October, crude oil prices had declined to pre-attack levels. The long-term effects from the disruption remain highly uncertain. The attack revealed vulnerabilities to a significant amount of crude oil production in a country that holds most of the spare production capacity within the Organization of the Petroleum Exporting Countries (OPEC). At the same time, the market appears to have adapted fairly smoothly to the disruption and oil companies will likely enhance security in the future.
The EIA short-term energy forecast of Oct. 8 stated that Brent spot prices will average $59/b in the fourth quarter of 2019 and then fall to $57/b by the second quarter of 2020, which is $5/b lower than forecast in the September STEO. Despite the recent increase in supply disruptions, EIA expects downward oil price pressure to emerge in the coming months as global oil inventories rise during the first half of 2020. EIA forecasts balances to tighten later in 2020 and expects Brent prices to rise to an average of $62/b in the second half of next year. The resulting forecast average price in 2020 is $60/b, $2/b lower than forecast in the September STEO. EIA’s October forecast recognizes a higher level of oil supply disruption risk than previously assumed, more-than-offset by increasing uncertainty about economic and oil demand growth in the coming quarters, resulting in a lowered oil price forecast.
On Oct. 4, the EIA reported that U.S. commercial crude oil inventories (excluding those in the Strategic Petroleum Reserve) increased for four consecutive weeks, but are down by 12.3 percent since the recent peak on June 7. Year over year, inventories have fallen for 28 straight weeks. Figure 2 shows the inventory level, including the strategic petroleum reserve and the year-over-year change.
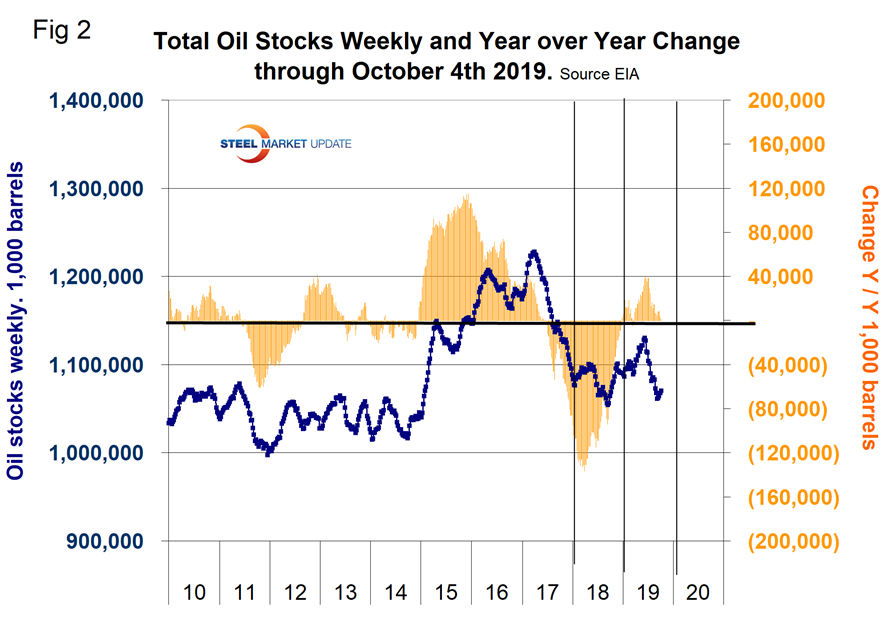
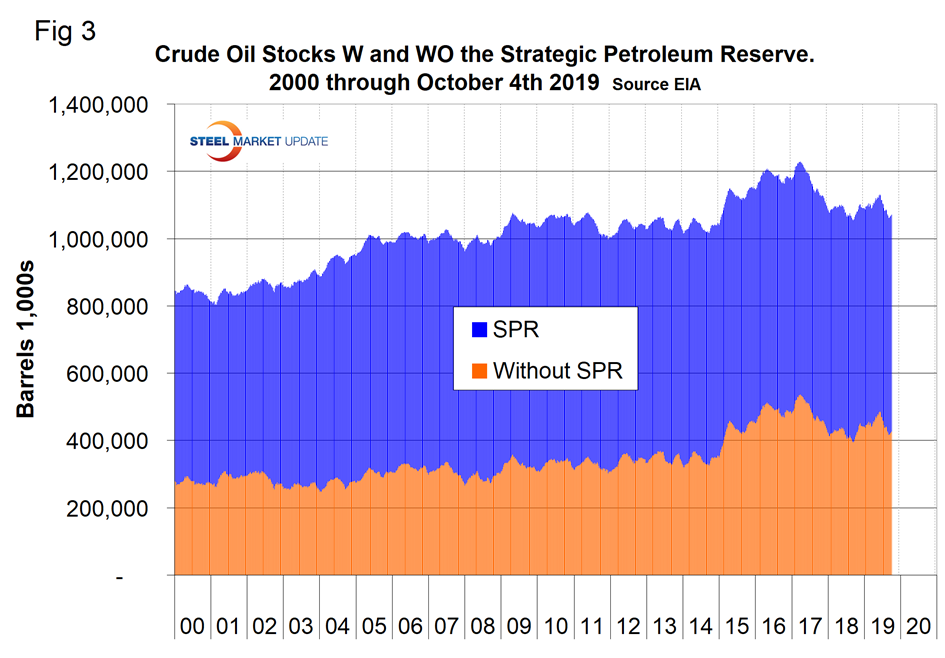
Figure 3 breaks total crude inventory into the working portion and the strategic petroleum reserve.
The total number of operating rigs in the U.S. on Oct. 11 was 856, down by 227 since the last week of 2018. Oil rigs were down by 173 and gas by 55. Figure 4 shows the total number of operating rigs in the U.S. and the weekly change.
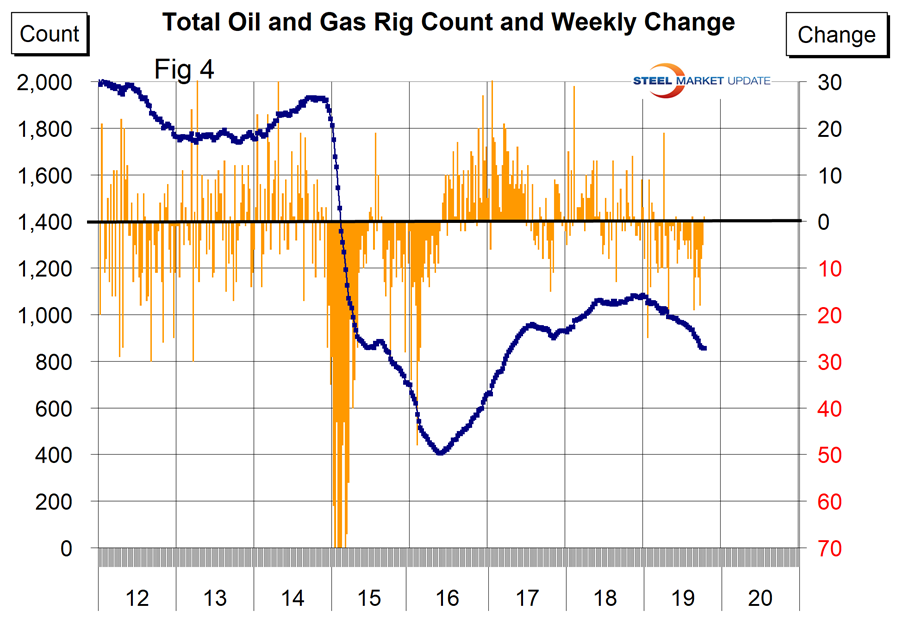
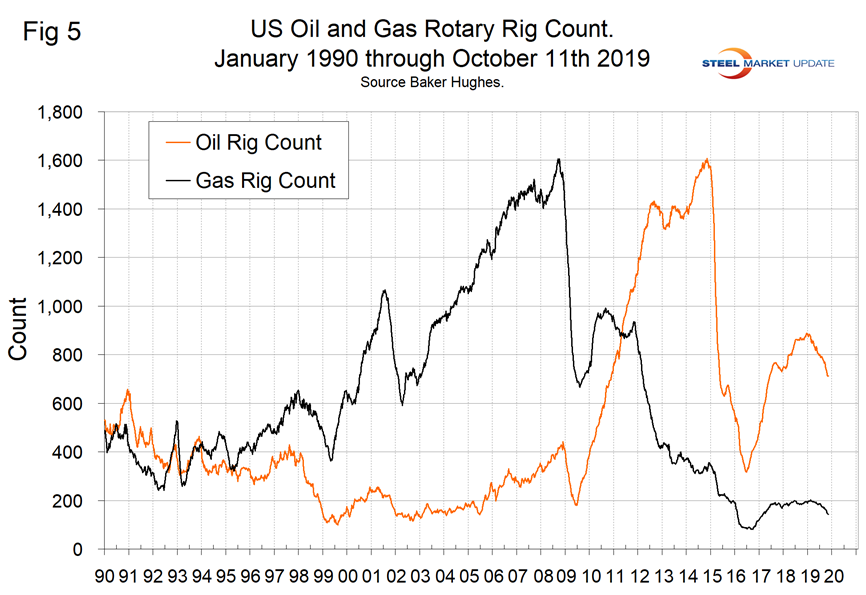
The oil rig count had a low point of 316 on June 27, 2016, and stood at 712 on Oct. 11, 2019.
The U.S. gas rig count rose from its low point of 81 on Aug. 5, 2016, to 202 on Jan. 11, 2019 before falling back to 143 on Oct. 11, 2019. The year-over-year growth rate of total U.S. operating rigs was negative 19.5 percent in the latest data with oil down by 18.1 percent and gas down by 25.9 percent. Figure 5 shows the Baker Hughes U.S. Rotary Rig Counts for oil and gas equipment in the U.S. (explanation below).
On a regional basis in the U.S., the big three states for operating rigs are Texas, Oklahoma and North Dakota. Figure 6 shows the land rig count in those states since 2000.
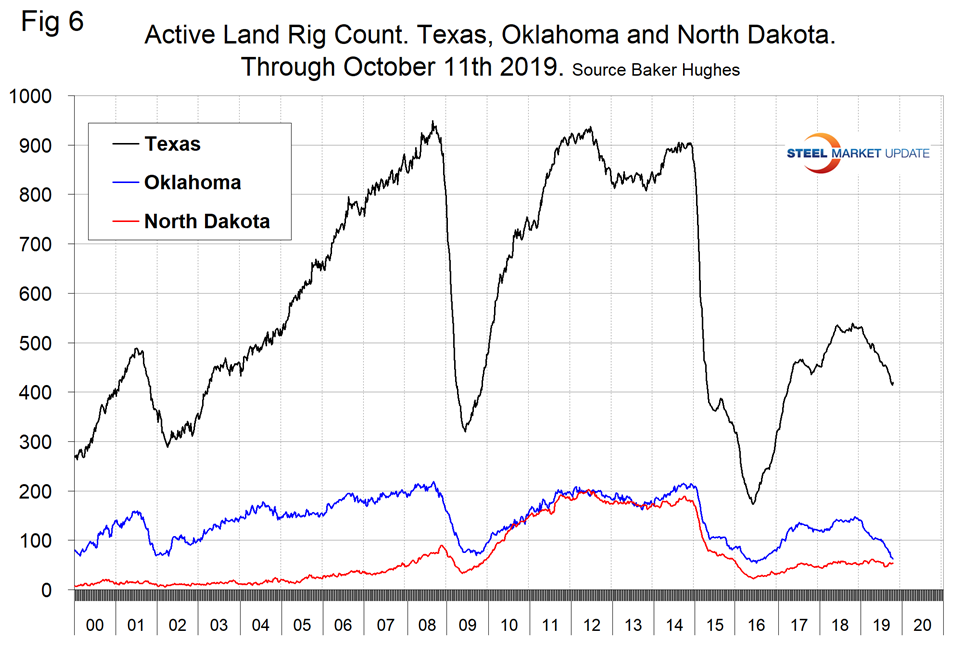
Figure 7 illustrates the monthly U.S. oilfield production of crude from January 1970 through July 2019 (latest data available) in thousands of barrels per month. The historical high was October 1970 at 310.4 million barrels. Production steadily declined to half that level in the late 2000s before the fracking revolution. December 2017 broke the record that had stood for 47 years with 311.2 million barrels produced. May 2019 set another record of 375.4 million barrels before falling back to 366 million in July.
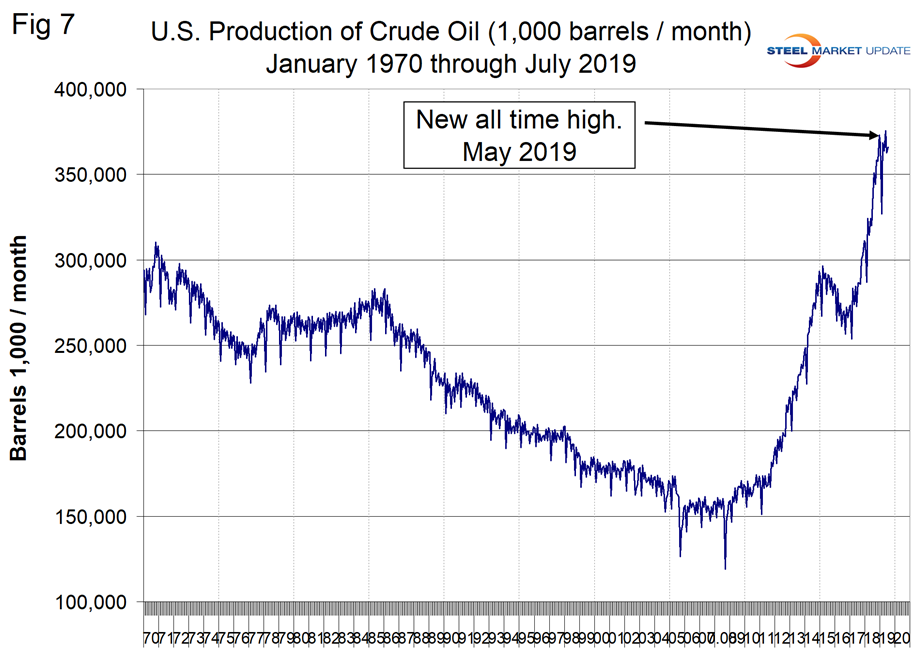
EIA reported that U.S. crude oil production averaged 11.8 million b/d in July, down 0.3 million b/d from June. Declining production was a result of Hurricane Barry, which disrupted crude oil production in the Gulf of Mexico. U.S. crude oil production remained relatively flat during the first seven months of 2019 because of disruptions to Gulf of Mexico platforms and slowing growth in tight oil production. The slowing rate of growth in tight oil production reflects relatively flat crude oil price levels and slowing growth in well-level productivity in the lower 48 states. However, EIA expects growth to pick up in the fourth quarter as production returns in the Gulf of Mexico and pipelines in the Permian Basin come online to link production areas in West Texas and New Mexico to refining and export centers on the Gulf Coast. However, EIA forecasts growth to level off in 2020 because of falling crude oil prices in the first half of the year and continuing declines in well-level productivity. EIA forecasts U.S. crude oil production will average 12.3 million b/d in 2019, up 1.3 million from the 2018 level, and will rise by 0.9 million b/d in 2020 to an annual average of 13.2 million b/d
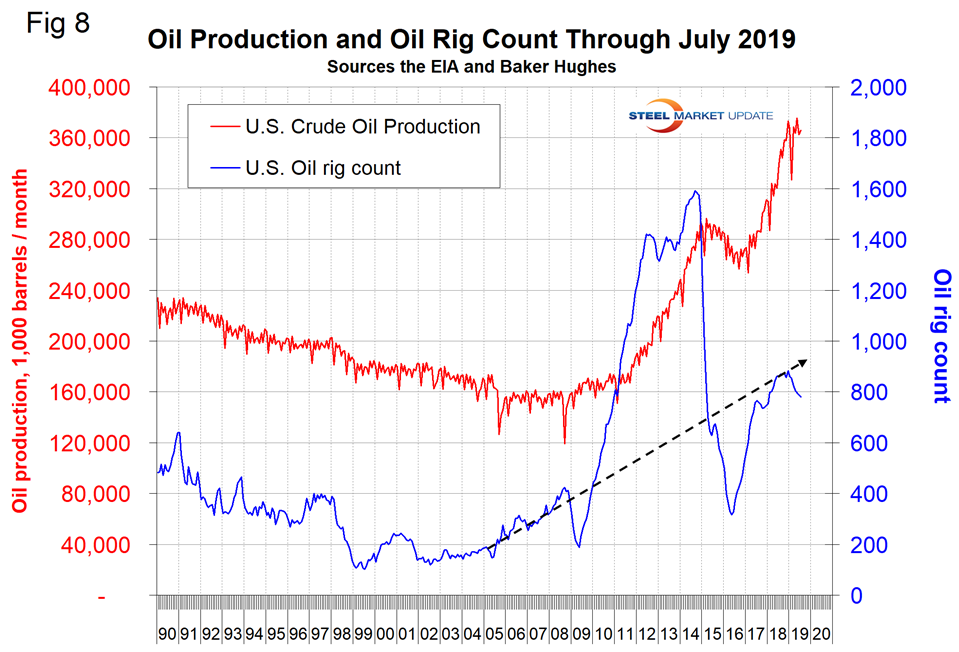
Figure 8 compares oil production and the oil rig count and shows how the increase in exploratory wells drove production from 2009 through late 2014 when the oil price collapsed.
Baker Hughes Rotary Rig Count: This is a weekly census of the number of drilling rigs actively exploring for or developing oil or natural gas in the United States. Rigs are considered active from the time they break ground until the time they reach their target depth and may be establishing a new well or sidetracking an existing one. The Baker Hughes Rotary Rig count includes only those rigs that are significant consumers of oilfield services and supplies.


