Analysis

October 24, 2019
North American Automotive Production Slows Down
Written by Peter Wright
Total North American light vehicle assemblies were down by 3.0 percent year over year in three months through August.
This report is based on data from LMC Automotive for automotive assemblies in the U.S., Canada and Mexico. The breakdown of assemblies is “Personal” (cars for personal use) and “Commercial” (light vehicles less than 6.0 tonnes gross vehicle weight rating (GVW). Heavy trucks and buses are not included. In this report we will briefly describe light vehicle sales in the U.S. before reporting in detail on assemblies in the three regions of North America.
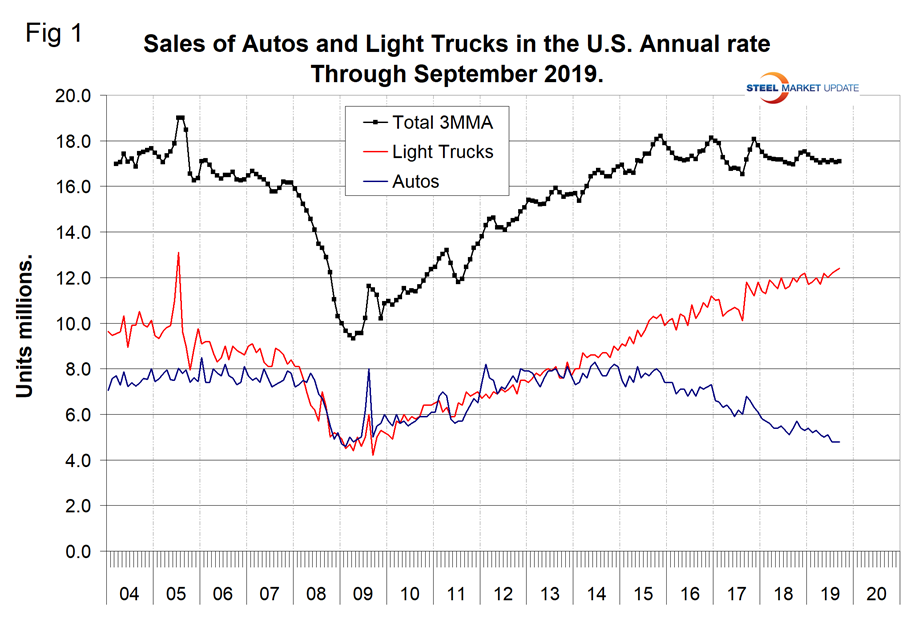
U.S. Vehicle Sales: Economy.com summarized August’s vehicle sales as follows: “U.S. unit vehicle sales increased in September to 17.2 million annualized units. Light truck and SUV sales increased 0.6 percent to 12.4 million annualized units. Car sales rebounded slightly to 4.8 million annualized units. Vehicle sales were above the average of 17 million annualized units over the first eight months of 2019. Nevertheless, sales for September came in 0.6 percent below 2018 numbers. The soft landing for the new-vehicle market continued as crosswinds from the slowing U.S. economy were rebuffed by strong consumer sentiment. Still, 2019 is shaping up to be the slowest year for new-vehicle sales since 2014.”
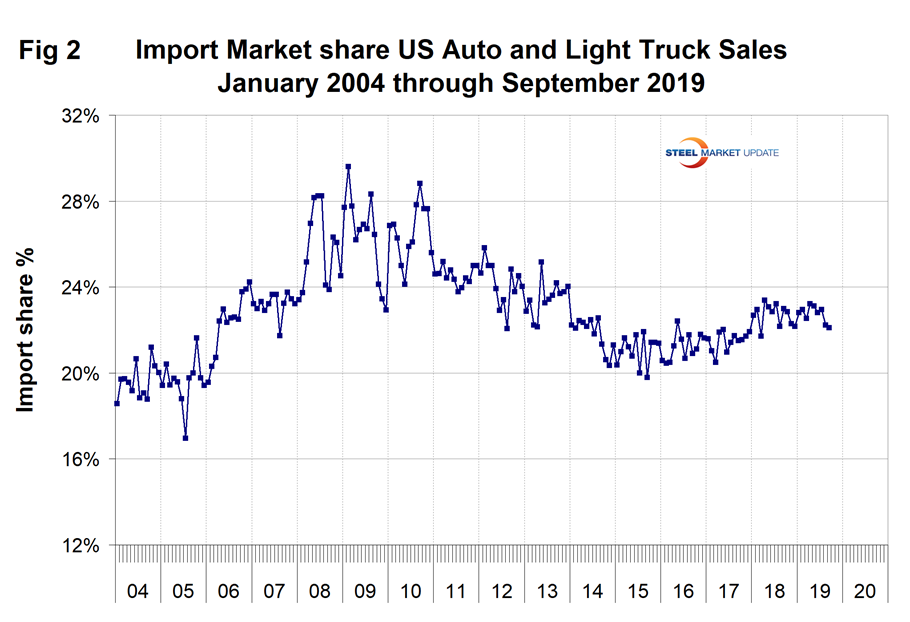
Figure 1 shows auto and light truck sales since January 2004. In September, total sales were up by 0.8 percent on a three-month moving average (3MMA) basis year over year. Light trucks that include pickups, SUVs and crossovers have been surging at the expense of cars for four years. In September, the mix was 72.1 percent light trucks and 27.9 percent autos. May was the first month ever for light trucks to exceed a 70 percent share and that share has increased every month since. In 2019, import market share had a high of 23.2 percent in April, declining to 22.1 percent in September as shown in Figure 2.
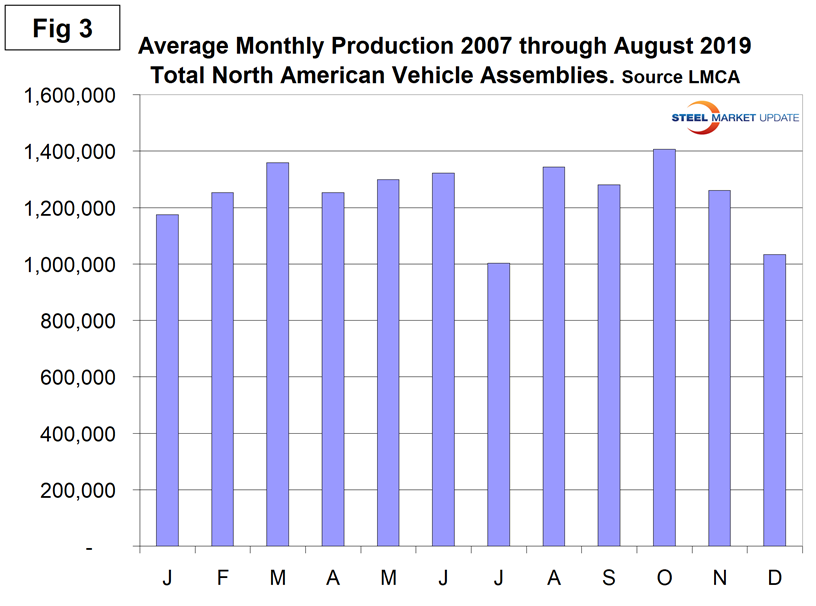
North American Assemblies: The United Auto Workers and General Motors reportedly reached a tentative four-year labor agreement on Tuesday, but it remains unclear how quickly operations will resume. The strike began on Sept. 16. This assembly update deals with data through August, and so is unaffected by the strike. Total light vehicle (LV) production in North America in August was at an annual rate of 16.3 million units, up from 14.4 million in July, which was depressed by the annual retooling and maintenance shutdowns. On average since 2007, August’s production has been up by 34 percent from July. This year production was up by 12.9 percent, but this was a correction for July that was down by less than normal. Figure 3 illustrates the seasonality of production on average since January 2007. On a rolling 12-months basis, total North American assemblies were down by 3.0 percent year over year through August. Note that production numbers are not seasonally adjusted; the sales data reported above are seasonally adjusted.
There has been a gradual slowdown in production since August 2017, which has now almost stabilized as indicated by the brown bars in Figure 4.
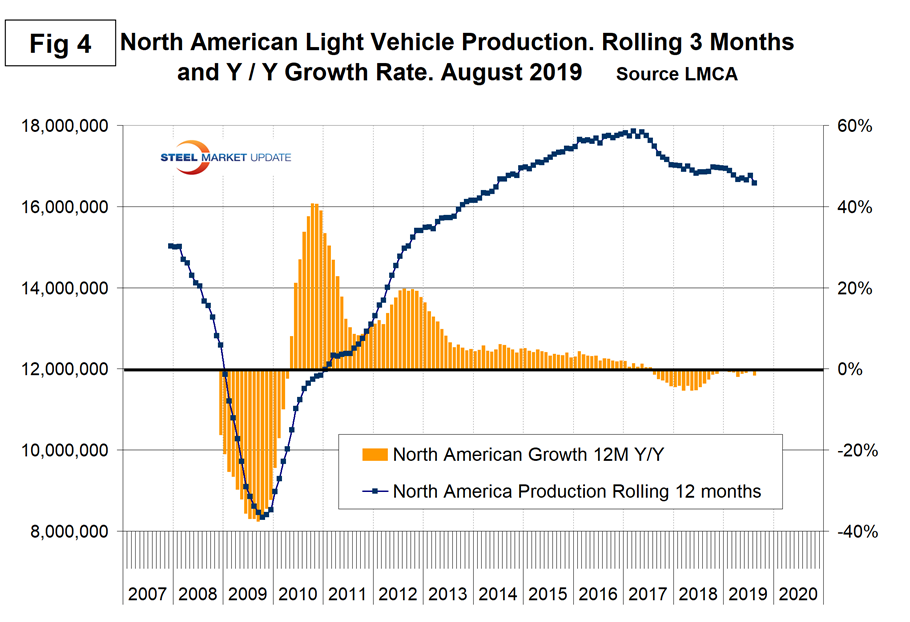
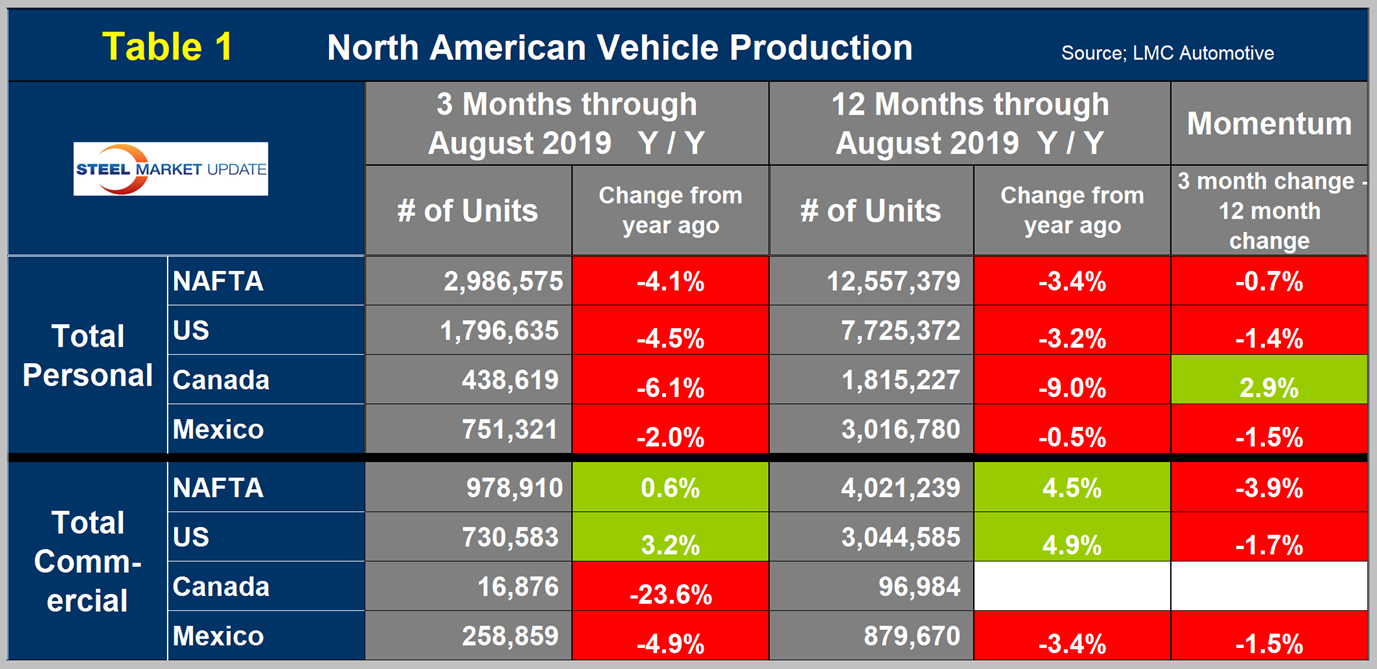
Table 1 is a short-term snapshot of assembly by nation and vehicle type. It breaks down total North American personal and commercial vehicle production into the U.S, Canada and Mexico components and the three- and 12-month growth rate for each. At the far right it shows the momentum for the total and for each of the three nations. Assemblies of personal vehicles in all three nations were down on both a three-month and 12-month basis through August year over year. For commercial vehicles, North America as a whole had increased production driven by the U.S. as both Canada and Mexico saw declining volume. Note, there are blank cells for Canadian commercial production; see explanation below.
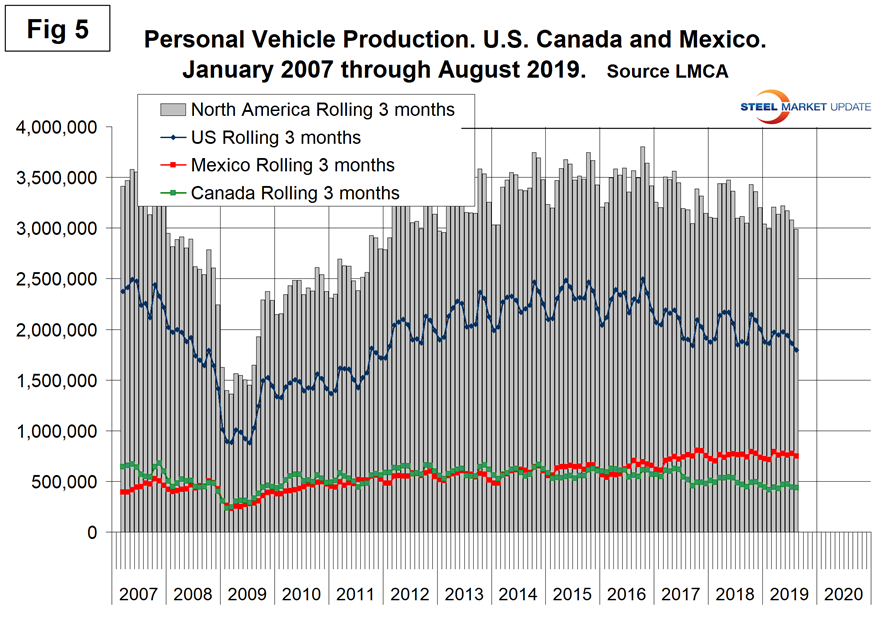
The longer term picture is shown in the following charts by vehicle type and nation. Figure 5 shows the total personal vehicle production for North America and the total for each nation.
Figures 6, 7 and 8 show the production of personal vehicles by nation and the year-over-year growth rate for each. Figure 9 shows the production share for each nation. Production in the U.S. and Canada has declined since 2015 as Mexico has increased. The Mexican share rose from 17.2 percent in late 2014 to 25.2 percent in August 2019.
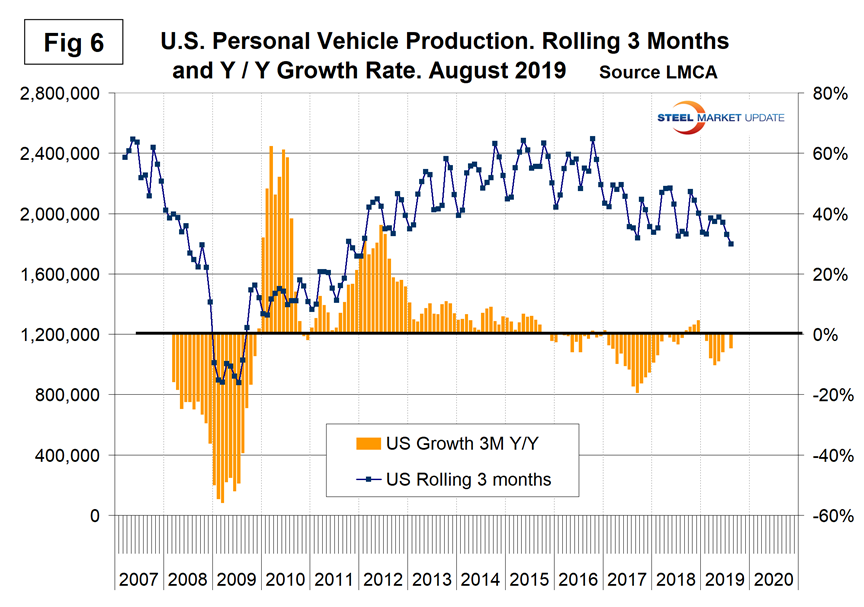
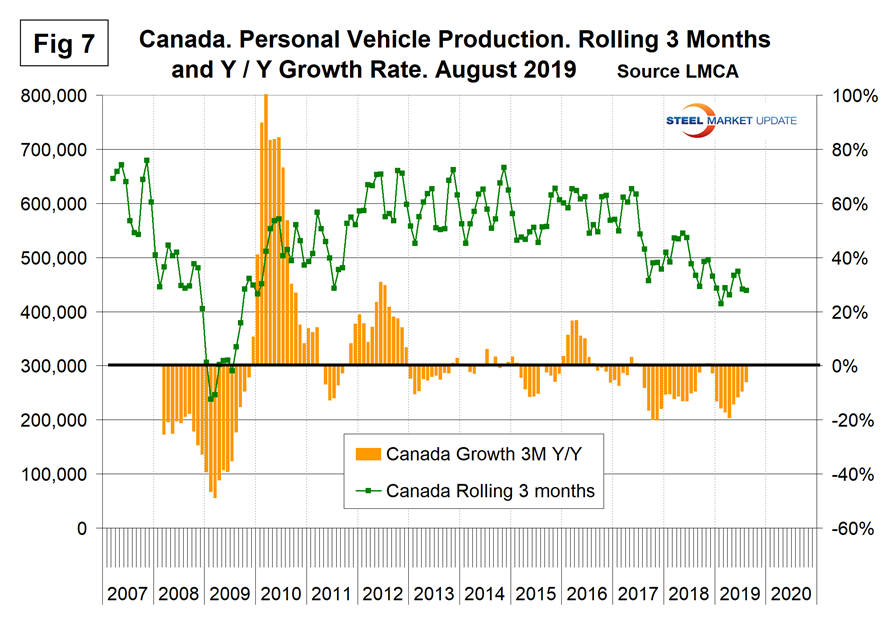
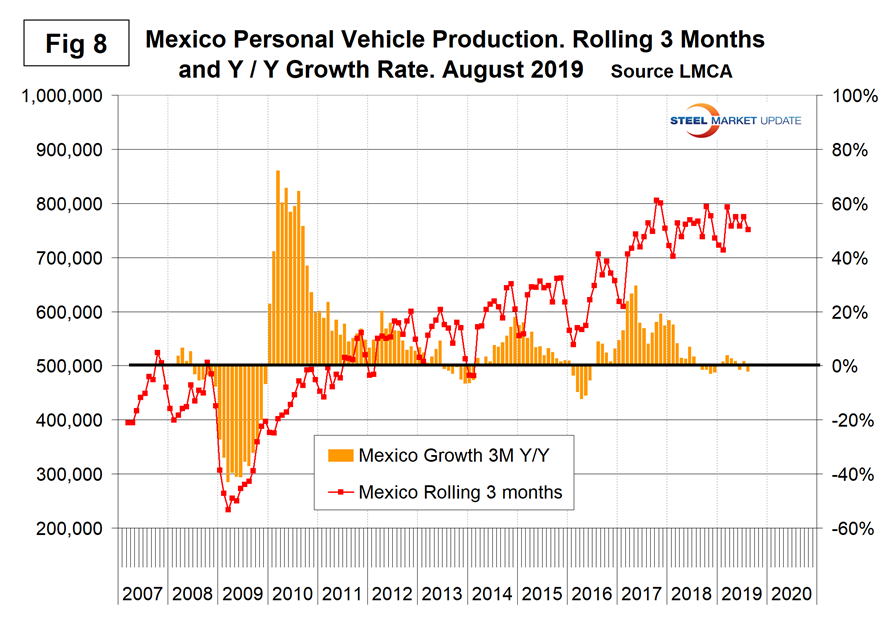
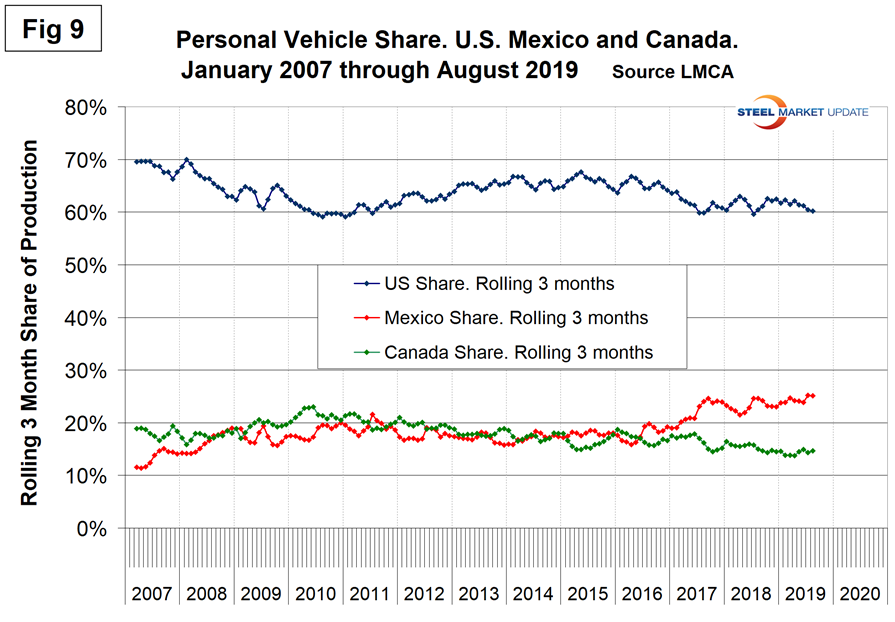
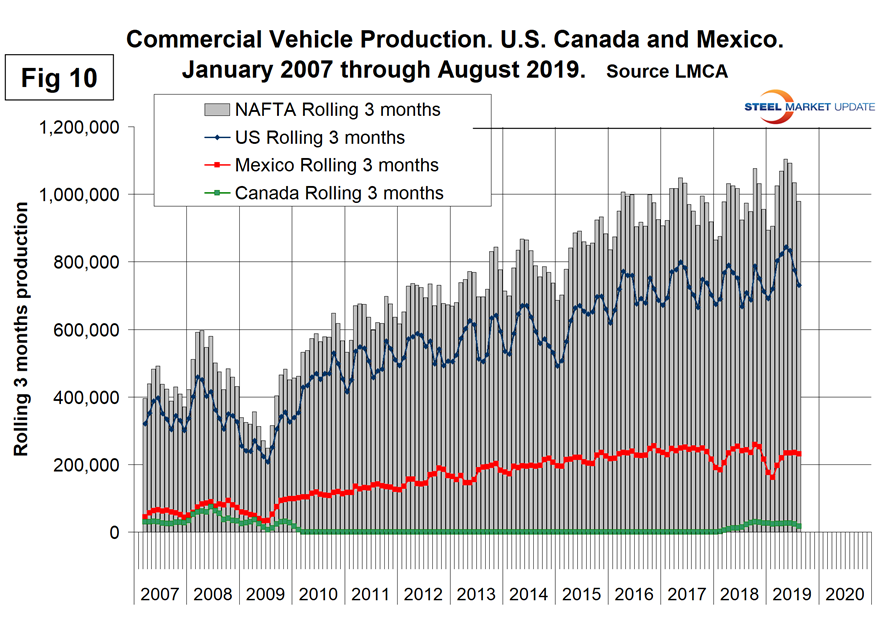
Figure 10 shows the total commercial vehicle production for North America and the total for each nation. The U.S. has held its ground much better in commercial vehicles than in the personal segment.
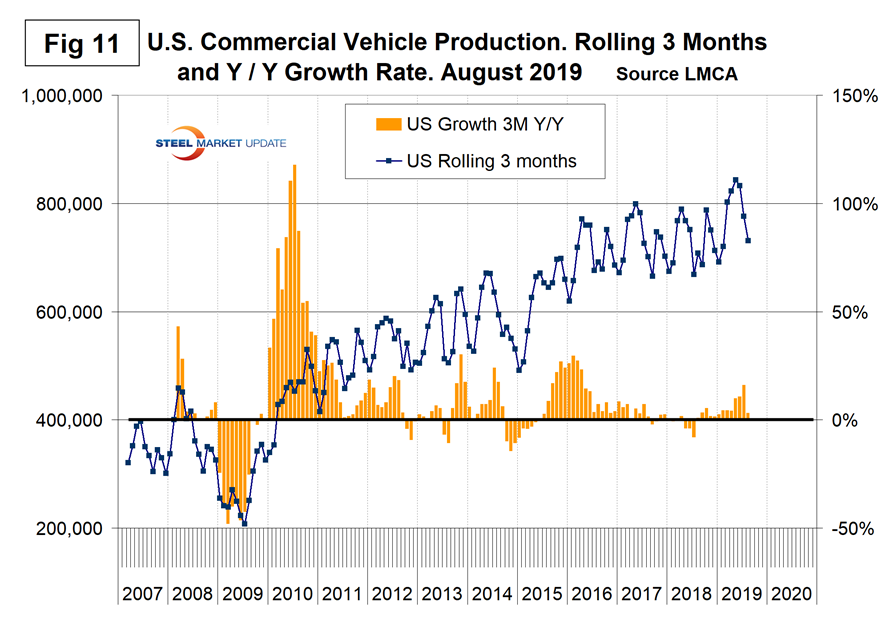
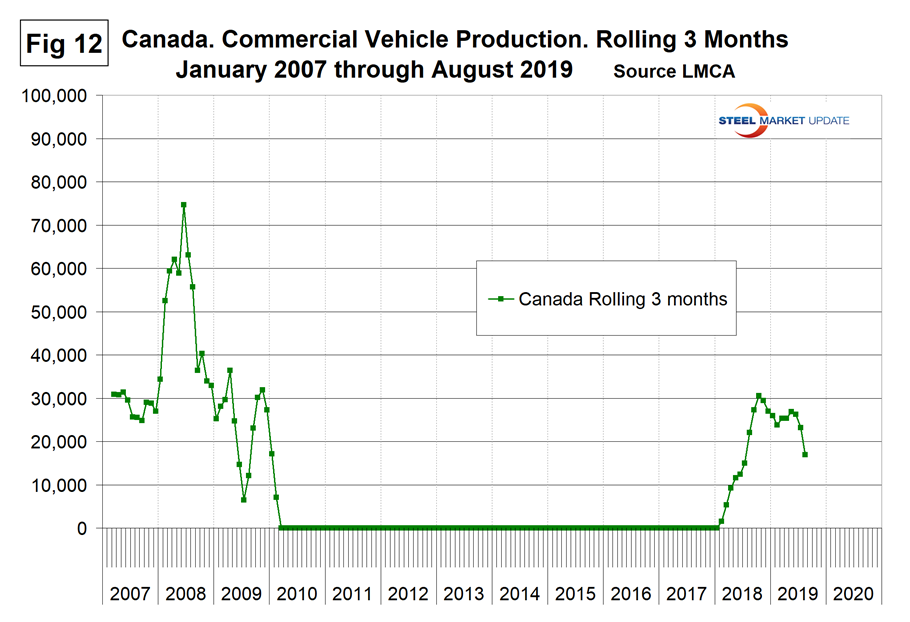
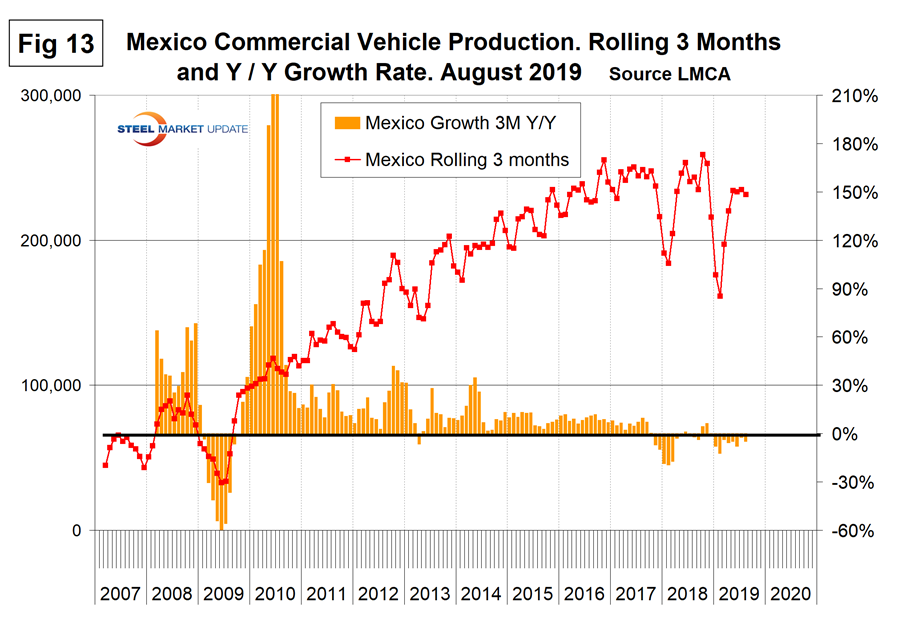
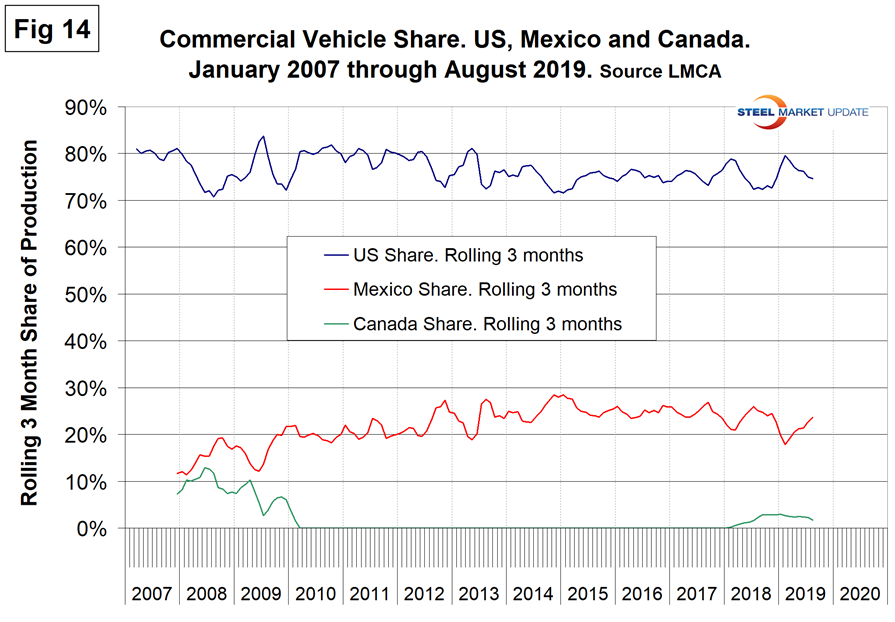
Figures 11, 12 and 13 show the production of commercial vehicles by nation and the year-over-year growth rate for each, while Figure 14 shows the production share for each nation. Commercial vehicle production in Canada was zero from January 2010 through January 2018. The only Canadian plant making commercial vehicles in the past couple of decades was in Oshawa. At the end of 2009, they shifted their production from Silverados to build the Chevy Camaro. That changed again in February 2018 when the Oshawa plant shifted away from the Equinox (personal vehicle) and again began to produce the Silverado and Sierra (both commercial vehicles). GM has declared its intention to permanently close the Oshawa plant.
Both the U.S. and Mexico have achieved strong growth in commercial vehicle assemblies since the recession and their production shares have been stable and almost a mirror image of each other in the short term. Mexico currently exports about 80 percent of its light vehicle production with the U.S and Canada as the highest volume destinations.
SMU Comment: North America experienced the normal July slowdown in vehicle assemblies. Mexico has been taking share of personal vehicle production but not of commercial vehicles. It remains to be seen whether the renegotiated North American trade agreement will result in a move in production share to the U.S.