

Market Data

October 31, 2019
Global Steel Production Contracts Everywhere But China
Written by Peter Wright
China’s steel production continues to grow as the rest of the world contracts.
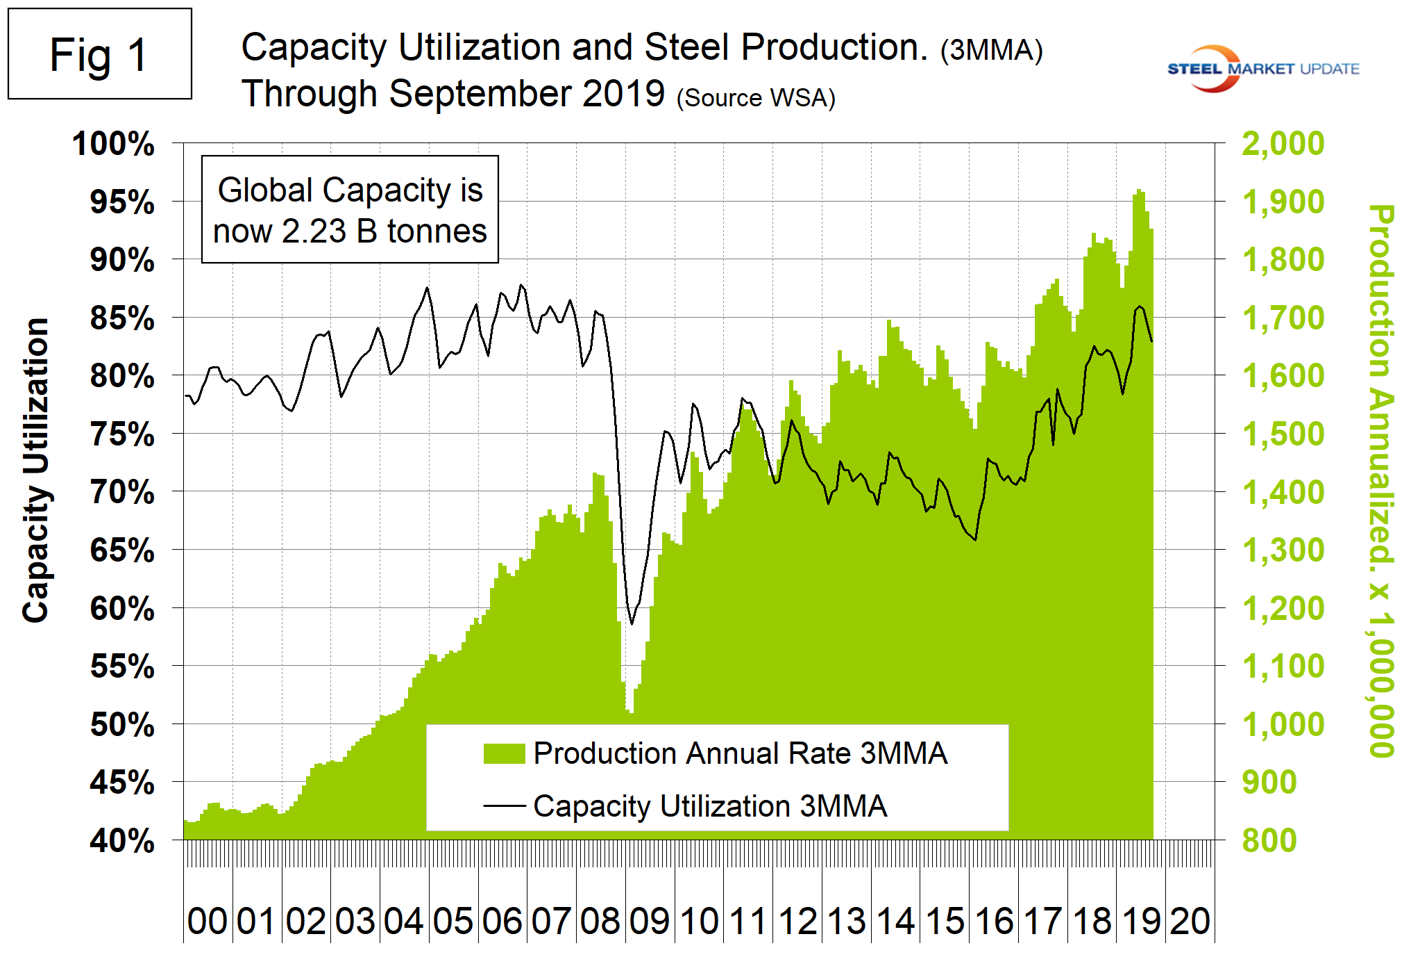
Figure 1 shows annualized monthly global steel production on a three-month moving average (3MMA) basis and capacity utilization since January 2000. The OECD has taken over responsibility for tracking global steel capacity. Their data shows that global capacity declined each year 2016 through 2018. Capacity in 2018 was 2.234 billion metric tons, down from 2.322 billion tons in 2015. Based on OECD data, capacity utilization in September on a 3MMA basis was 82.9 percent, down from 86.0 percent in June. On a tons-per-day basis, production in September was 5.032 million metric tons, down from June’s all-time high of 5.276 million metric tons.
On average, global production on a tons per day basis peaked in the early summer in the years 2010 through 2016, but in 2017 and 2018 the second half downtrend was delayed until the fourth quarter. Figure 2 shows the average tons per day of production for each month since 2011. On average, September increased 2.34 percent from August. This year September increased by 0.83 percent.
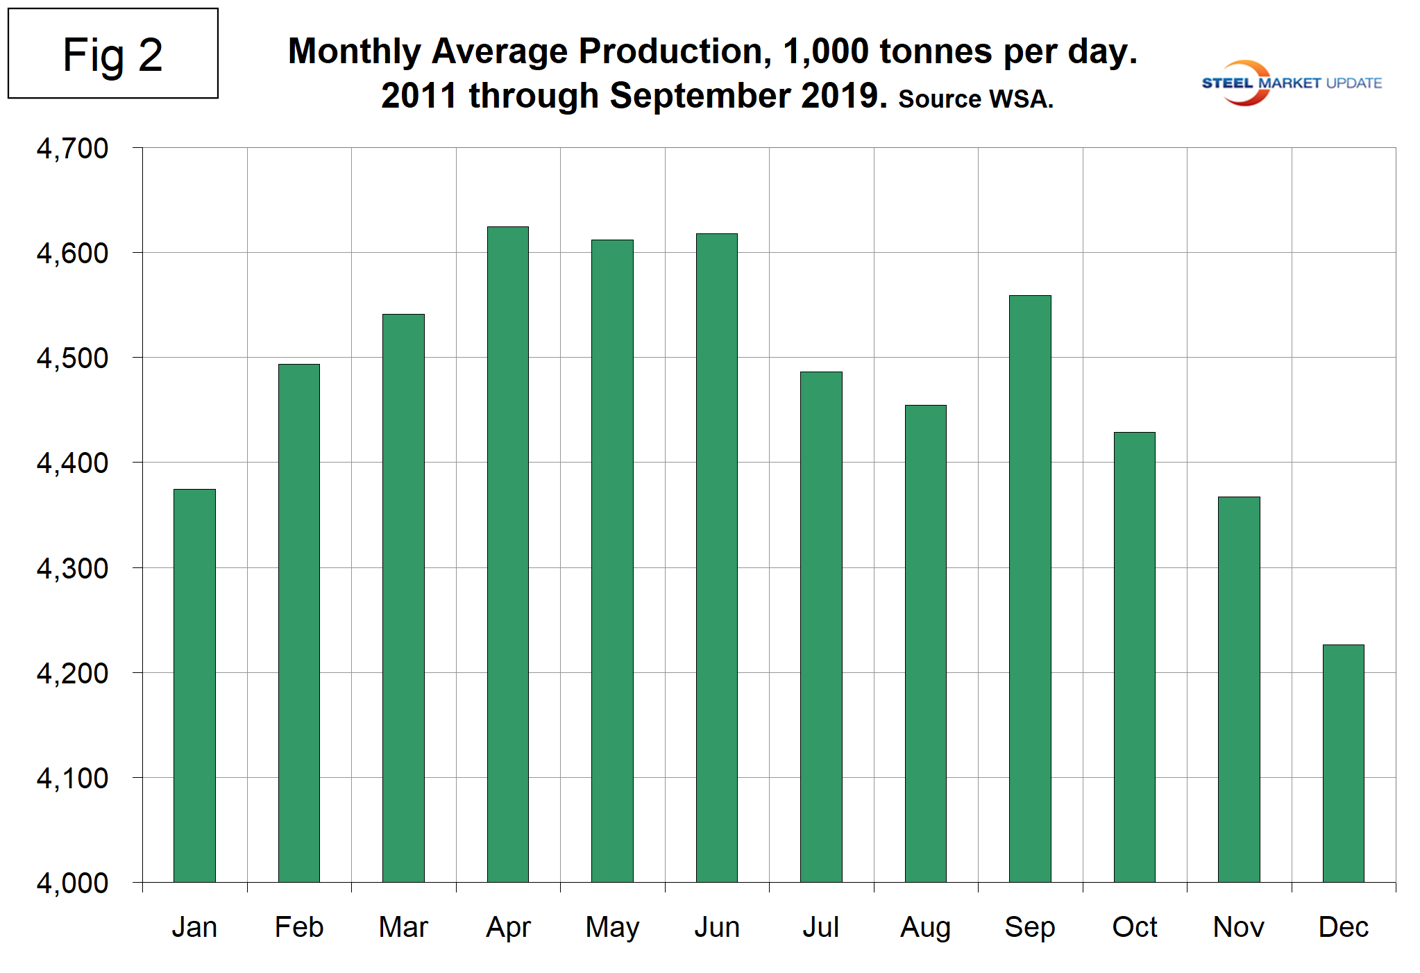
Figure 3 shows the year-over-year growth rate of global production since January 2005. Growth in three months through September was 1.3 percent, down from 5.9 percent in April and May. All of this growth occurred in China. In the rest of the world, growth of steel production was negative 3.3 percent in three months through September.
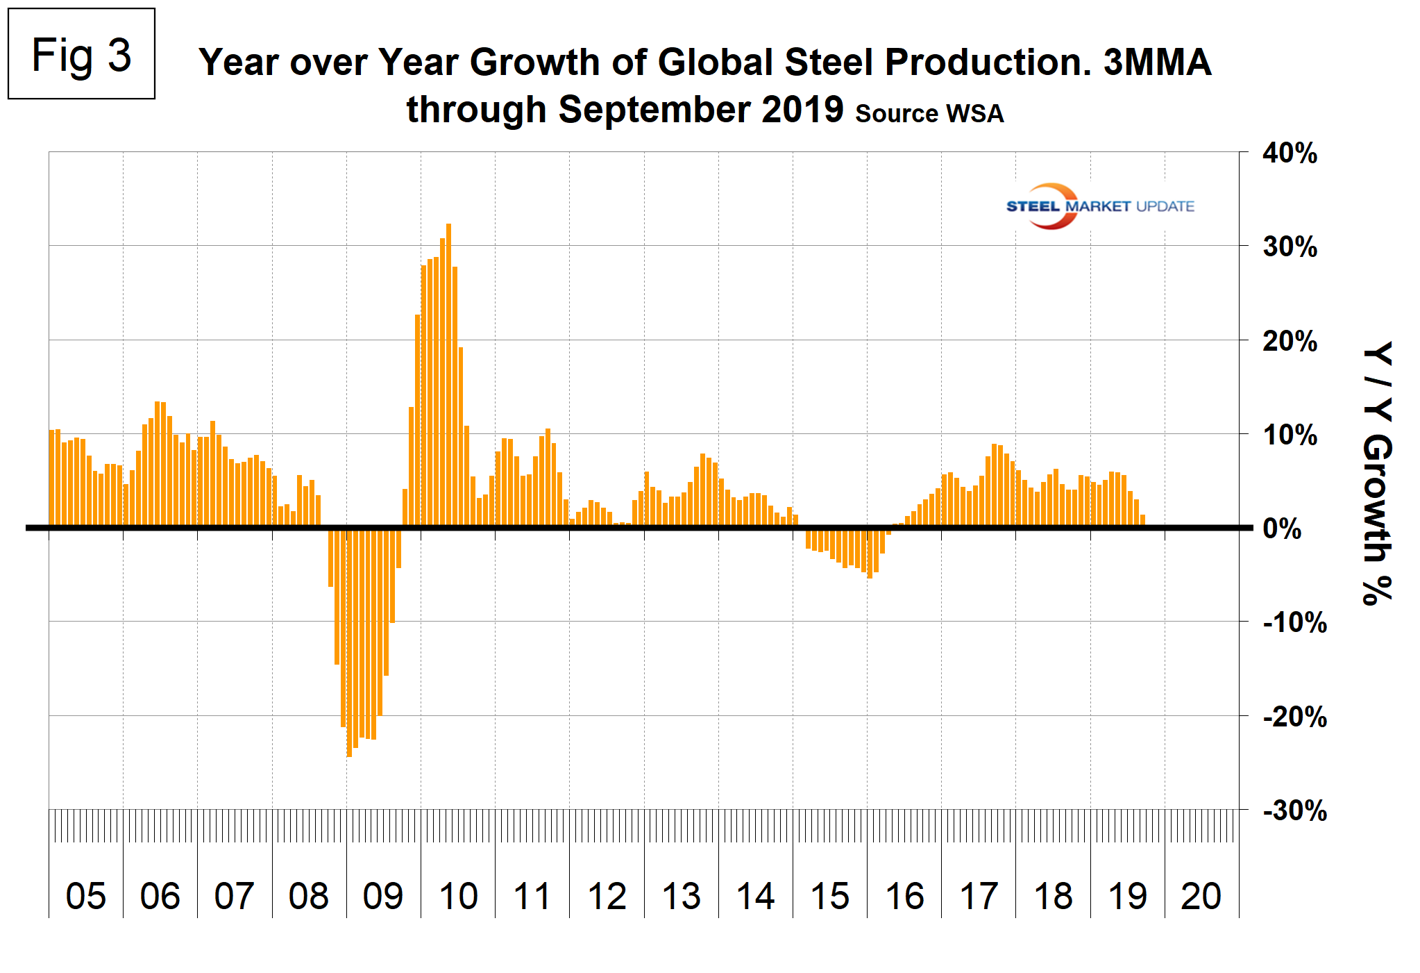
Table 1 shows global production broken down into regions, the production of the top 10 nations in the single month of September, and their share of the global total. It also shows the latest three months and 12 months of production through September with year-over-year growth rates for each period. Regions are shown in white font and individual nations in beige. The world overall had positive growth of 1.3 percent in three months and 4.3 percent in 12 months through September. When the three-month growth rate is lower than the 12-month growth rate, as it was each month in July through September, we interpret this to be a sign of negative momentum. On the same basis in September, China grew by 5.5 percent and 7.7 percent, therefore also had negative momentum. All regions including Asia had negative growth in three months through September year-over-year. Table 1 shows that North America was down by 3.6 percent in three months. Within North America, production was down by 1.0 percent in the U.S. down by 8.3 percent in Canada and down by 11.5 percent in Mexico. (Canada and Mexico are not shown in Table 1.)
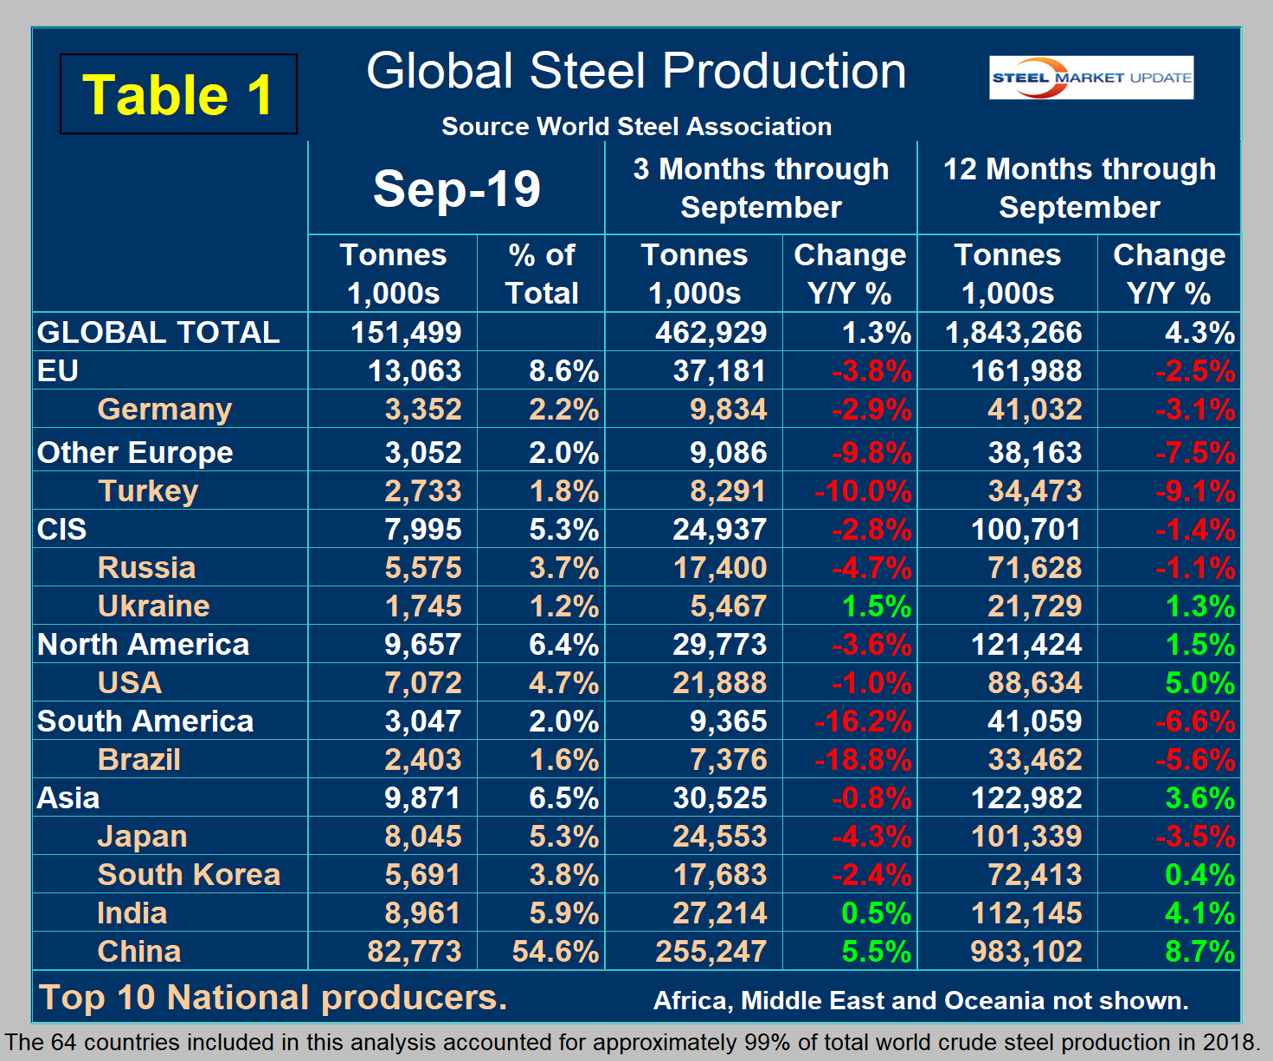
In the 12 months of 2018, 119.9 million metric tons were produced in North America of which 72.3 percent was produced in the U.S., 10.9 percent in Canada and 16.8 percent in Mexico. Based on the OECD data, U.S. capacity in 2018 was 112.6 million metric tons with a capacity utilization of 76.9 percent.
Figure 4 shows China’s production since 2005. As just stated, global steel production was up by 1.3 percent in three months through September year-over-year and China was up by 5.5 percent, both with negative momentum. The updated OECD data shows China’s capacity in 2018 to be 1,023,400,000 metric tons, and the WSA reported China’s production to be 924,752,000 metric tons, which yields a capacity utilization of 90.4 percent. That calculation doesn’t work for 2019 production because we don’t know the current capacity. In the three months July through September, world steel production excluding China contracted by 3.3 percent year over year.
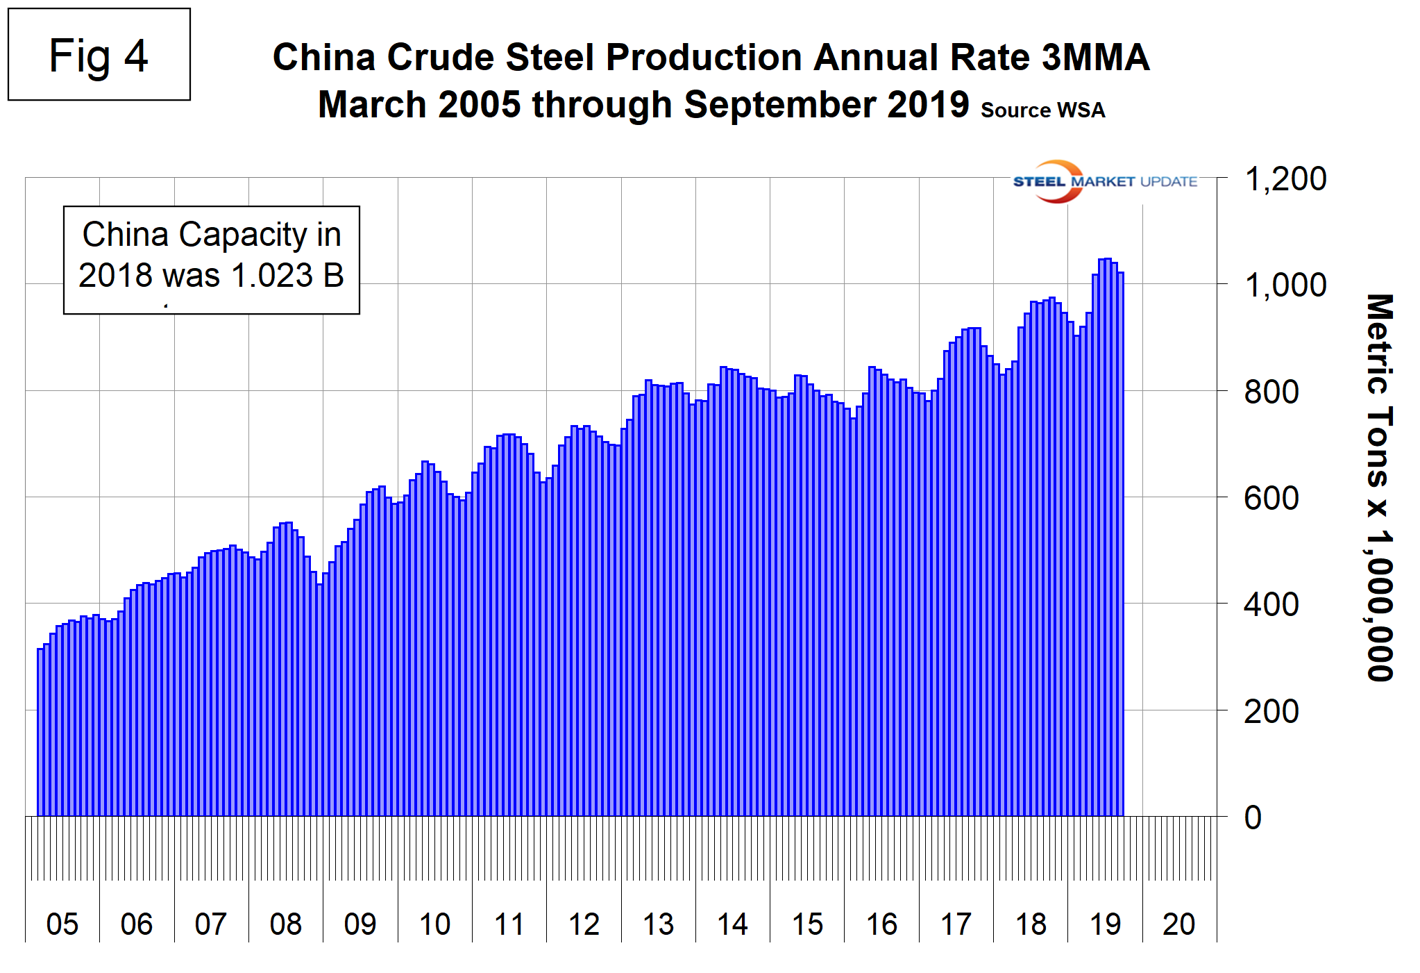
Figure 5 shows the growth of China’s steel production since January 2013 and Figure 6 shows the growth of global steel excluding China. China’s domination of the global steel market is increasing and in each month May through September had an annualized production rate of over one billion metric tons.
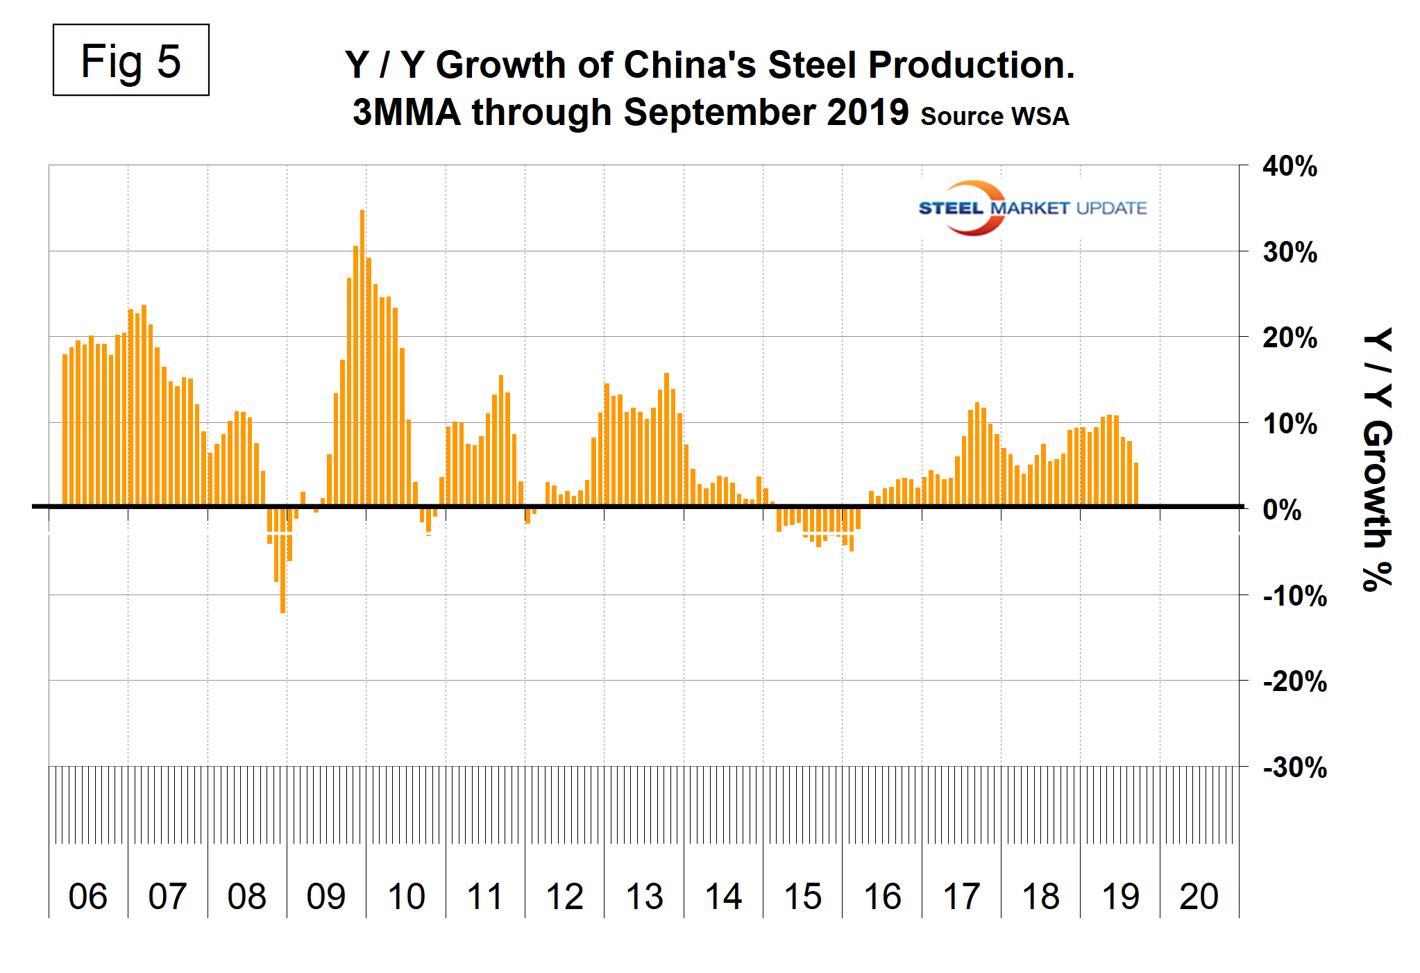
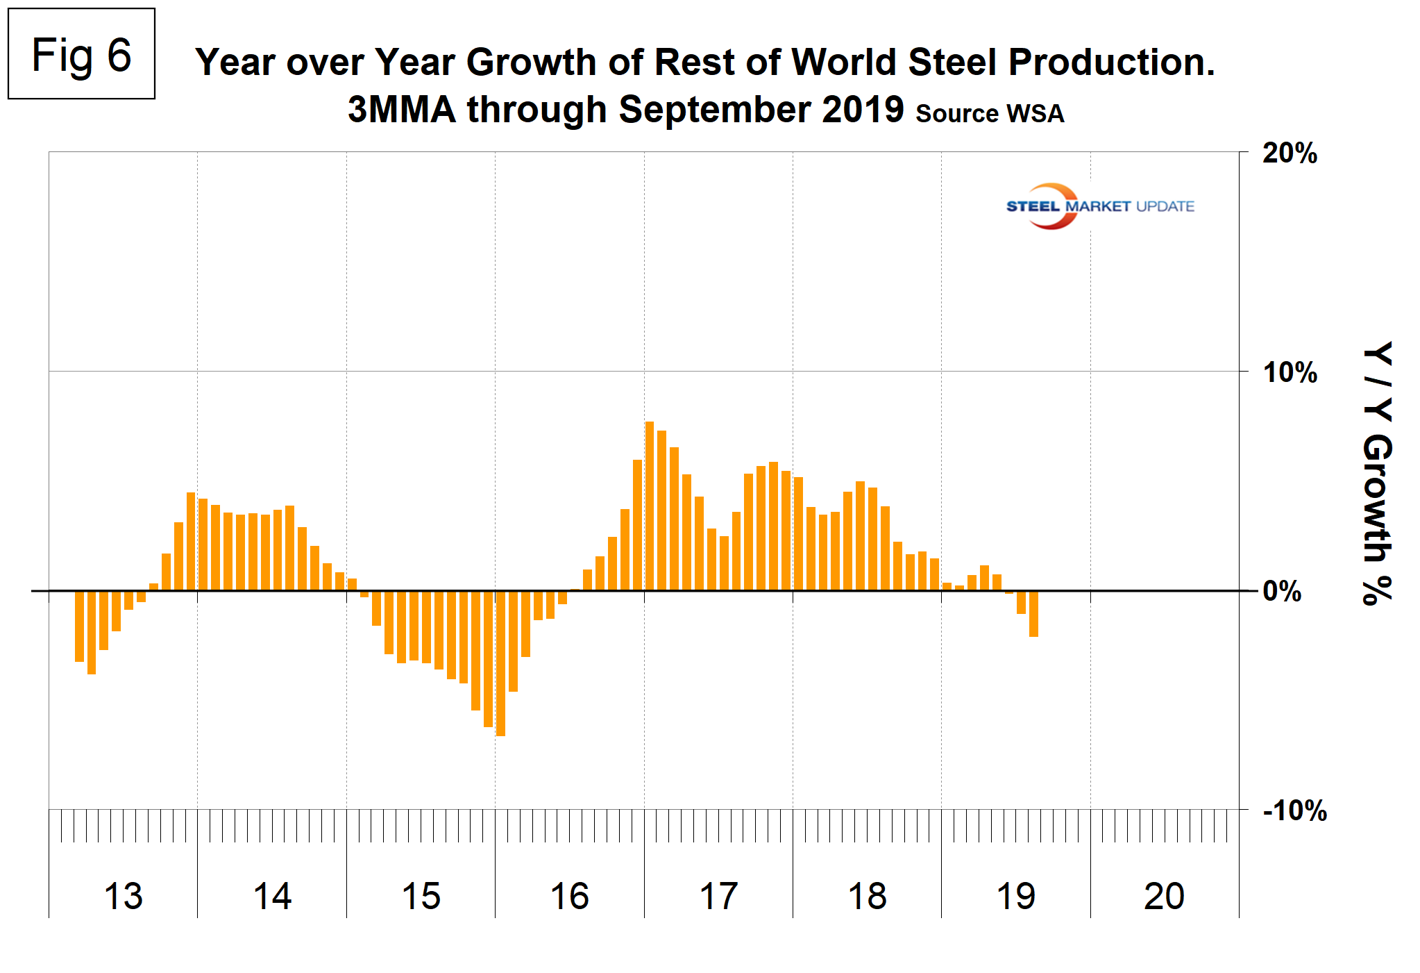
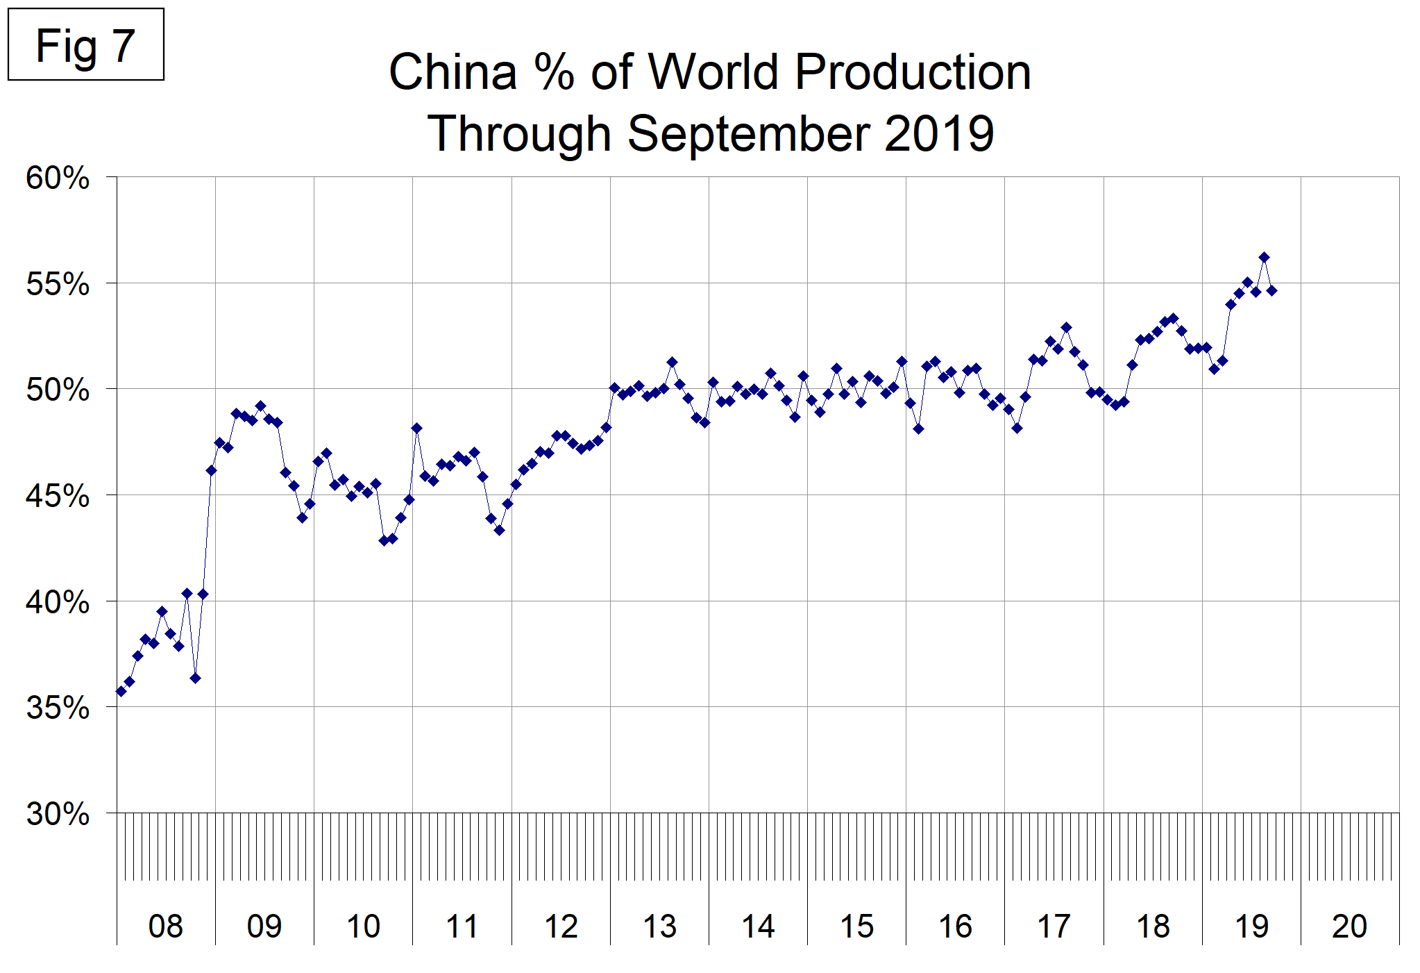
Figure 7 shows the growth of China’s share of global steel production, which in September was 54.6 percent, down from the all-time high of 56.2 percent in August.
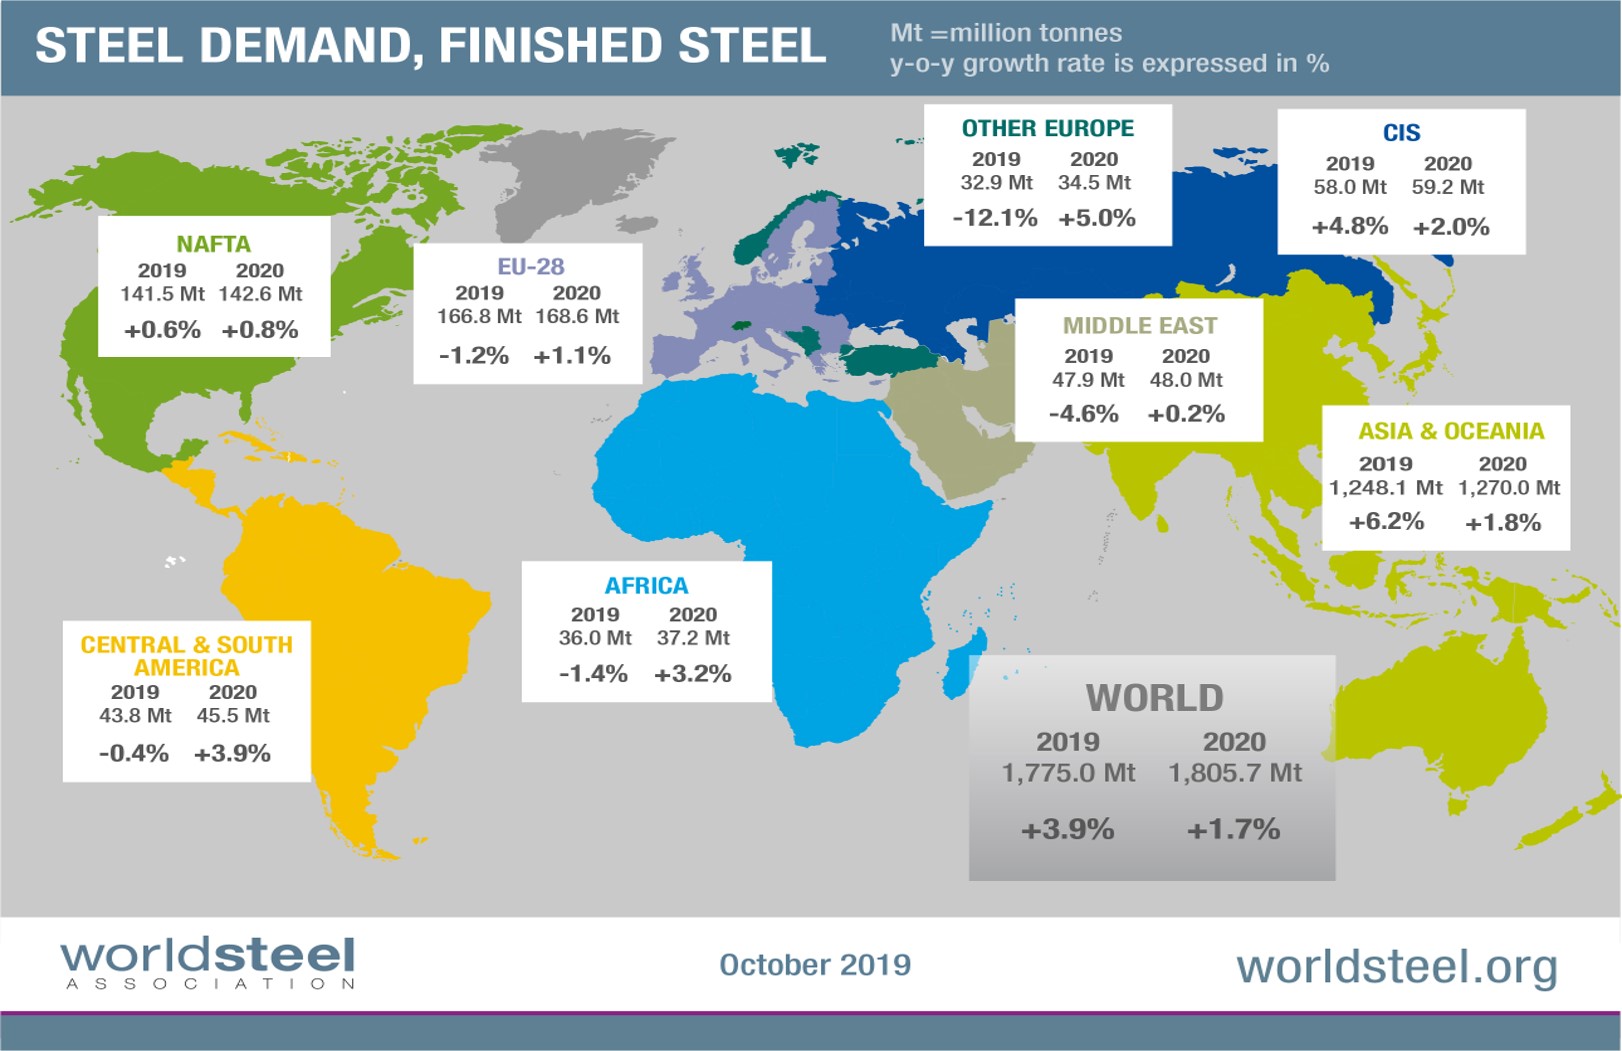
The October 2019 WSA Short Range Outlook, (SRO) for apparent steel consumption in 2019 and 2020 is shown by region in the map below. Commenting on the outlook, Al Remeithi, chairman of the worldsteel economics committee, said, “While the global economic outlook is highly unpredictable, we expect to see further growth in steel demand in 2020 of 1.7 percent, with emerging and developing economies excluding China contributing more. This forecast faces significant downside risks if the current level of uncertainty prevails. The current SRO suggests that global steel demand will continue to grow in 2019, more than we expected in these challenging times, mainly due to China. In the rest of the world, steel demand slowed in 2019 as uncertainty, trade tensions and geopolitical issues weighed on investment and trade. Manufacturing, particularly the auto industry, has performed poorly, contracting in many countries; however, in construction, despite some slowing, a positive momentum has been maintained.”
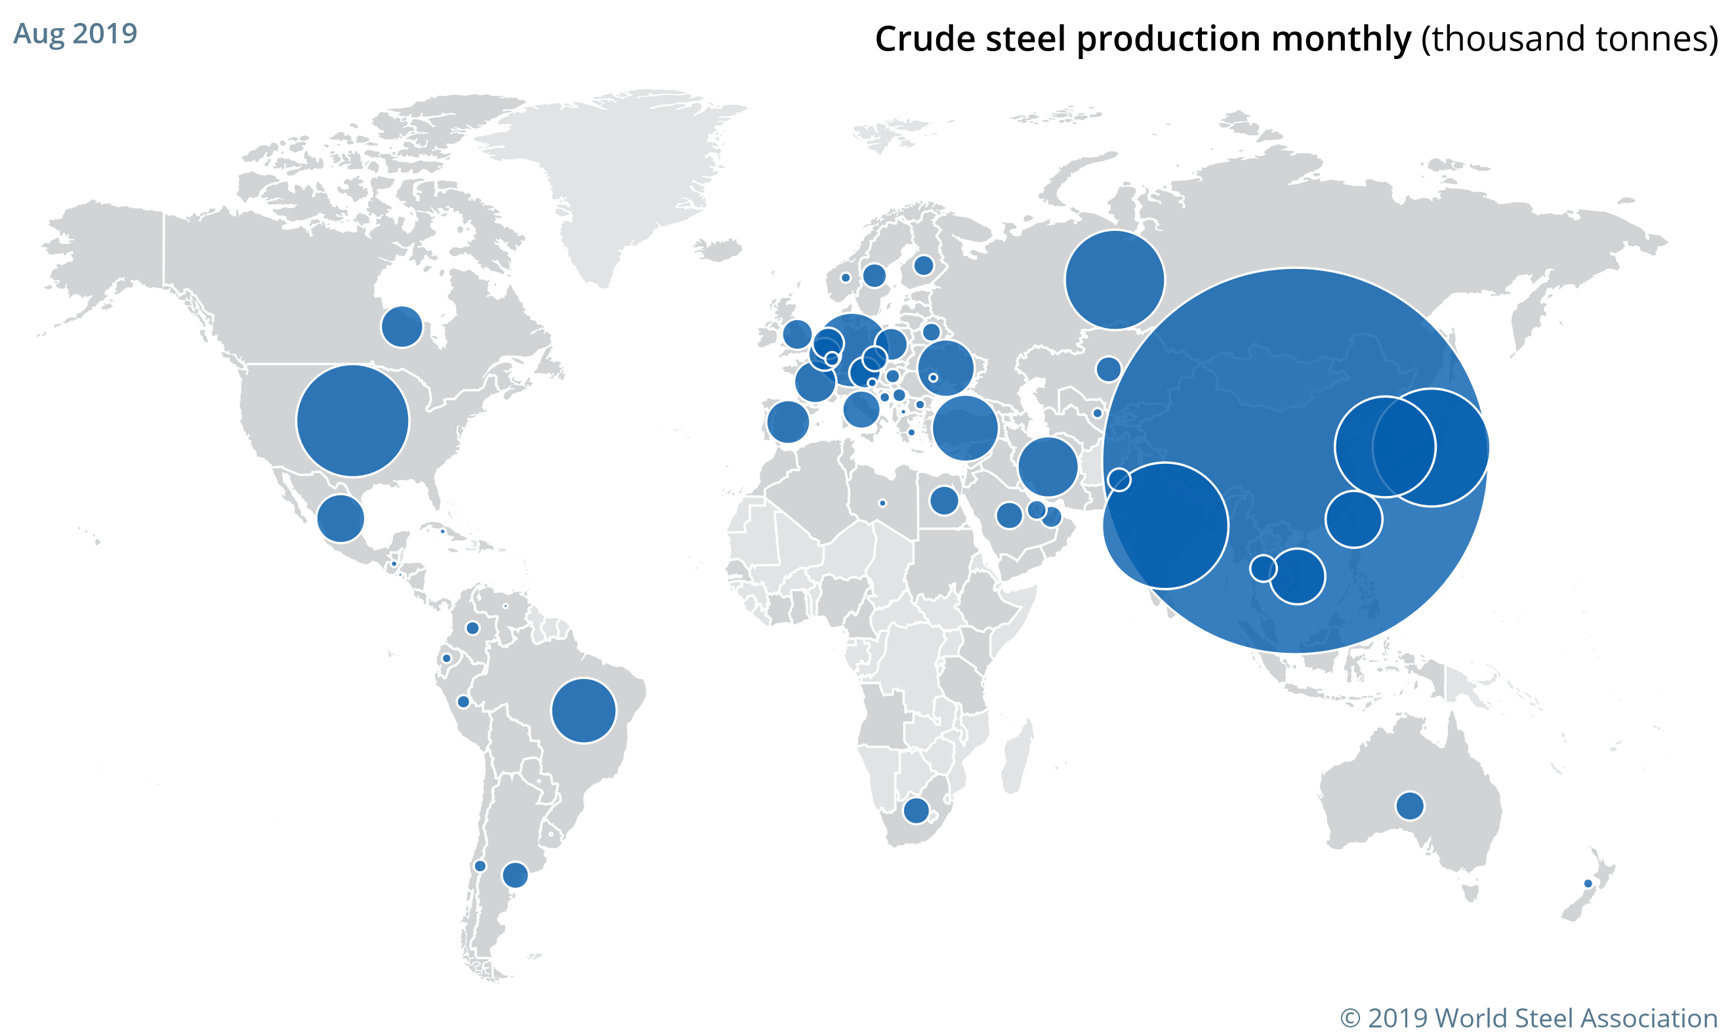
The figure below is a schematic from the WSA showing the relative production of the major steel producing nations in August.
SMU Comment: This analysis is based on data made public monthly by the World Steel Association. The WSA is one of the largest industry associations in the world. Members represent approximately 85 percent of the world’s steel production, including over 160 steel producers, national and regional steel industry associations, and steel research institutes. (Note at the bottom of Table 1 WSA says this represents 99 percent of steel production, so presumably there are reports of production by countries that include nonmembers.)


