

Market Data
November 20, 2019
SMU Energy Analysis: Rig Count Continues to Decline
Written by Peter Wright
Crude oil prices have been stable since mid-June, but the rig count continues to decline. The total number of operating rigs exploring for oil has declined by 211 or 23.8 percent since the end of last year.
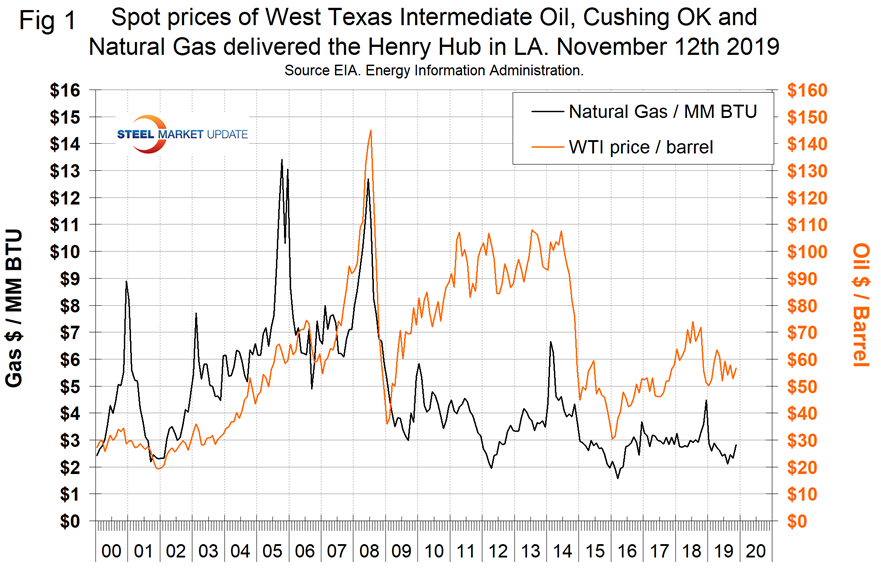
The spot price of West Texas Intermediate (WTI) FOB Cushing, Okla., has been very consistent since mid-June ranging from $51.14 on Aug. 7 to $57.04 on Nov. 5. The exception was a one-day spike on Sept. 16 when it reached $63.10. That was the extent of the reaction to the attack on the Saudi oil fields. On Nov. 15, WTI was priced at $56.67 and Brent was priced at $62.19 per barrel.
![]()
The prices of oil and natural gas drive the consumption of energy-related steel products including oil country tubular goods, pipe fittings and well head equipment, among others. Welded tubular goods (not including OCTG) consumed about 5.5 million tons of hot rolled sheet in 2018.
Figure 1 shows historical oil and gas prices on an early month basis from January 2000 through Nov. 12, 2019. Our price and inventory data come from the EIA (Energy Information Administration). On Nov. 8, natural gas at the Henry Hub in Oklahoma was priced at $2.81 per MMBtu (Million British Thermal Units), a seasonal increase of 48 cents on the month. Natural gas is priced to continue making inroads against coal as an electric power generator.
The EIA short-term energy forecast of Nov. 13 stated: “Brent crude oil spot prices averaged $60 per barrel (b) in October, down $3/b from September and down $21/b from October 2018. EIA forecasts Brent spot prices will average $60/b in 2020, down from a 2019 average of $64/b. EIA forecasts that West Texas Intermediate (WTI) prices will average $5.50/b less than Brent prices in 2020. EIA expects crude oil prices will be lower on average in 2020 than in 2019 because of forecast rising global oil inventories, particularly in the first half of next year.”
On Nov. 8, the EIA reported that U.S. commercial crude oil inventories (excluding those in the Strategic Petroleum Reserve) increased in eight of the previous nine weeks for a total of 27.6 million barrels. Figure 2 shows the inventory level, including the strategic petroleum reserve and the year-over-year change.
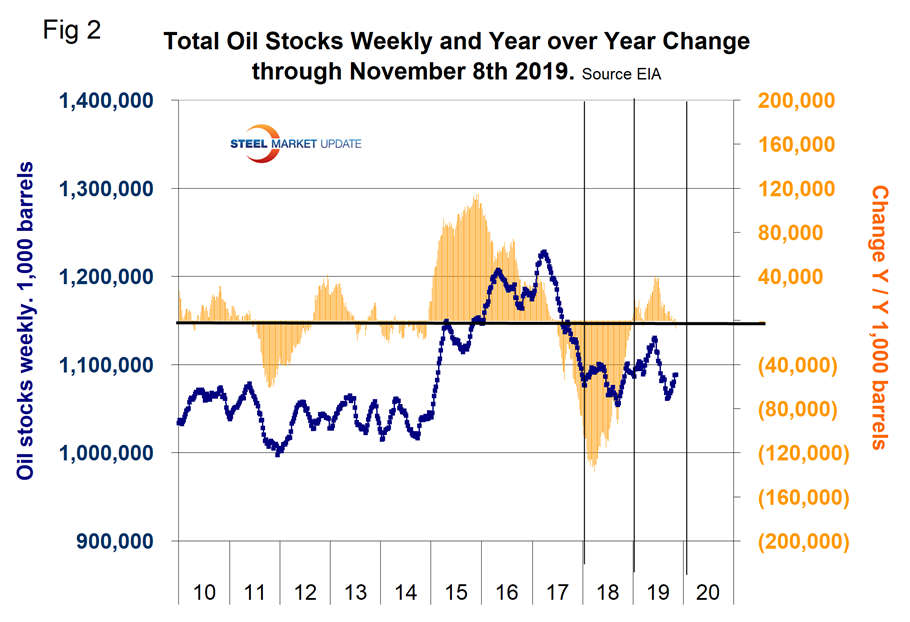
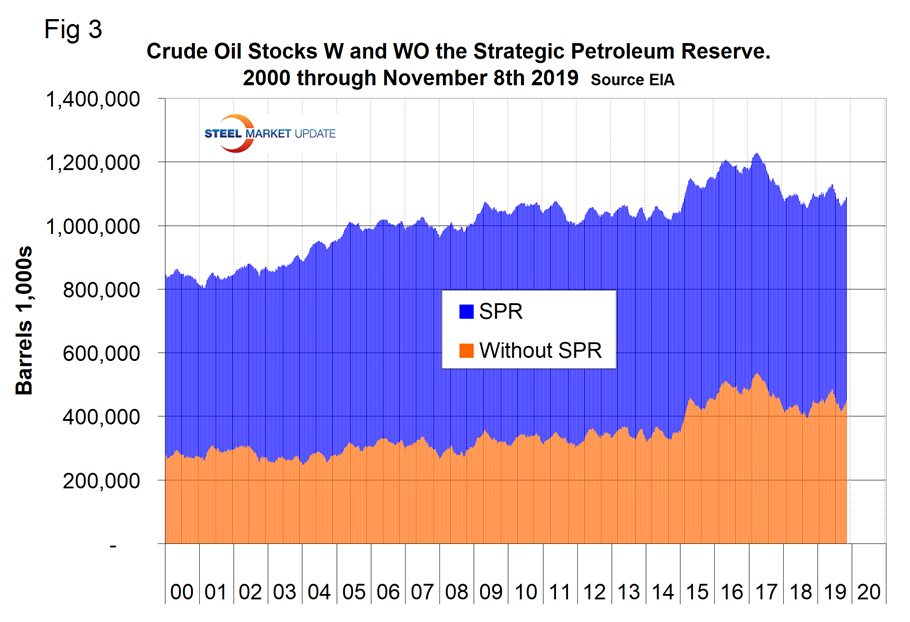
Figure 3 breaks total crude inventory into the working portion and the strategic petroleum reserve.
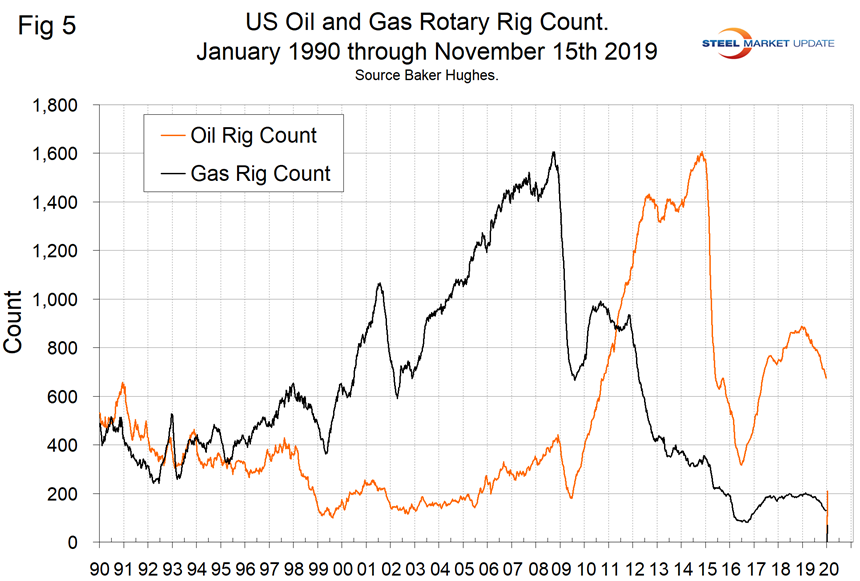
The total number of operating rigs in the U.S. on Nov. 15 was 806, down by 280 since the last week of 2018 or 25.6 percent. Oil rigs were down by 211 and gas by 69. Figure 4 shows the total number of operating rigs in the U.S. and the weekly change.
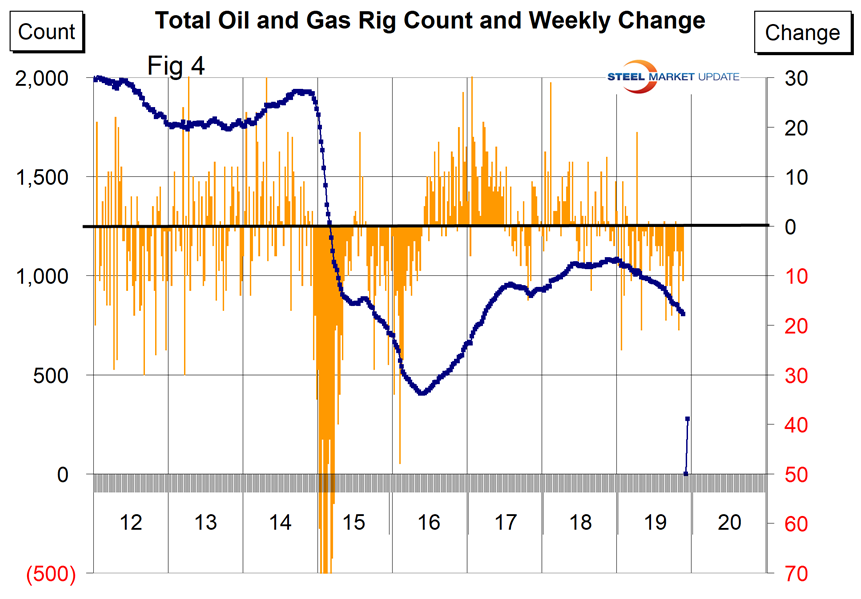
The oil rig count had a low point of 316 on June 27, 2016, and stood at 674 on Nov. 15, 2019.
The U.S. gas rig count rose from its low point of 81 on Aug. 5, 2016, to 202 on Jan. 11, 2019, before falling back to 129 on Nov. 15, 2019. The year-over-year growth rate of total U.S. operating rigs was negative 25.5 percent in the latest data with oil down by 24.1 percent and gas down by 33.5 percent. Figure 5 shows the Baker Hughes U.S. Rotary Rig Counts for oil and gas equipment in the U.S. (explanation below).
On a regional basis in the U.S., the big three states for operating rigs are Texas, Oklahoma and North Dakota. Figure 6 shows the land rig count in those states since 2000.
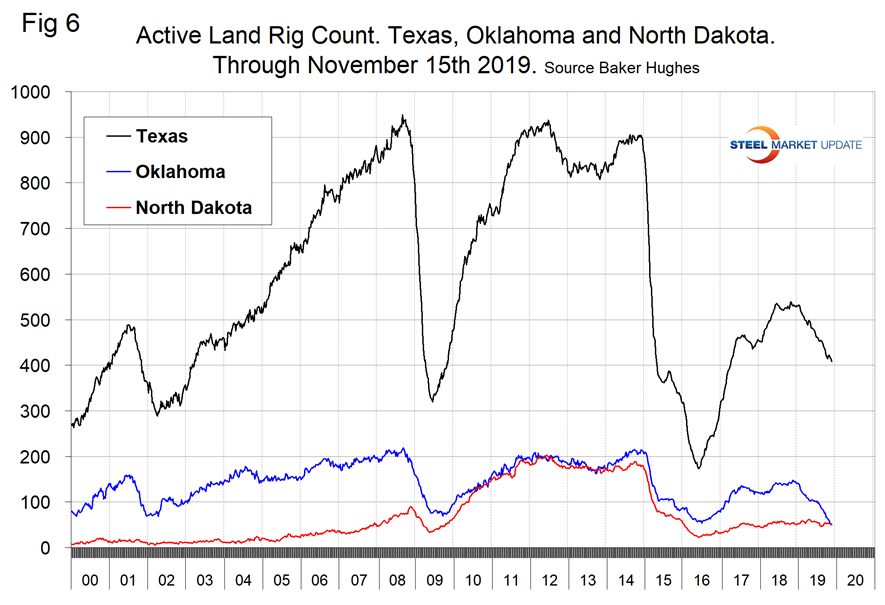
Figure 7 illustrates the monthly U.S. oilfield production of crude from January 1970 through August 2019 (latest data available) in thousands of barrels per month. The historical high was October 1970 at 310.4 million barrels. Production steadily declined to half that level in the late 2000s before the fracking revolution. December 2017 broke the record that had stood for 47 years with 311.2 million barrels produced. August 2019 set another record of 383.3 million barrels.
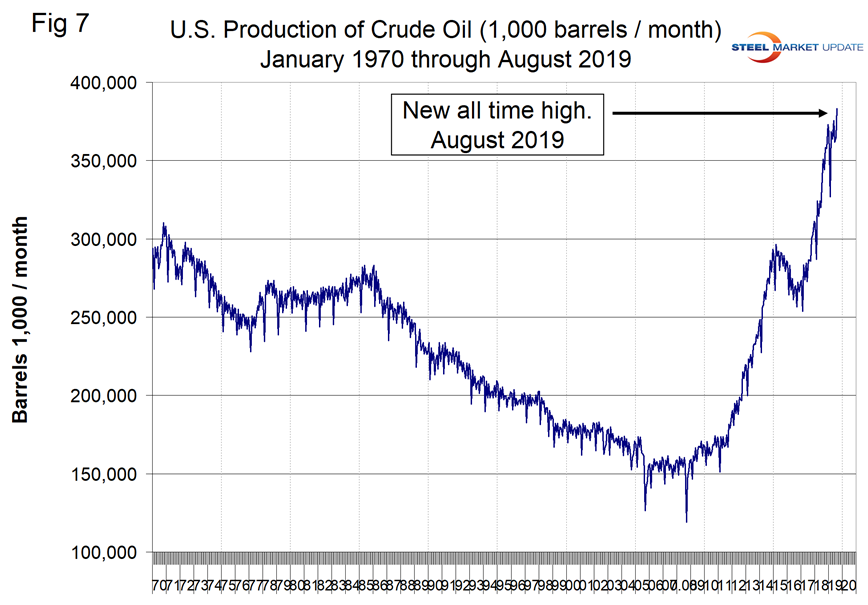
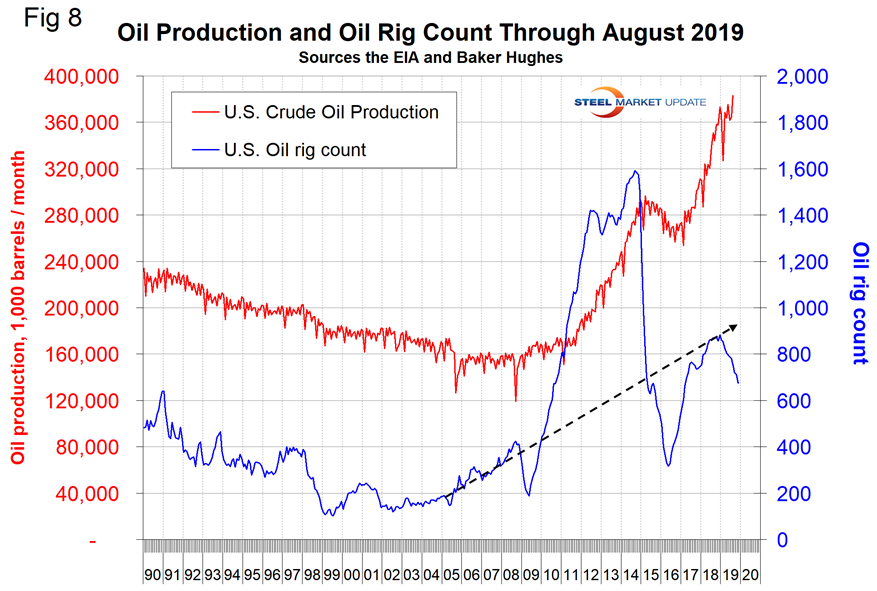
Figure 8 compares oil production and the oil rig count and shows how the increase in exploratory wells drove production from 2009 through late 2014 when the oil price collapsed. Production and rig count have been moving in opposite directions for all of 2019 as previously drilled and capped wells are put into production.
Baker Hughes Rotary Rig Count: This is a weekly census of the number of drilling rigs actively exploring for or developing oil or natural gas in the United States. Rigs are considered active from the time they break ground until the time they reach their target depth and may be establishing a new well or sidetracking an existing one. The Baker Hughes Rotary Rig count includes only those rigs that are significant consumers of oilfield services and supplies.


