Analysis

November 27, 2019
North American Automotive Production Slowed in October
Written by Peter Wright
Irrespective of the GM strike, light vehicle assemblies in North America slowed through October.
This report is based on data from LMC Automotive for automotive assemblies in the U.S., Canada and Mexico. The breakdown of assemblies is “Personal” (cars for personal use) and “Commercial” (light vehicles less than 6.0 tonnes gross vehicle weight rating). Heavy trucks and buses are not included. In this report we will briefly describe light vehicle sales in the U.S. before reporting in detail on assemblies in the three regions of North America.
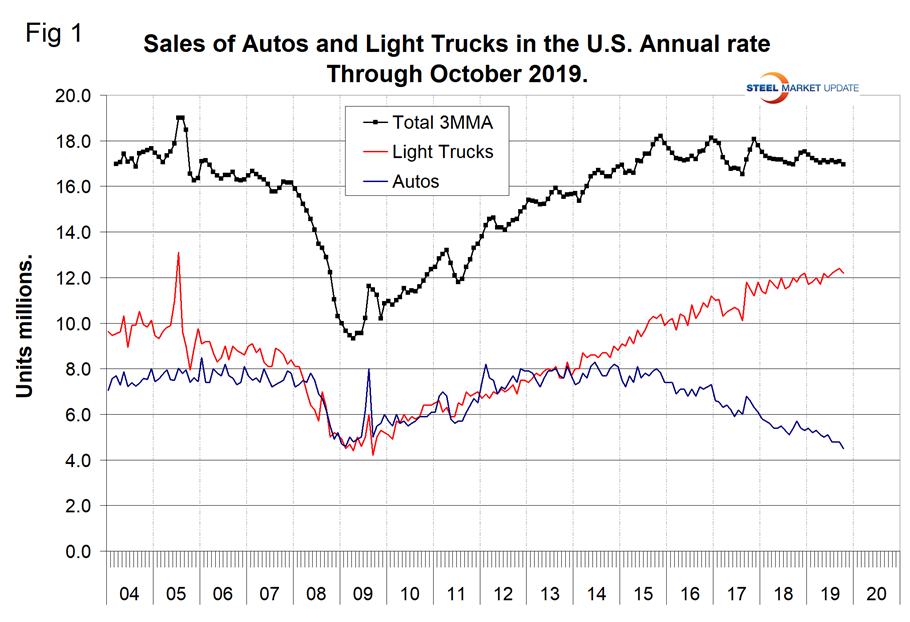
U.S. Vehicle Sales: Economy.com summarized October’s vehicle sales as follows: “U.S. unit vehicle sales slowed in October, decreasing to 16.6 million seasonally adjusted annualized units. Light truck and SUV sales decreased 2.1% to 12.2 million annualized units. Car sales fell 6.5% to 4.5 million annualized units. October vehicle sales were well below the 2019 average through September of 17 million annualized units. Additionally, sales for October came in 4.3% below 2018 numbers. The soft landing for the new-vehicle market looks a bit more precarious with the drop in October sales. Slowing U.S. economic growth had been rebuffed by strong consumer sentiment throughout the third quarter, but this may be a signal of slowing sales numbers through the end of 2019 and into 2020.”
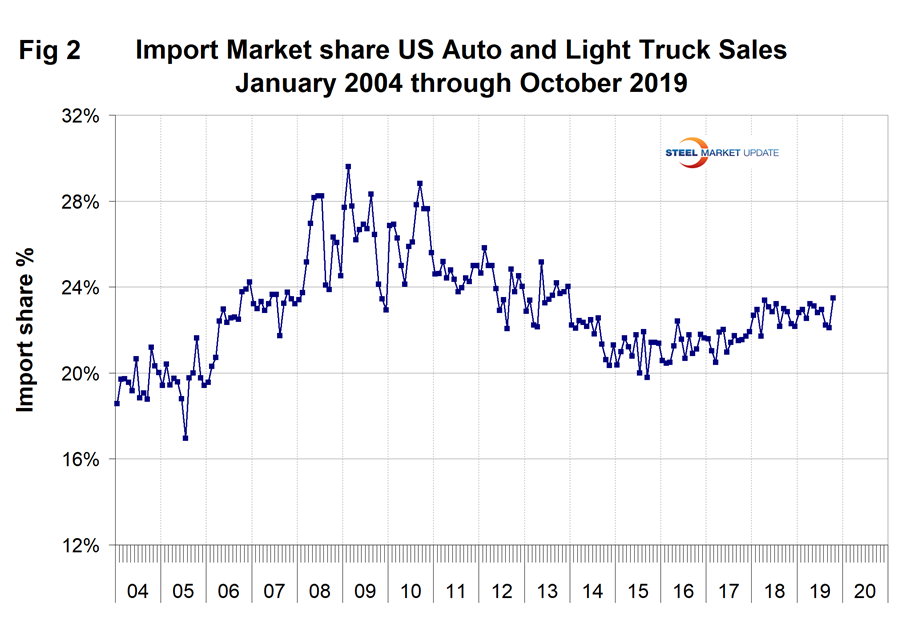
Figure 1 shows auto and light truck sales since January 2004. In October total sales were down by 1.4 percent on a three-month moving average (3MMA) basis year over year. Light trucks that include pickups, SUVs and crossovers have been surging at the expense of cars for four years. In October, the mix was 73.1 percent light trucks and 26.9 percent autos. May was the first month ever for light trucks to exceed a 70 percent share and that share has increased every month since then. In 2019, import market share had a high of 23.5 percent in October, up from 22.1 percent in September as shown in Figure 2.
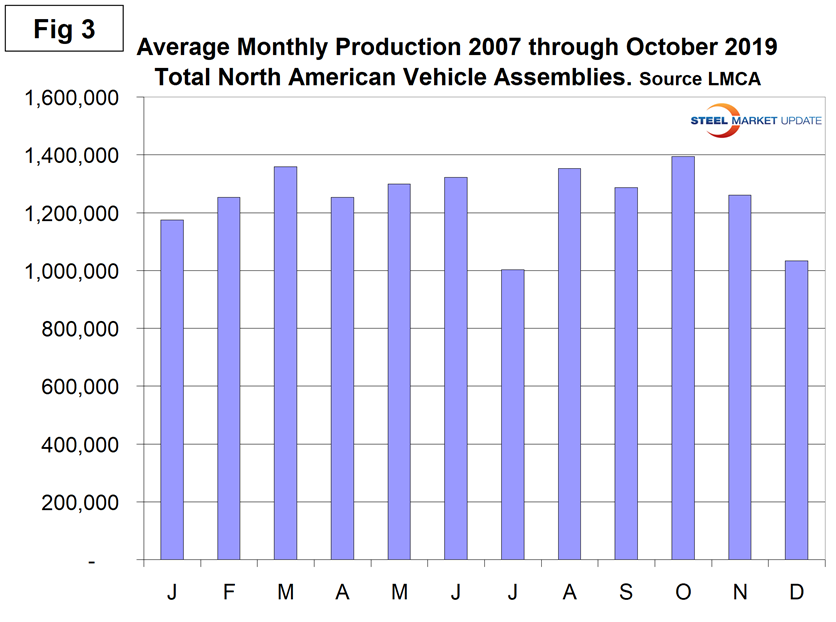
North American Assemblies: The United Auto Workers strike against General Motors began on Sept. 16 and lasted for 40 days affecting more than 48,000 workers. It closed 34 GM plants across the US, forced suppliers to idle workers and disrupted operations in Mexico and Canada. Total light vehicle (LV) production in North America in October was at an annual rate of 15.1 million units, down from 16.3 million in September. On average since 2007, October’s production has been up by 8.4 percent from September. This year production was down by 7.3 percent. Figure 3 illustrates the seasonality of production on average since January 2007. Normally October is the highest month for production, but in the first 10 months of 2019 October was the second lowest. On a rolling 12-months basis, total North American assemblies were down by 3.8 percent year over year through October. Note that production numbers are not seasonally adjusted; the sales data reported above are seasonally adjusted.
There has been a gradual slowdown in production since October 2017, which prior to the strike had almost stabilized as indicated by the brown bars in Figure 4.
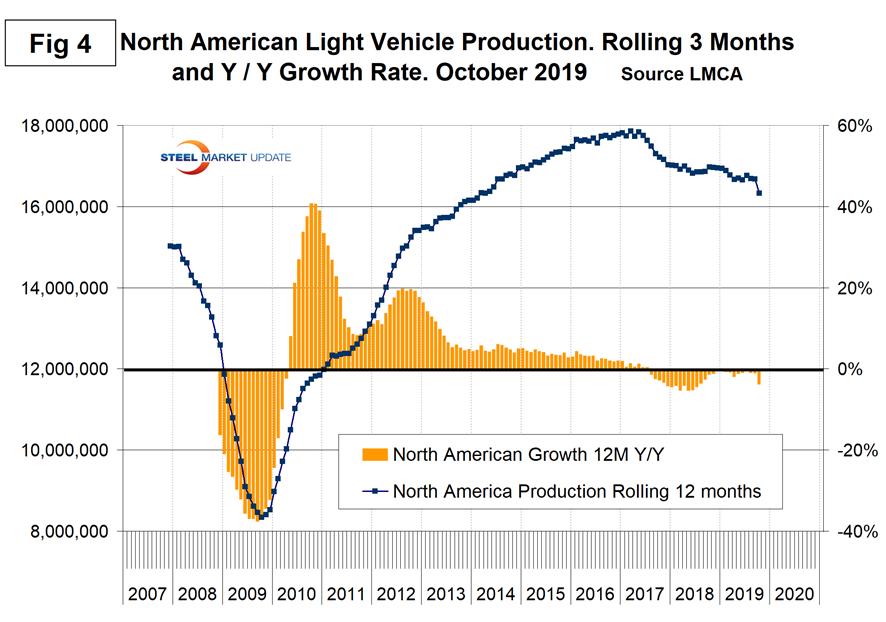
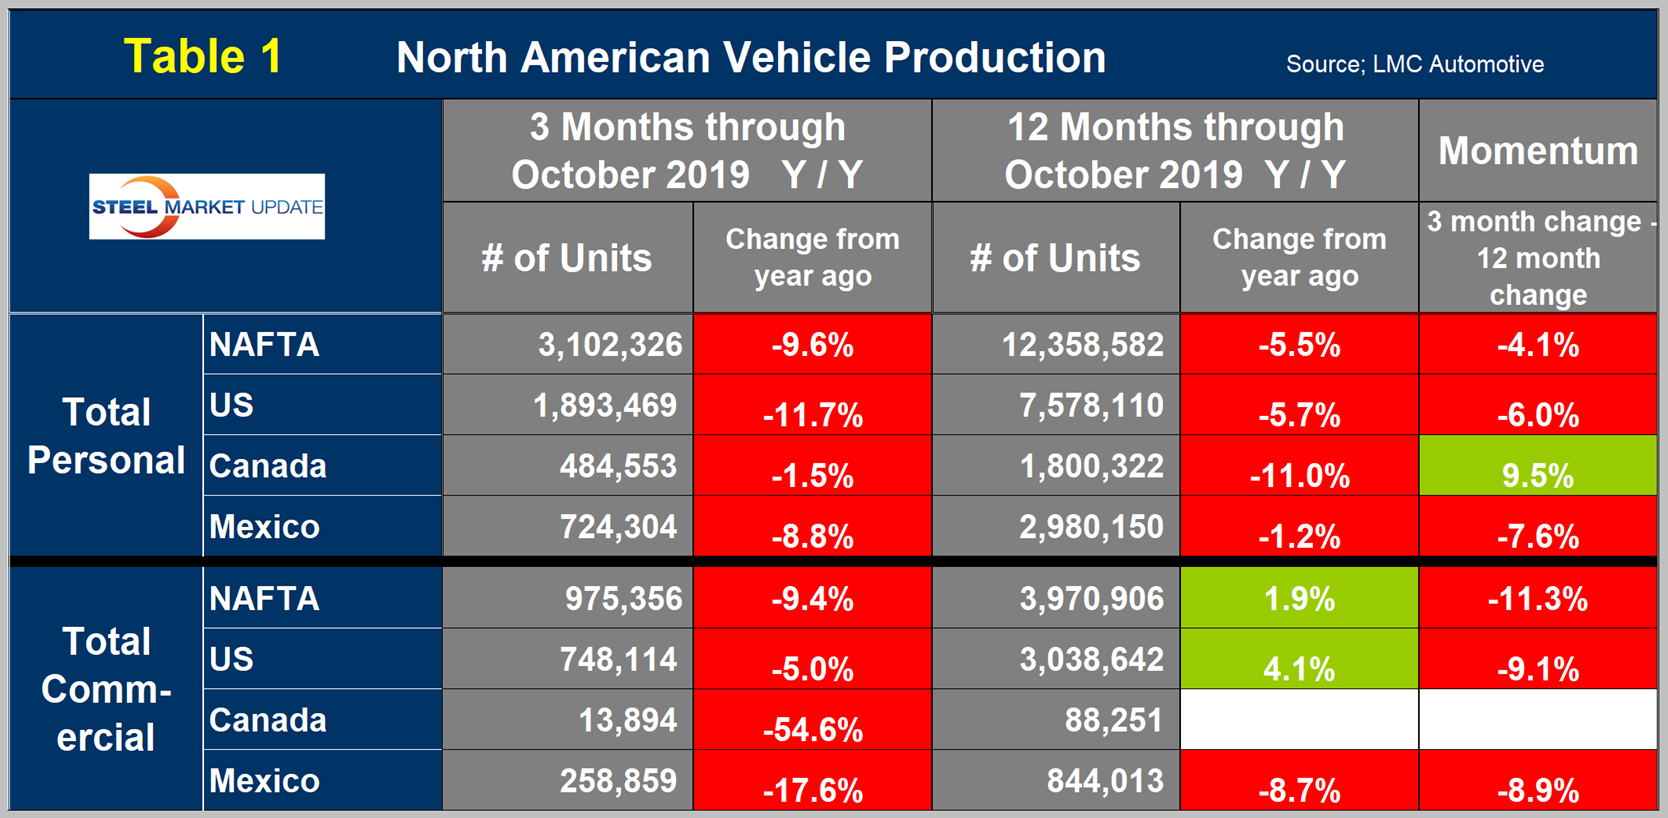
Table 1 is a short-term snapshot of assembly by nation and vehicle type. It breaks down total North American personal and commercial vehicle production into the U.S, Canada and Mexican components and the three- and 12-month growth rate for each. At the far right it shows the momentum for the total and for each of the three nations. In three months through October, assemblies of both personal and commercial vehicles were down in all three nations. We don’t know the magnitude of the strike effect, but as far back as January this year and since then the total of NAFTA assemblies was negative on a 3MMA basis year over year. Note, there are blank cells for Canadian commercial production in Table 1. See explanation below.
The longer-term picture is shown in the following charts by vehicle type and nation.
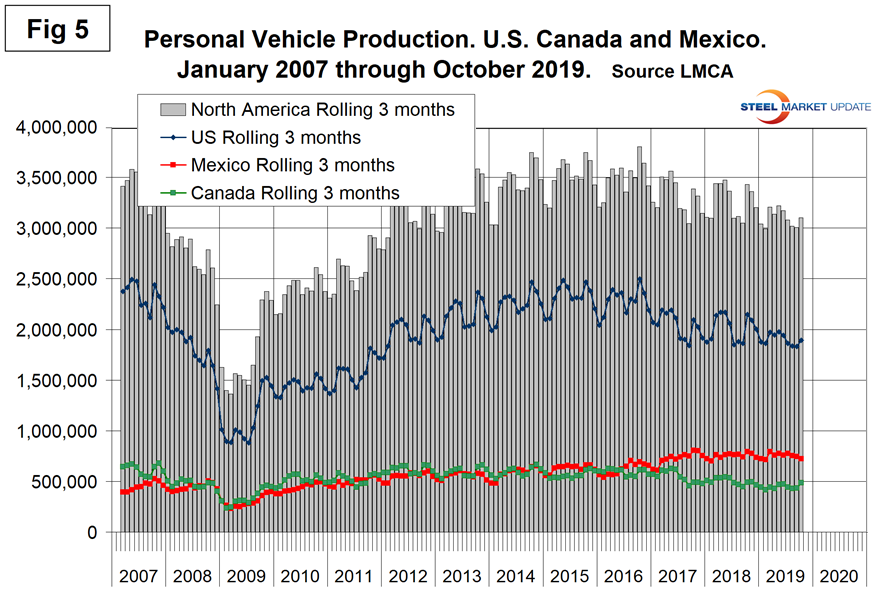
Figure 5 shows the total personal vehicle production for North America and the total for each nation.
Figures 6, 7 and 8 show the production of personal vehicles by nation and the year-over-year growth rate for each. Figure 9 shows the production share for each nation. Production in the U.S. and Canada has declined since 2015 as Mexico has increased. The Mexican share rose from 17.2 percent in late 2014 to 25.2 percent in July 2019 before falling back to 23.3 percent in October.
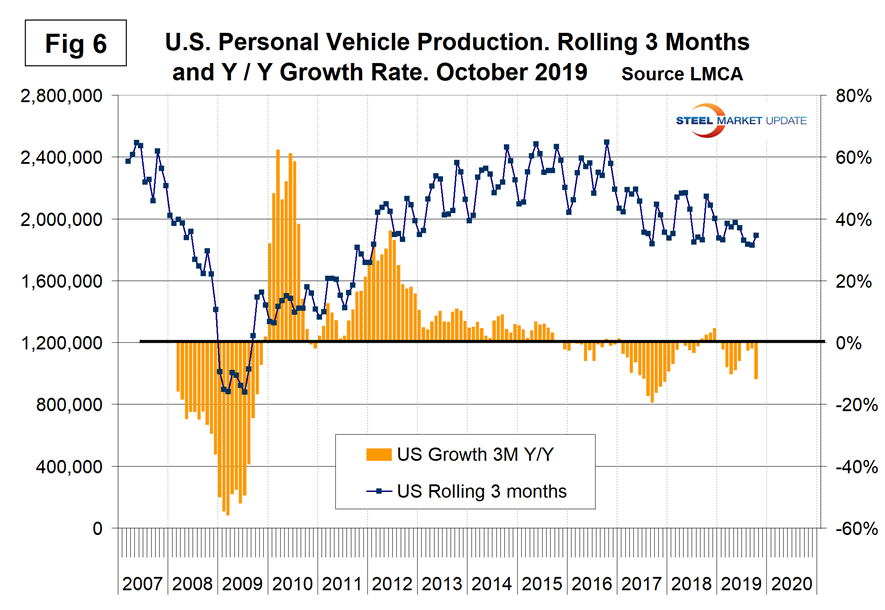
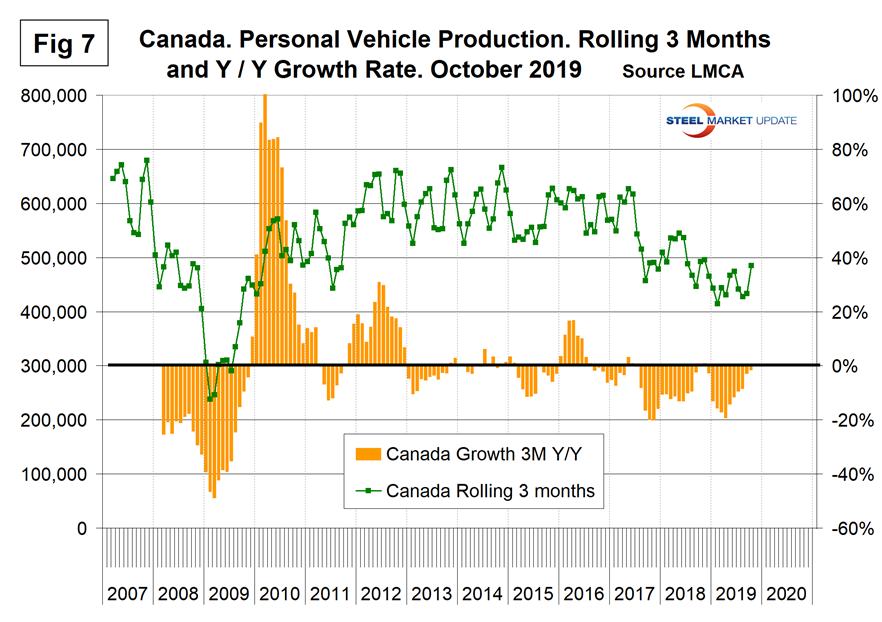
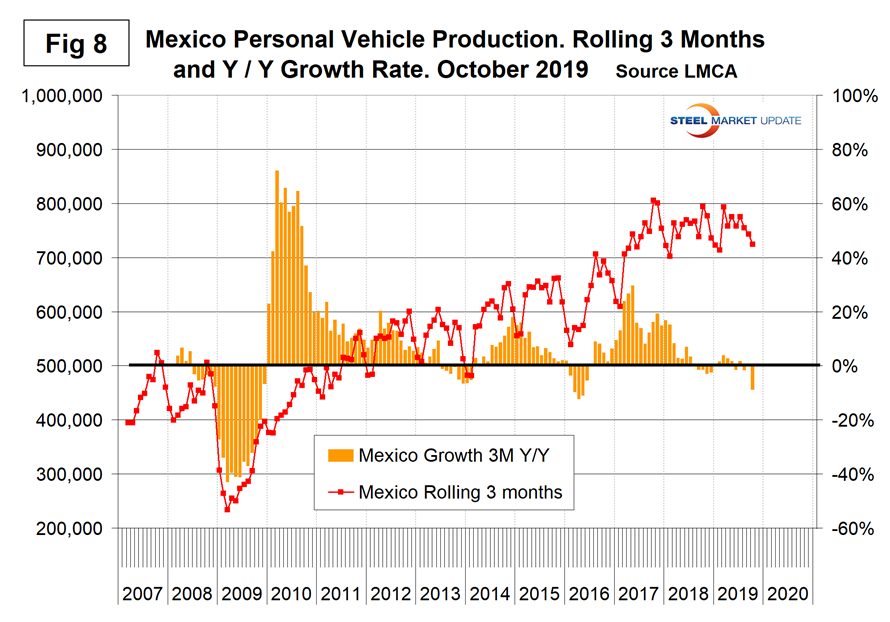
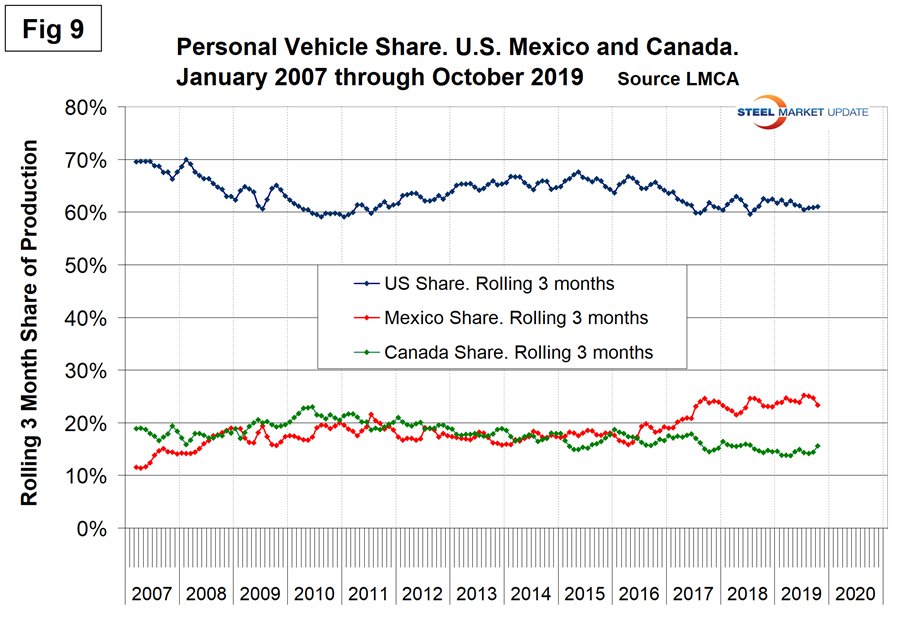
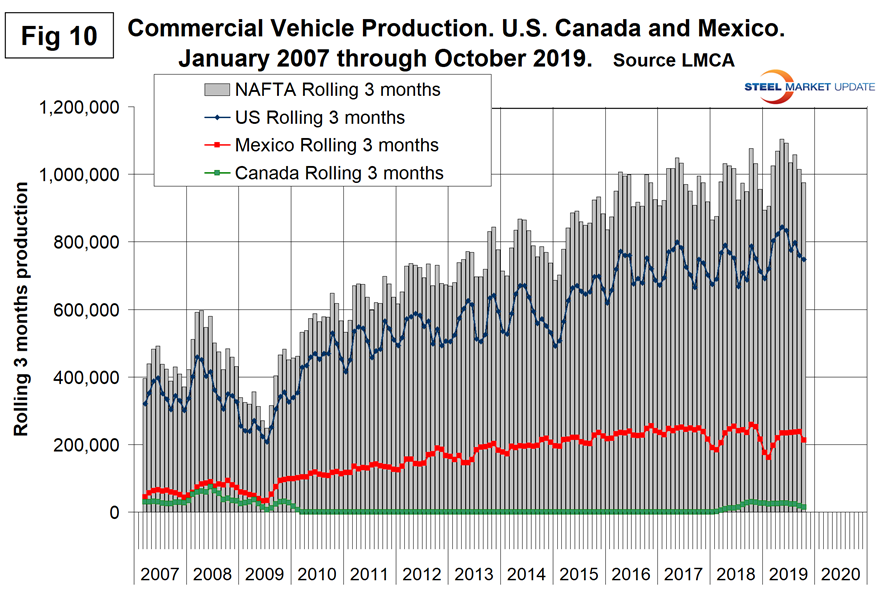
Figure 10 shows the total commercial vehicle production for North America and the total for each nation. The U.S. has held its ground much better in commercial vehicles than in the personal segment.
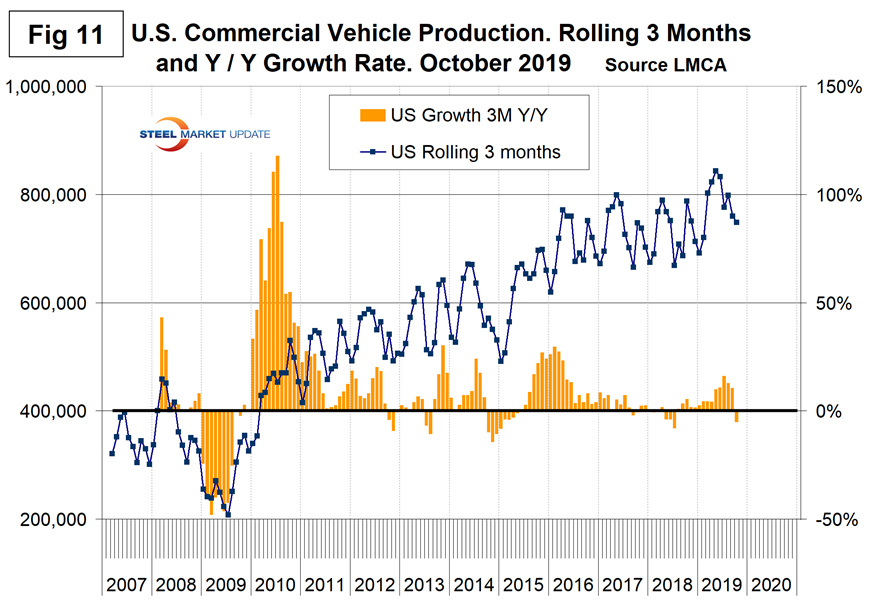
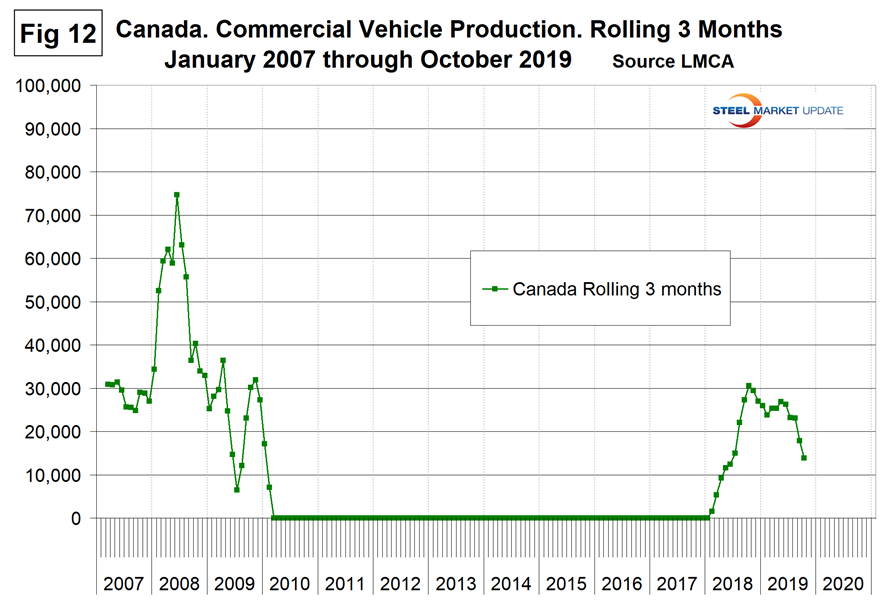
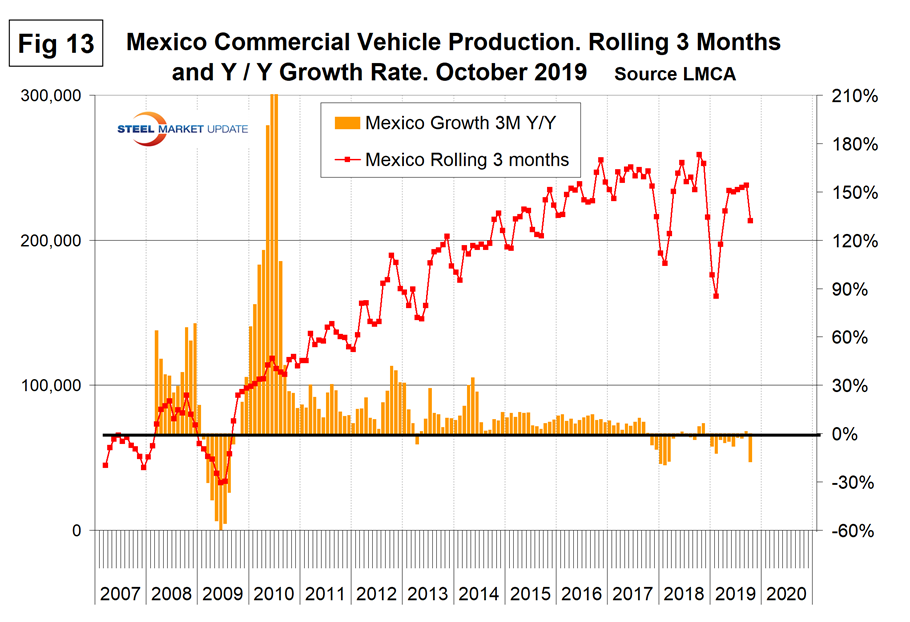
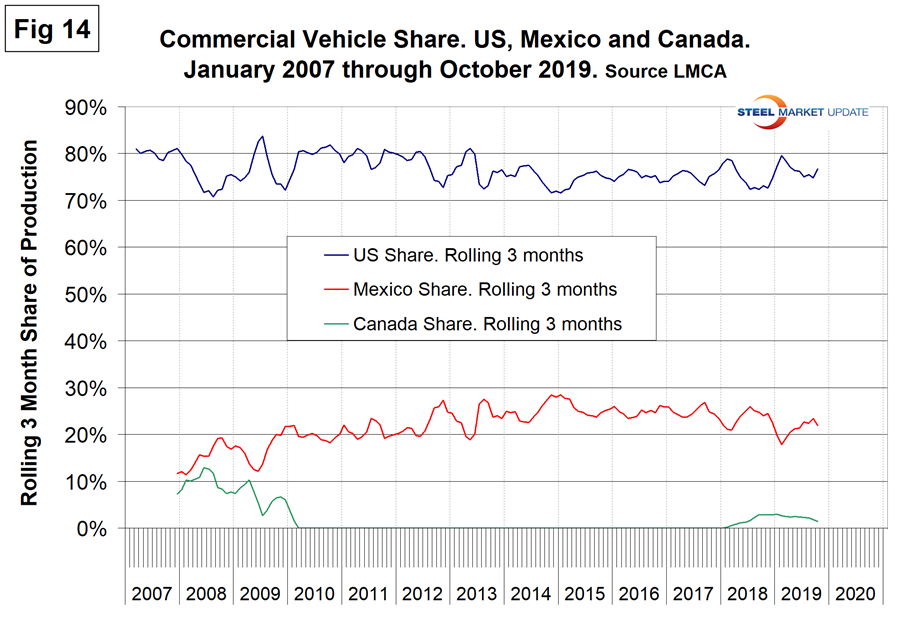
Figures 11, 12 and 13 show the production of commercial vehicles by nation and the year-over-year growth rate for each, and Figure 14 shows the production share for each nation. Commercial vehicle production in Canada was zero from January 2010 through January 2018. The only Canadian plant making commercial vehicles in the past couple of decades was in Oshawa. At the end of 2009 they shifted their production from Silverados to build the Chevy Camero. That changed again in February 2018 when the Oshawa plant shifted away from the Equinox (personal vehicle) and again began to produce the Silverado and Sierra (both commercial vehicles). GM has declared their intention to permanently close the Oshawa plant.
Both the U.S. and Mexico have achieved strong growth in commercial vehicle assemblies since the recession and their production shares have been stable and almost a mirror image of each other in the short term. Mexico currently exports about 80 percent of its light vehicle production, with the U.S and Canada as the highest volume destinations.
SMU Comment: The GM strike negatively affected assemblies in North America in October, therefore this report is a bit of an anomaly. Our next update will be for December production by which time we will have a clearer picture. However, there is no doubt that assembly volume in North America is declining. The last month that had a positive growth on a rolling 12-month basis year over year was July 2017.