Market Data

January 21, 2020
Update on Manufacturing Indicators in January
Written by Peter Wright
Steel Market Update is pleased to share this Premium content with Executive-level members. For more information on how to upgrade to a Premium-level subscription, email Info@SteelMarketUpdate.com.
Based on Steel Market Update’s analysis of 10 indicators in January, the decline in U.S. manufacturing continues.
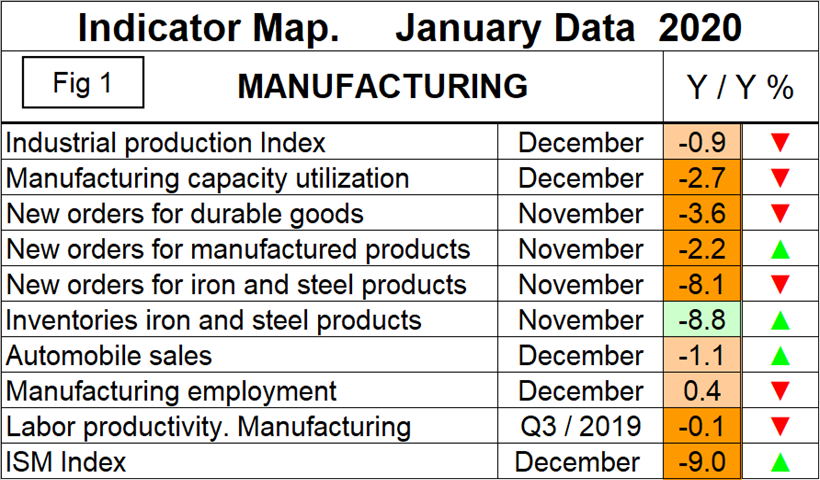
![]() This report summarizes 10 data streams that describe the state of U.S. manufacturing in general and the steel industry in particular. We have reported on most of these separately in our Steel Market Update publications, and therefore will be brief in this summary. Our intent in summarizing them in one document is to provide a consensus of the state of this critical steel consuming sector. In data released in January, the year-over-year growth rate of nine of the 10 data streams was negative on a 3MMA (three-month moving average) basis and one was positive. The only good news is that four of the 10 declined more slowly. Figure 1 is a summary of data received in January and shows the year-over-year percentage change on a 3MMA basis. The summary sheet shows directional arrows comparing January data releases to December’s. Based on American Iron and Steel Institute estimates of steel mill shipments by market classification, almost 50 percent of the steel consumed in the U.S. is manufacturing-oriented. This breaks down to about 27 percent in ground transportation, 9 percent in machinery and equipment, 5 percent in appliances, 4 percent in defense and 4 percent in containers.
This report summarizes 10 data streams that describe the state of U.S. manufacturing in general and the steel industry in particular. We have reported on most of these separately in our Steel Market Update publications, and therefore will be brief in this summary. Our intent in summarizing them in one document is to provide a consensus of the state of this critical steel consuming sector. In data released in January, the year-over-year growth rate of nine of the 10 data streams was negative on a 3MMA (three-month moving average) basis and one was positive. The only good news is that four of the 10 declined more slowly. Figure 1 is a summary of data received in January and shows the year-over-year percentage change on a 3MMA basis. The summary sheet shows directional arrows comparing January data releases to December’s. Based on American Iron and Steel Institute estimates of steel mill shipments by market classification, almost 50 percent of the steel consumed in the U.S. is manufacturing-oriented. This breaks down to about 27 percent in ground transportation, 9 percent in machinery and equipment, 5 percent in appliances, 4 percent in defense and 4 percent in containers.
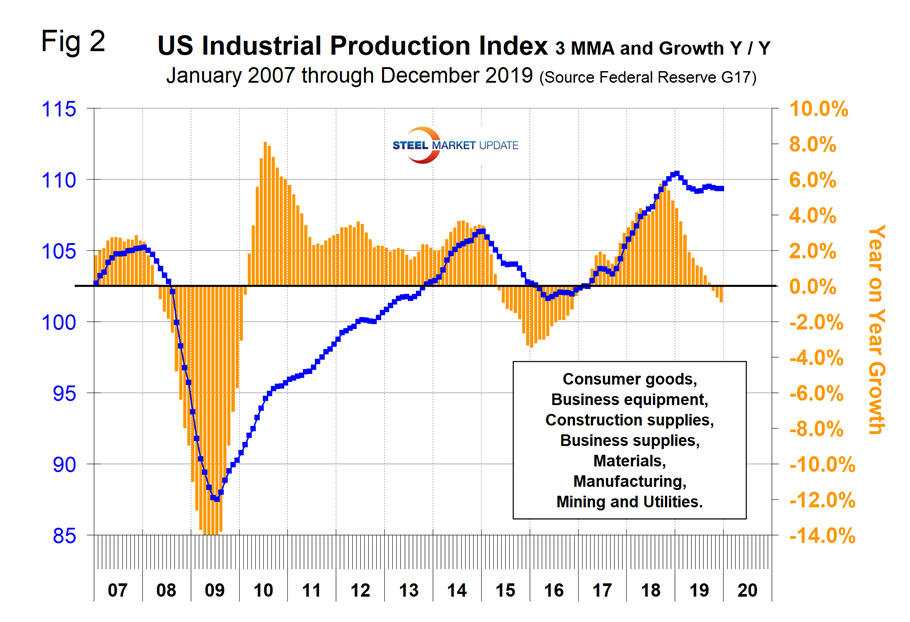
The Industrial Production Index
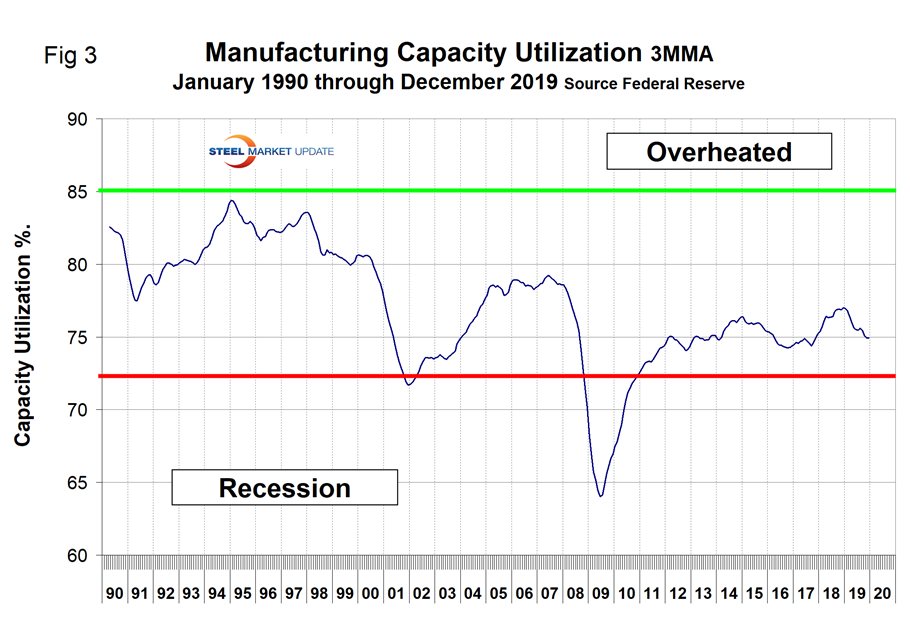
Figure 2 shows the 3MMA of the industrial production (IP) index since January 2007 as the blue line and the year-over-year growth as the brown bars. The IP index is a gauge of output from factories, mines and utilities. March 2017 was the first month of positive growth in the 3MMA since April 2015. Year over year, the growth of the 3MMA peaked at 5.8 percent in September 2018 and has contracted every month through December when it reached negative 0.9 percent. Manufacturing capacity utilization improved from 74.48 percent in January 2017 to 77.01 percent in December 2018 and had declined in 2019 to 74.94 percent in December with a negative year-over-year growth rate of 2.7 percent on a 3MMA basis (Figure 3).
New Orders for Durable Goods (Advance Report)
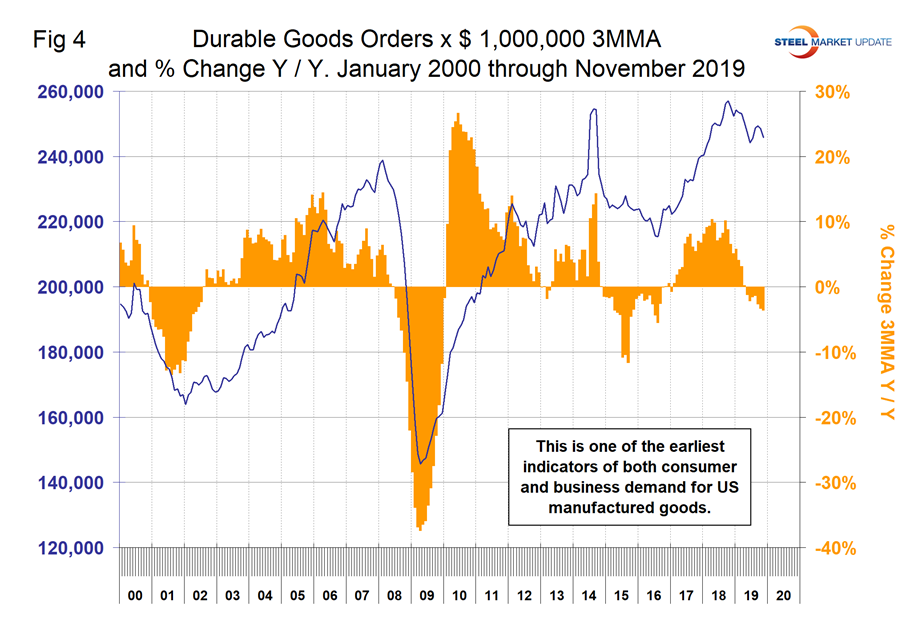
The year-over-year growth rate of durable goods reached 10.1 percent in September 2018 and since then has declined to negative 3.6 percent in November. Figure 4 shows the 3MMA since January 2010. This is considered to be one of the earliest indicators of both consumer and business demand for U.S. manufactured goods. Orders have picked up since May this year, but year over year are still in negative territory.
New Orders for Manufactured Products
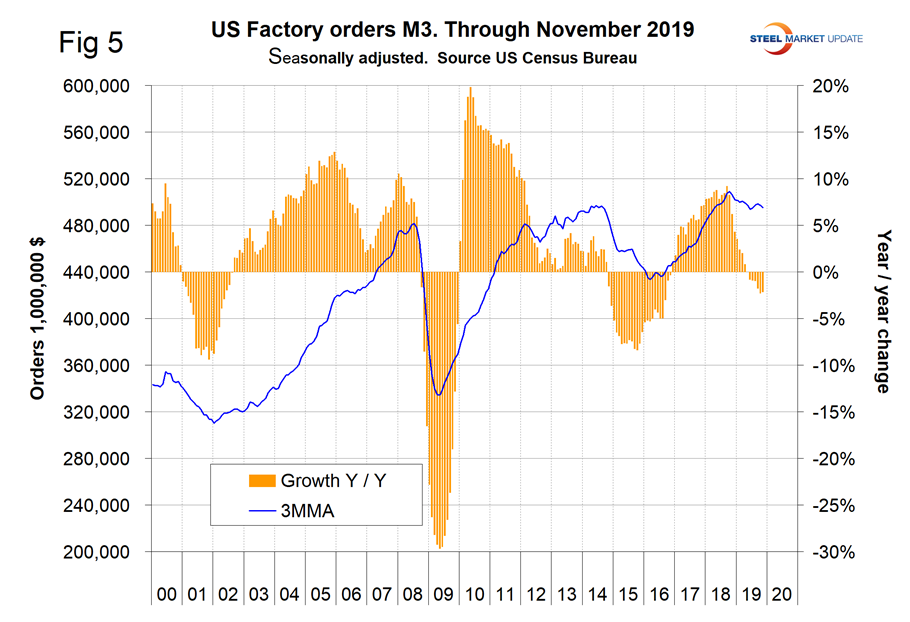
The growth rate of new orders for manufactured products as reported by the Census Bureau declined for 13 straight months on a 3MMA basis from September 2018 through October 2019 when it reached negative 2.3 percent. There was a slight improvement to negative 2.2 percent in November, which yielded a green arrow in Figure 1 (Figure 5).
New Orders for Products Manufactured from Iron and Steel
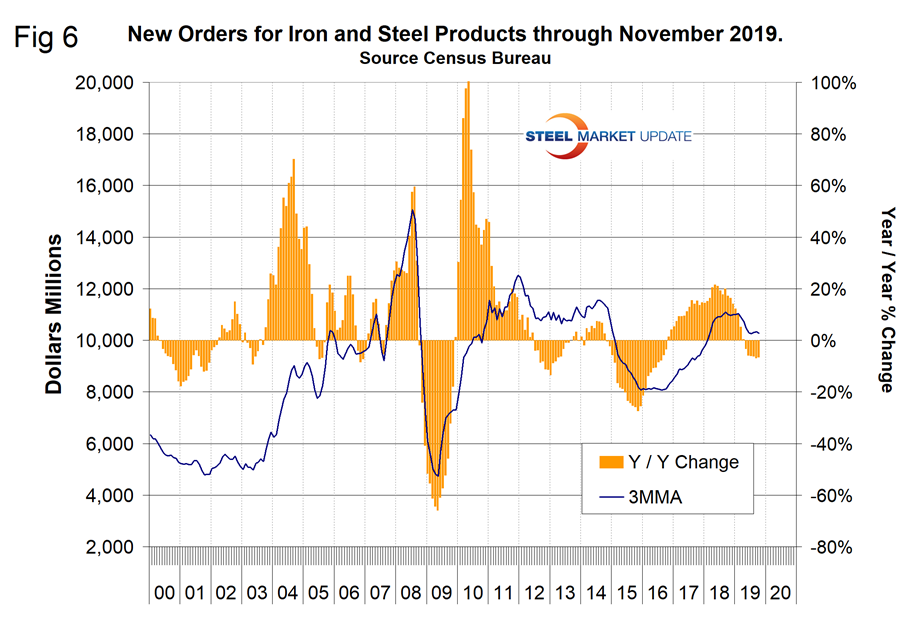
Within the Census Bureau M3 manufacturing survey is a subsection for iron and steel products. Figure 6 shows the history of new orders for iron and steel products since January 2000. The year-over-year growth rate was negative 8.1 percent in November, which was down from negative 6.8 percent in the October data.
Inventories of Products Manufactured from Iron and Steel
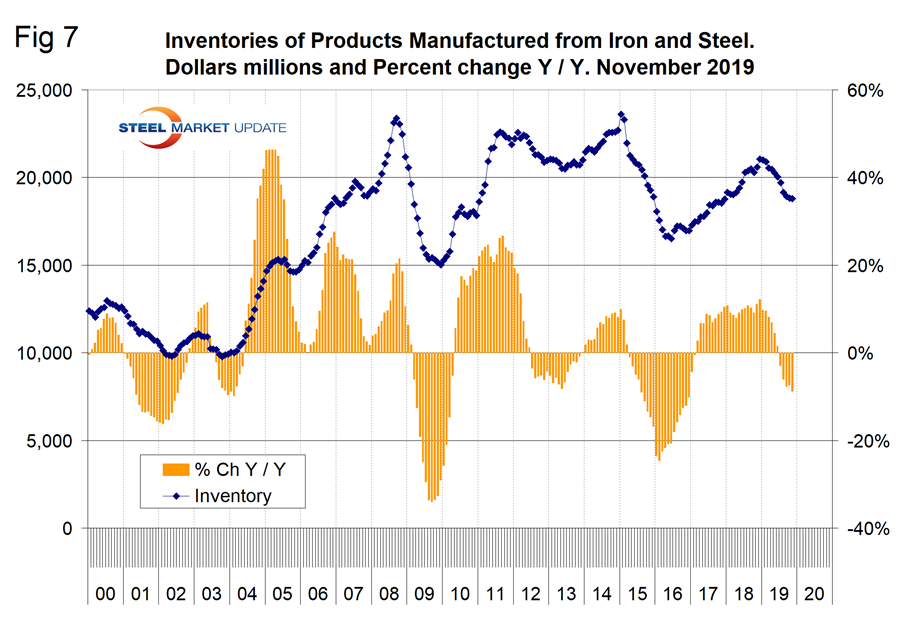
The only indicator showing a year-over-year improvement in this whole report is inventories of iron and steel products, which declined by more than new orders. Therefore, we rated this indicator as positive with a positive direction in Figure 1. Year-over-year inventories of iron and steel products in the supply chain grew by 12.0 percent in December 2018, then declined every month through November 2019 when the growth rate was negative 8.8 percent (Figure 7).
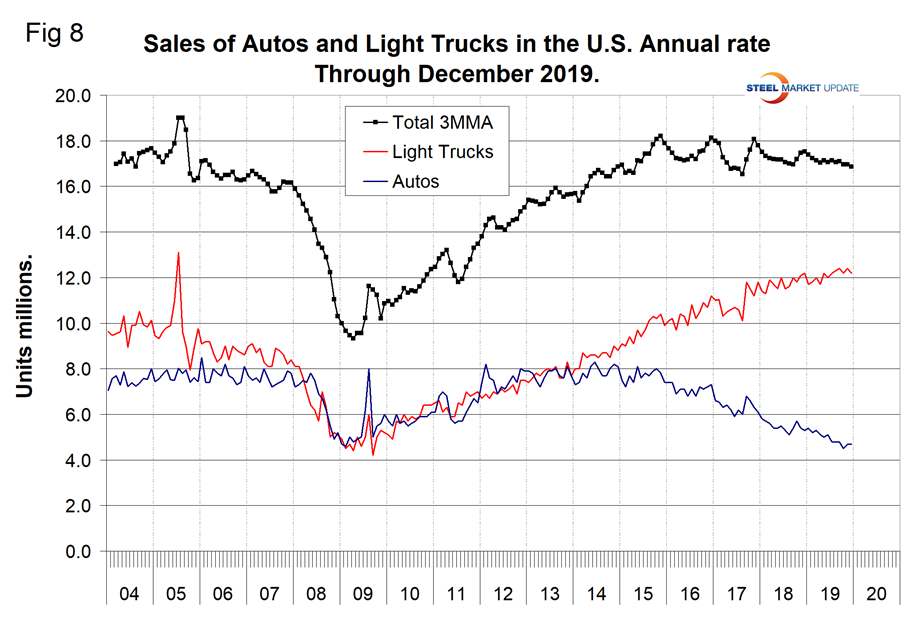
Light Vehicle Sales in the U.S
Year over year on a 3MMA basis, light vehicle sales were down by 3.8 percent in December when sales totaled 16.9 million units annualized and were comprised of 72.2 percent light trucks and 27.8 percent autos. Light vehicle sales have trended down slightly in the last three years as measured by the cyclical peaks. The declining sales in the car sector in the last three years has resulted in GM closing several small car plants. The light truck category includes SUVs and crossovers. Overall, sales are still higher than the pre-recession level of 2007 (Figure 8). Import market share in December was 21.9 percent, which is at the bottom of the range for the last two years.
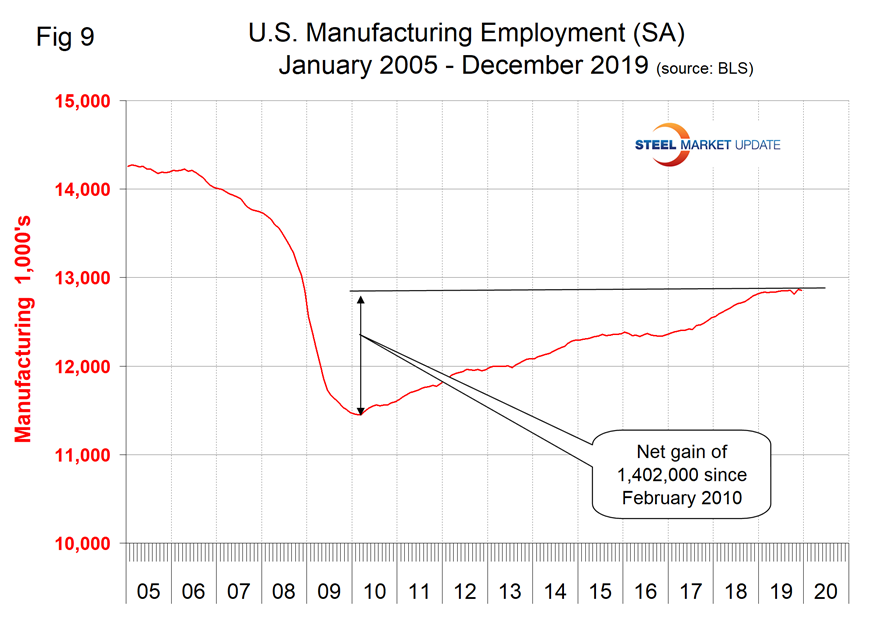
Manufacturing Employment
Manufacturing employment plummeted during the recession and gradually improved from the spring of 2010 through 2014. Growth was flat in 2015 and declined slightly in 2016 when 23,000 jobs were lost during the year as a whole. There was a turnaround in 2017, and 264,000 jobs were created in the 12 months of 2018. The number of manufacturing jobs created in 2019 was 46,000. Only 1,000 manufacturing jobs were created in the fourth quarter when losses due to the GM strike in October were recouped in November (Figure 9).
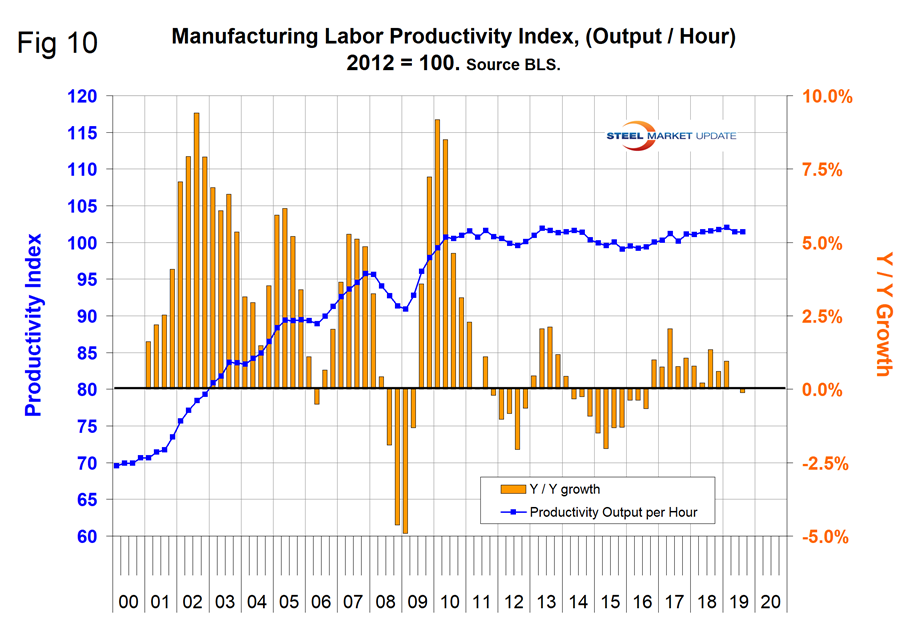
Manufacturing Productivity
The Bureau of Labor Statistics reported that in Q3 2019 manufacturing productivity declined by 0.1 percent, down from an average of positive 0.74 percent in the four quarters of 2018 (Figure 10).
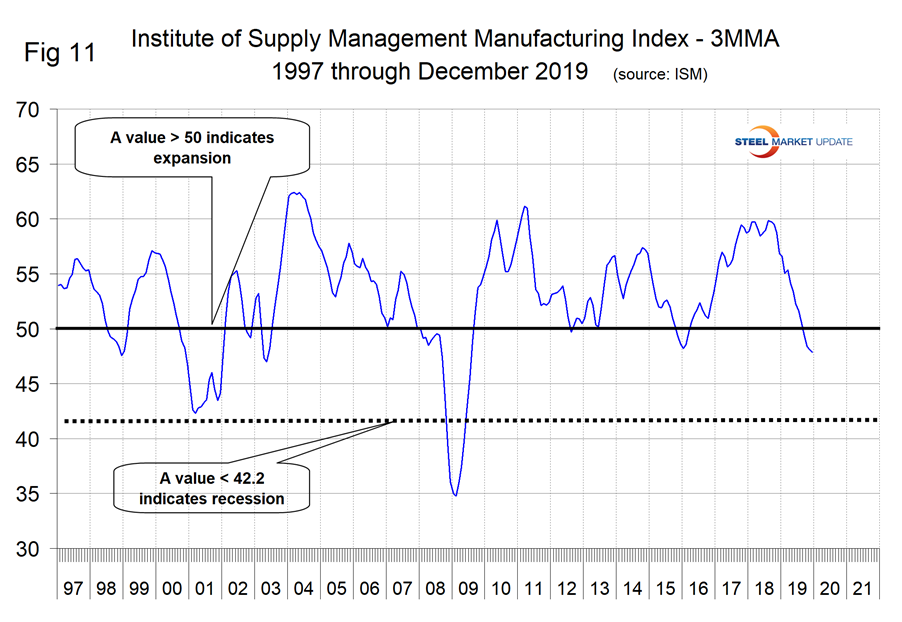
The ISM Manufacturing Index
The Institute for Supply Management’s Manufacturing Index is a diffusion index. ISM states: “Diffusion indexes have the properties of leading indicators and are convenient summary measures showing the prevailing direction of change and the scope of change. An index value above 50 indicates that the manufacturing economy is generally expanding; below 50 indicates the opposite.”
Figure 11 shows the 3MMA of the ISM index from January 1997 through December 2019. The index surged from January 2016 through October 2017, leveled off through October 2018 and has declined since then. The index had a value of 47.2 in December with a 3MMA of 47.87. The 3MMA was down by 9.0 points year over year, which was a slight improvement from October when it was down by 11.13 points. August 2019 was the first month for the 3MMA of the index to be below 50 since March 2016.