

Market Data
February 17, 2020
SMU Energy Analysis for February
Written by Peter Wright
Steel Market Update is pleased to share this Premium content with Executive-level members. For more information on how to upgrade to a Premium-level subscription, email Info@SteelMarketUpdate.com.
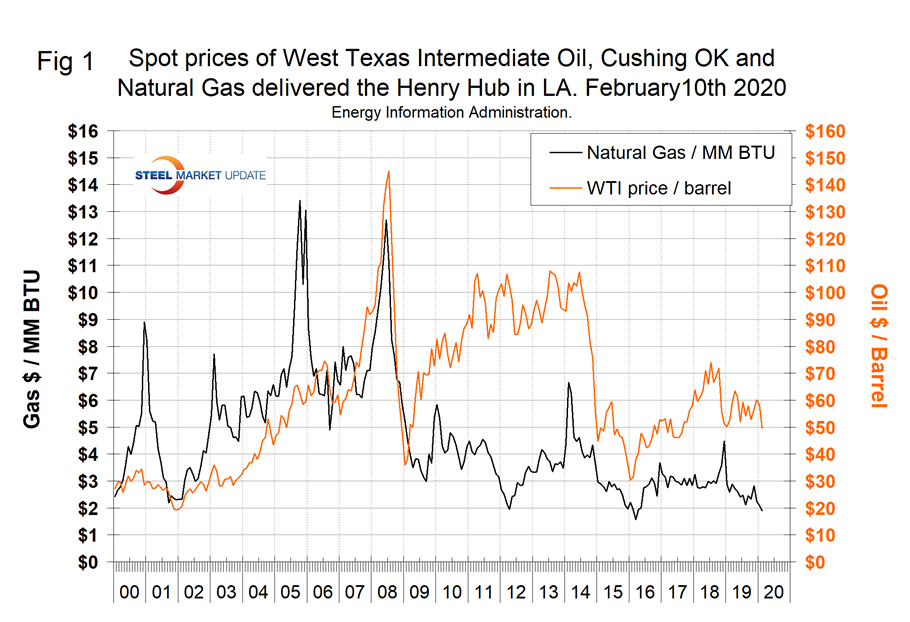
Oil and gas prices declined from our previous update. The spot price of West Texas Intermediate (WTI) FOB Cushing, Okla., was $49.59 on Feb. 10, down from $58.17/ barrel in our last report on Jan. 14. The price of natural gas fell below $2.00/MM BTU in February for the first time since April 2016.
![]()
The prices of oil and natural gas drive the consumption of energy-related steel products including oil country tubular goods, pipe fittings and well head equipment, among others. Welded tubular goods (not including OCTG) consumed about 5.5 million tons of hot rolled sheet in 2018.
On Feb. 15, Andrew Hecht, a commodities specialist, wrote: “On Jan. 8, 2020, the price of nearby NYMEX crude oil futures ran out of steam on the upside at $65.65 per barrel. The high was just 95 cents below the peak price from 2019. Even though the “phase one” trade deal between the U.S. and China appeared to boost optimism over Chinese economic growth, the price began to fall, and the decline turned into a collapse. A combination of rising inventories in the U.S., calm in the Middle East, and the outbreak of coronavirus created a potent bearish cocktail for the price of the energy commodity. After falling to the bottom end of a trading range that had been in place since the early days of 2019, crude oil fell through the $50 per barrel level on NYMEX futures for the first time in over a year in early February. While the most recent low has been at $49.31, the trend remained bearish at the end of last week even though the price bounced to the $52 level last Friday.”
Figure 1 shows historical oil and gas prices on a mid-month basis from January 2000 through Feb. 10, 2020. On that date, WTI was priced at $49.59 and Brent at $53.39 per barrel (see note at the end of this piece). Our price and inventory data come from the EIA (Energy Information Administration). On Feb 7, natural gas at the Henry Hub in Oklahoma was priced at $1.89 per MMBTU (million British Thermal Units.), down from $2.81 on Nov. 8. Natural gas is priced to continue making inroads against coal as an electric power generator, which is the primary consumer of natural gas in the United States.
On Jan. 29, the U.S. Energy Information Administration released its Annual Energy Outlook 2020 through 2050. Key takeaways were:
- In the (AEO2020) Reference case, U.S. energy consumption grows more slowly than gross domestic product throughout the projection period (2050) as U.S. energy efficiency continues to increase. This decline in the energy intensity of the U.S. economy continues through 2050.
- The electricity generation mix continues to experience a rapid rate of change, with renewables the fastest-growing source of electricity generation through 2050 because of continuing declines in the capital costs for solar and wind that are supported by federal tax credits and higher state-level renewables targets. With slow load growth and increasing electricity production from renewables, U.S. coal-fired and nuclear electricity generation declines; most of the decline occurs by the mid-2020s.
- The United States continues to produce historically high levels of crude oil and natural gas. Slow growth in domestic consumption of these fuels leads to increasing exports of crude oil, petroleum products, and liquefied natural gas.
- After falling during the first half of the projection period, total U.S. energy-related carbon dioxide emissions resume modest growth in the 2030s, driven largely by increases in energy demand in the transportation and industrial sectors; however, by 2050, they remain 4 percent lower than 2019 levels.
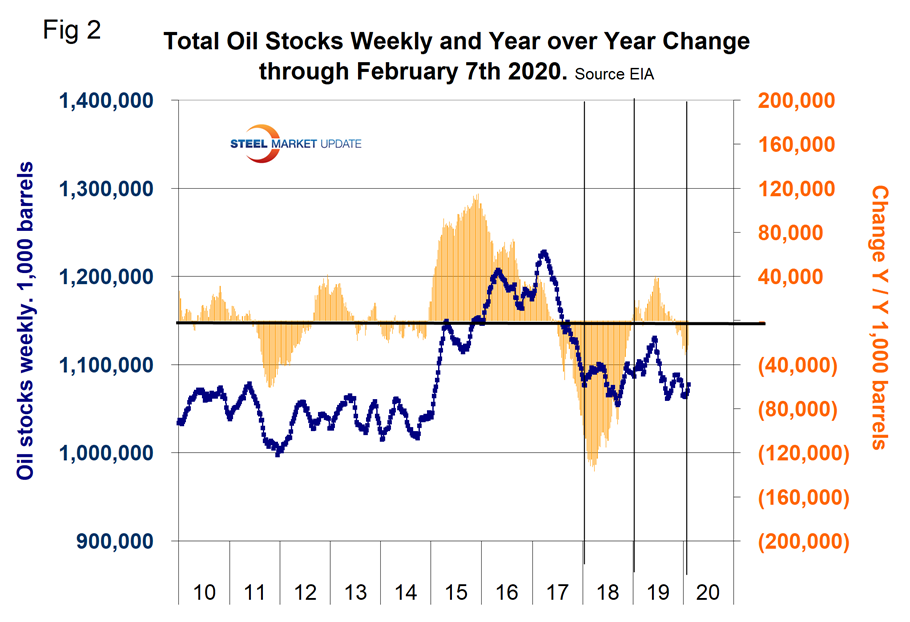
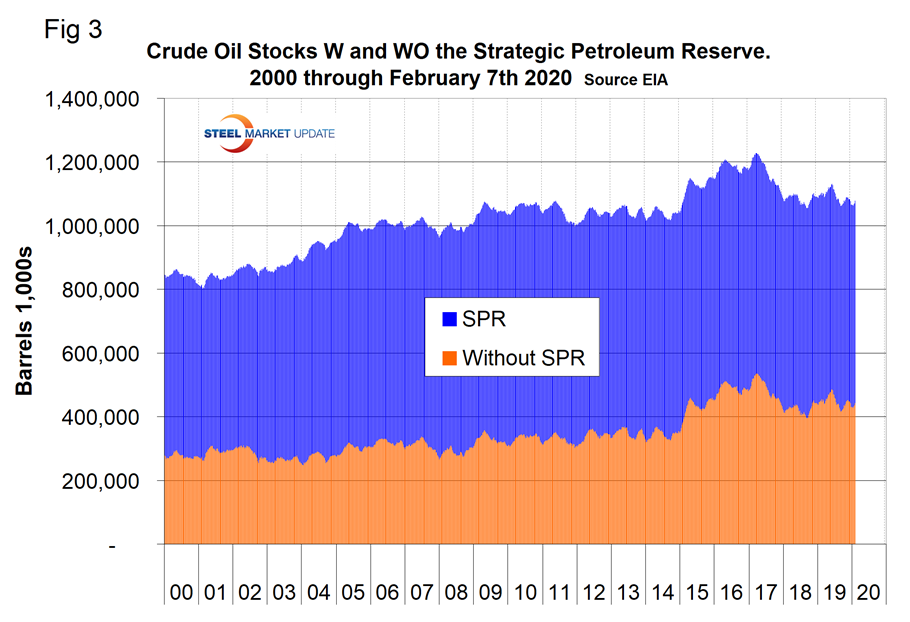
On Feb. 7, the EIA reported that U.S. commercial crude oil inventories (excluding those in the SPR (Strategic Petroleum Reserve) decreased by 4.8 million barrels since the end of November, which is insignificant as a proportion of the more than one billion barrels available. Including the SPR, total inventory on Feb. 7 was 1.08 billion barrels. Figure 2 shows the inventory level, including the SPR and the year-over-year change. Figure 3 breaks total crude inventory into the working portion and the strategic reserve.
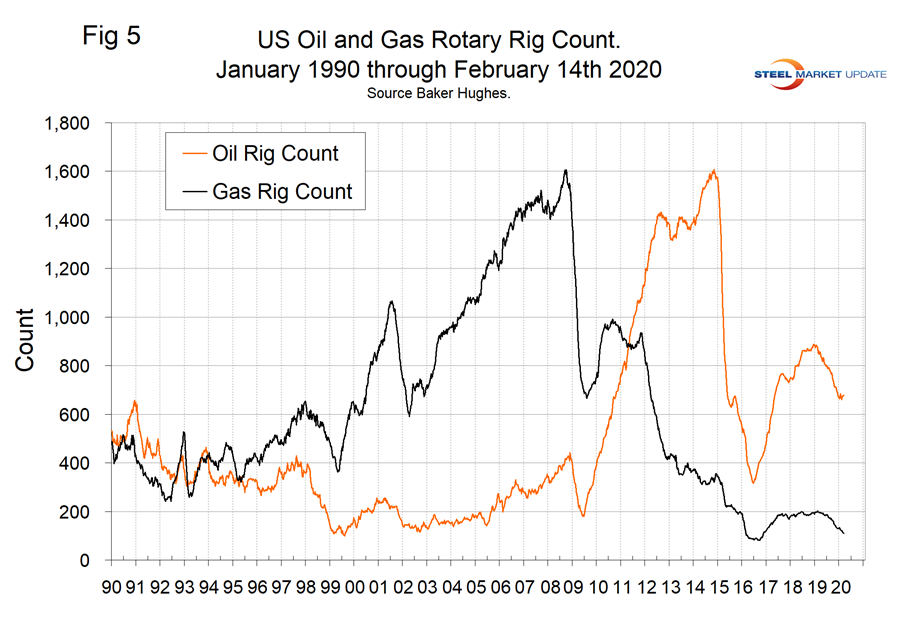
The total number of operating rigs in the U.S. on Feb. 14 was 790, which was unchanged for three weeks but down from 1,083 in the last week of 2018. Oil rigs were down by 207 and gas by 88. Figure 4 shows the total number of operating rigs in the U.S. and the weekly change.
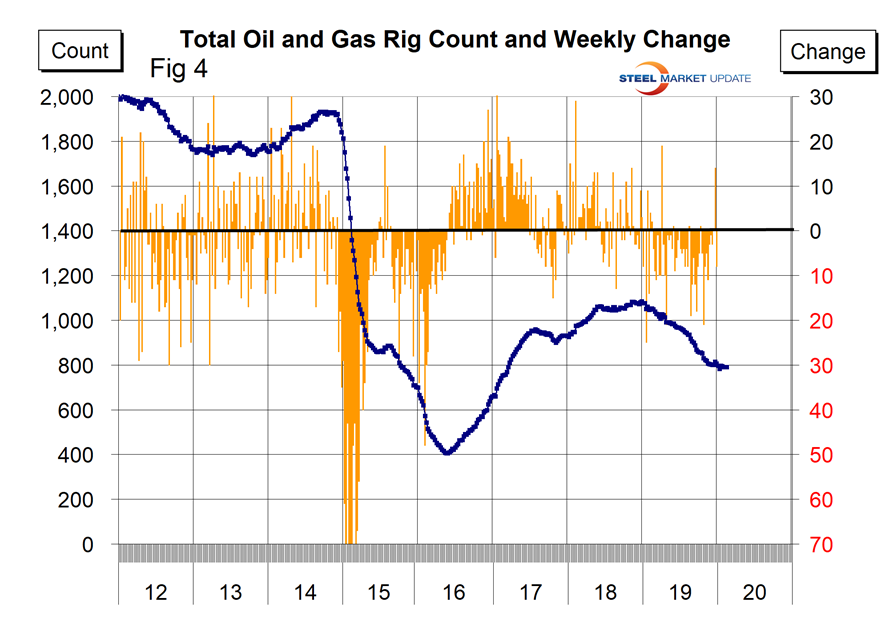
The oil rig count had a low point of 316 on June 27, 2016, and stood at 678 on Feb. 14, 2020.
The U.S. gas rig count rose from its low point of 81 on Aug. 5, 2016, to 202 on Jan. 11, 2019, before falling back to 110 on Feb. 7, 2020. The year-over-year growth rate of total U.S. operating rigs was negative 24.8 percent in the latest data with oil down by 20.9 percent and gas down by 43.3 percent. Figure 5 shows the Baker Hughes U.S. Rotary Rig Counts for oil and gas equipment in the U.S. (explanation below).
On a regional basis in the U.S., the big three states for operating rigs are Texas, Oklahoma and North Dakota. Figure 6 shows the land rig count in those states since 2000.
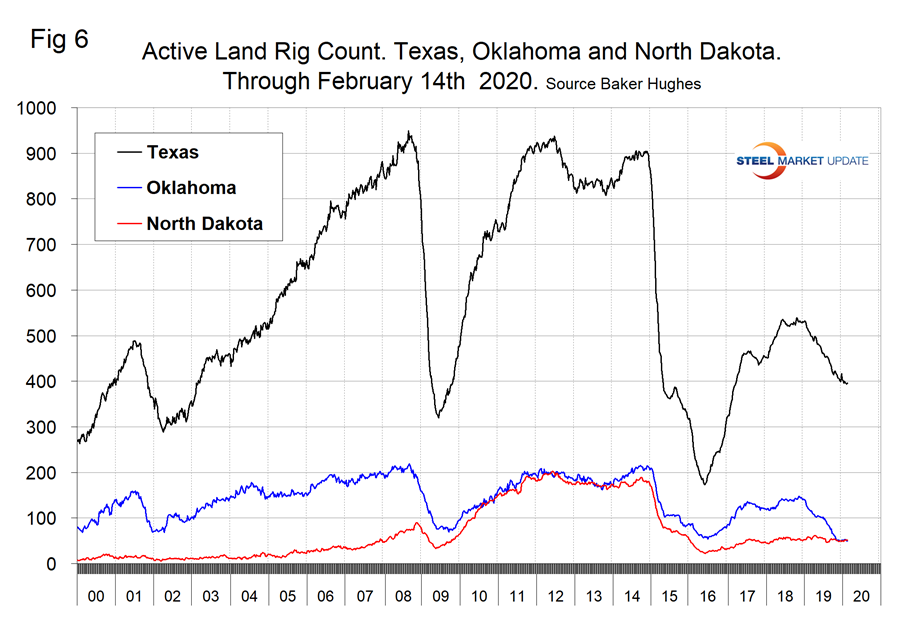
Figure 7 illustrates the monthly U.S. oilfield production of crude from January 1970 through November 2019 (latest data available) in thousands of barrels per month. The historical high was October 1970 at 310.4 million barrels. Production steadily declined to half that level in the late 2000s before the fracking revolution. December 2017 broke the record that had stood for 47 years with 311.2 million barrels produced. October 2019 set another record of 392.3 million barrels, up from 374.5 in September.
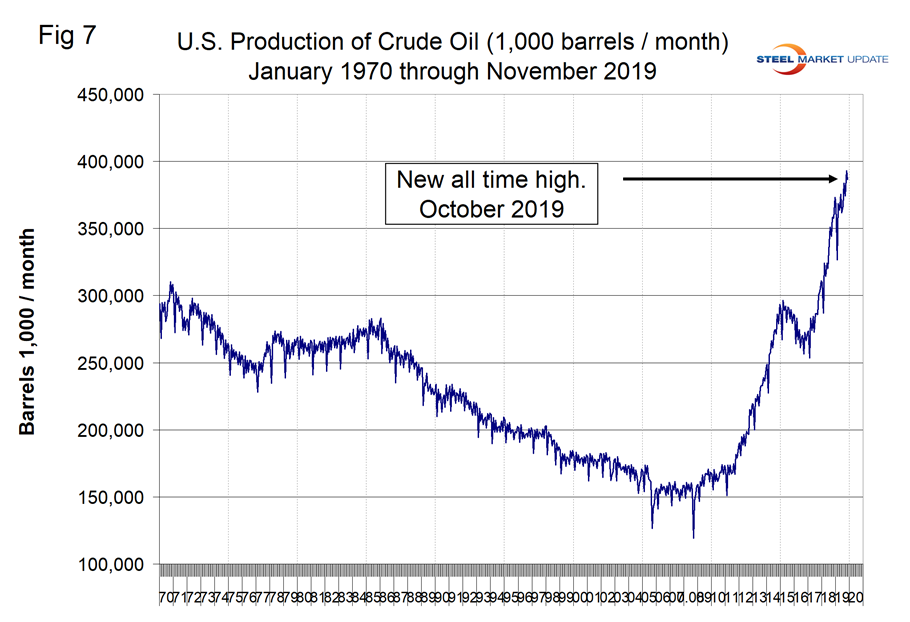
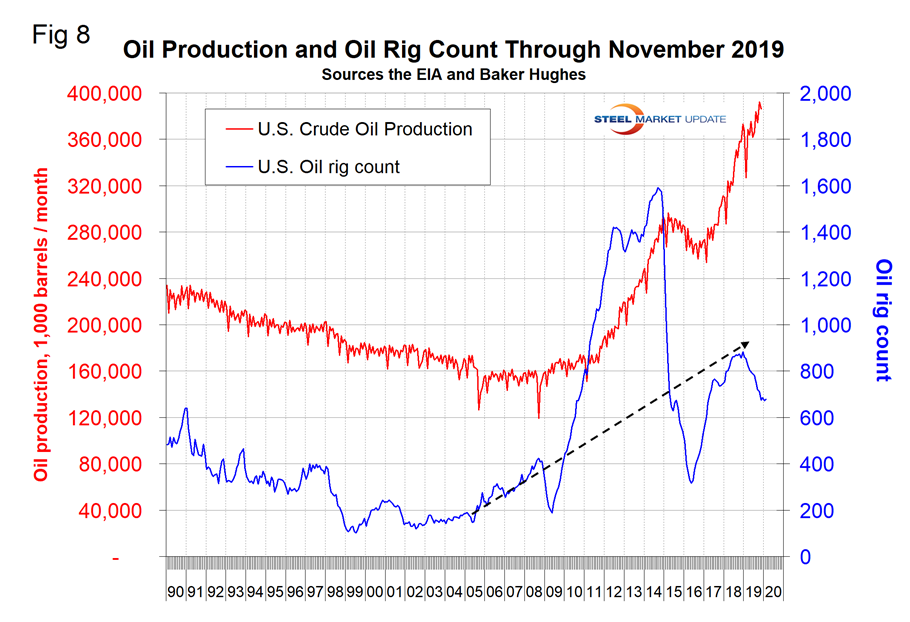
Figure 8 compares oil production and the oil rig count and shows how the increase in exploratory wells drove production from 2009 through late 2014 when the oil price collapsed. Production and rig count moved in opposite directions for all of 2019 as previously drilled and capped wells were put into production.
Notes–Baker Hughes Rotary Rig Count: This is a weekly census of the number of drilling rigs actively exploring for or developing oil or natural gas in the United States. Rigs are considered active from the time they break ground until the time they reach their target depth and may be establishing a new well or sidetracking an existing one. The Baker Hughes Rotary Rig count includes only those rigs that are significant consumers of oilfield services and supplies.
Brent and WTI: Brent and West Texas Intermediate (WTI) are the two most commonly traded contracts of crude oil in the markets. Brent refers to oil that is produced in the Brent oil fields and other sites in the North Sea. Brent is the benchmark for African, European, and Middle Eastern crude oil and is often considered the benchmark targeted by OPEC. WTI crude is sourced from the U.S. and is seen as the benchmark in the Western Hemisphere. Both are light, sweet crude oils, although WTI is generally sweeter and lighter than its European counterpart.


