Market Data
February 17, 2020
Update on Manufacturing Indicators in February
Written by Peter Wright
Based on our analysis of 10 economic indicators, the decline in manufacturing slowed in February’s data.
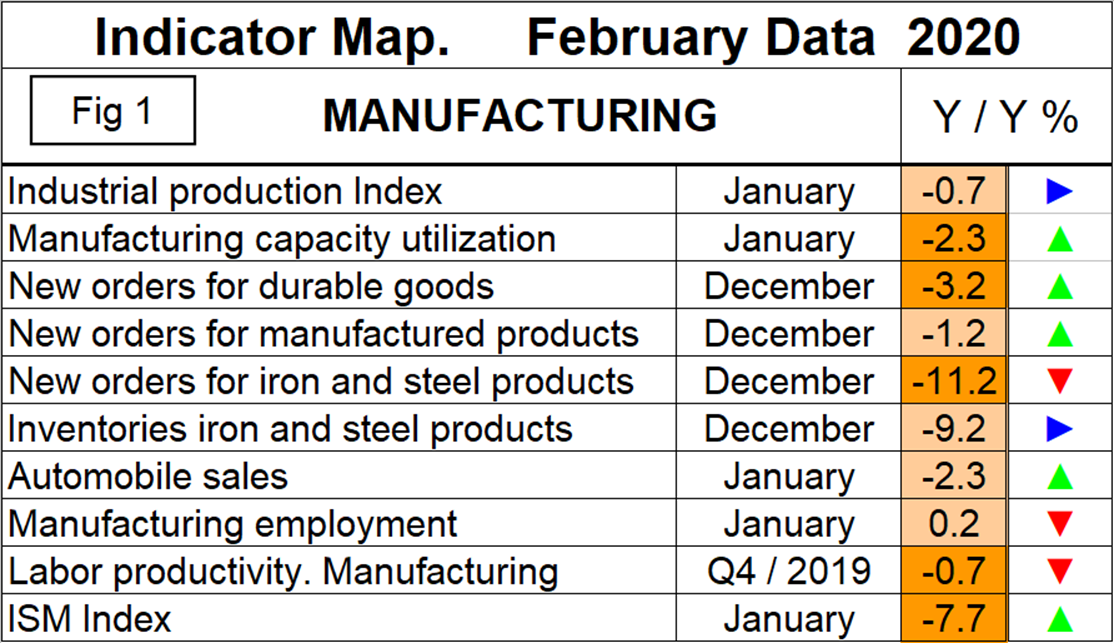
![]() This report summarizes 10 data streams that describe the state of U.S. manufacturing in general and the steel industry in particular. We have reported on most of these separately in our Steel Market Update publications, and therefore will be brief in this summary. Our intent in summarizing them in one document is to provide a consensus of the state of this critical steel consuming sector. In data released in February, the year-over-year growth rate of nine of the 10 data streams was negative on a 3MMA (three-month moving average) basis and one was positive. Figure 1 is a summary of data received in February and shows the year-over-year percentage change on a 3MMA basis. The summary sheet shows directional arrows comparing February data releases to January’s. Based on American Iron and Steel Institute estimates of steel mill shipments by market classification, almost 50 percent of the steel consumed in the U.S. is manufacturing-oriented. This breaks down to about 27 percent in ground transportation, 9 percent in machinery and equipment, 5 percent in appliances, 4 percent in defense and about 4 percent in containers.
This report summarizes 10 data streams that describe the state of U.S. manufacturing in general and the steel industry in particular. We have reported on most of these separately in our Steel Market Update publications, and therefore will be brief in this summary. Our intent in summarizing them in one document is to provide a consensus of the state of this critical steel consuming sector. In data released in February, the year-over-year growth rate of nine of the 10 data streams was negative on a 3MMA (three-month moving average) basis and one was positive. Figure 1 is a summary of data received in February and shows the year-over-year percentage change on a 3MMA basis. The summary sheet shows directional arrows comparing February data releases to January’s. Based on American Iron and Steel Institute estimates of steel mill shipments by market classification, almost 50 percent of the steel consumed in the U.S. is manufacturing-oriented. This breaks down to about 27 percent in ground transportation, 9 percent in machinery and equipment, 5 percent in appliances, 4 percent in defense and about 4 percent in containers.
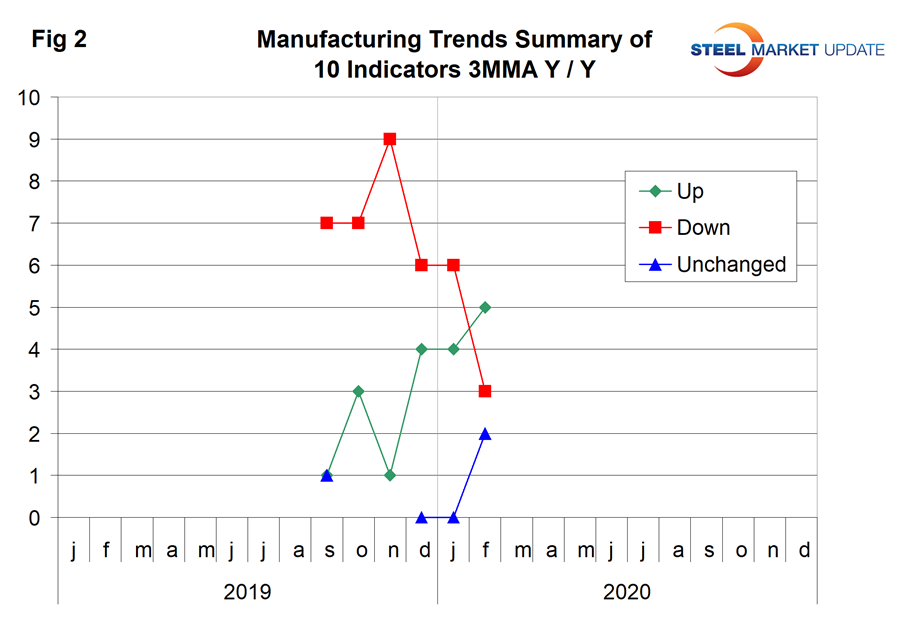
We noticed some good news in this and our previous update, which is that the manufacturing contraction rate of the 10 indicators is slowing. This month we have developed Figure 2 to monitor this change. Because this is a new report and because of the way we store the data, we can’t easily go back before July 2019, but even so the result is quite dramatic. In the February data, five of the data streams were declining more slowly, three were declining faster and two were unchanged. This was an improvement from nine declining faster last November.
The Industrial Production Index
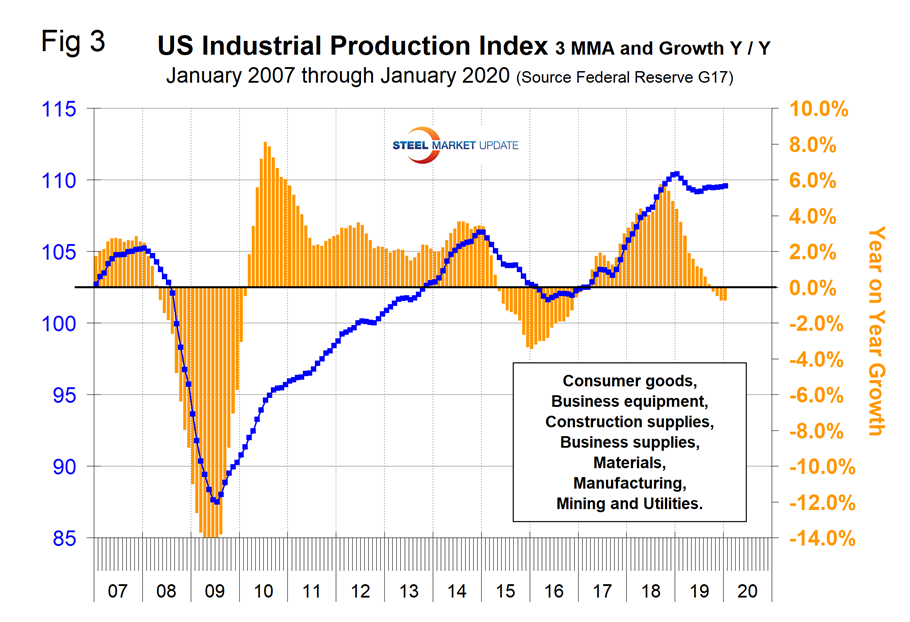
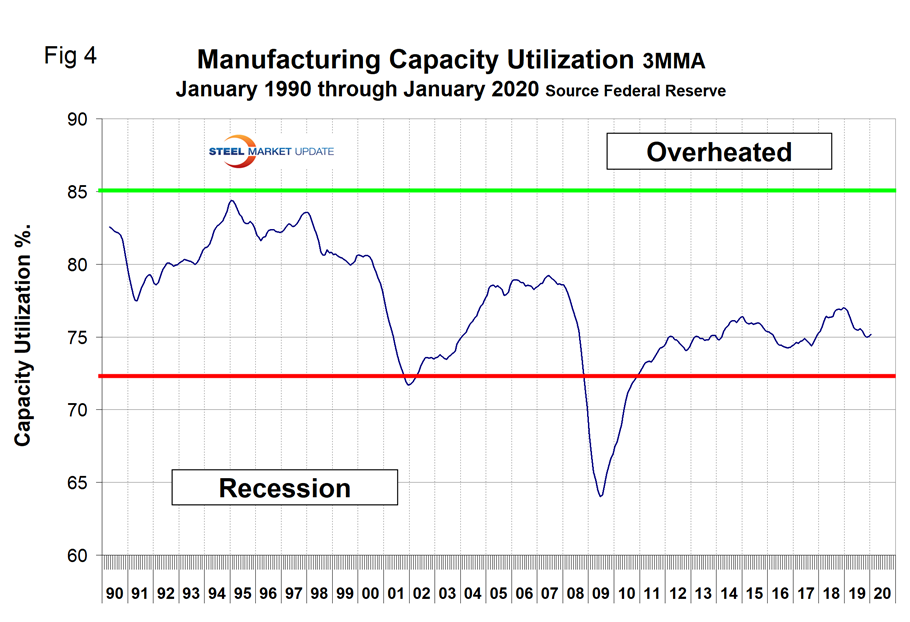
Figure 3 shows the 3MMA of the industrial production (IP) index since January 2007 as the blue line and the year-over-year growth as the brown bars. The IP index is a gauge of output from factories, mines and utilities. Year-over-year the growth of the 3MMA peaked at 5.8 percent in September 2018 and contracted every month through December when it reached negative 0.7 percent. January was unchanged, also at negative 0.7 percent. Manufacturing capacity utilization improved from 74.48 percent in February 2017 to 77.01 percent in December 2018 and had declined in 2019 to 75.02 percent in December with a negative year-over-year growth rate of 2.6 percent on a 3MMA basis. In January the growth rate improved to negative 2.3 percent and a value of 75.18 (Figure 4).
New Orders for Durable Goods (Advance Report)
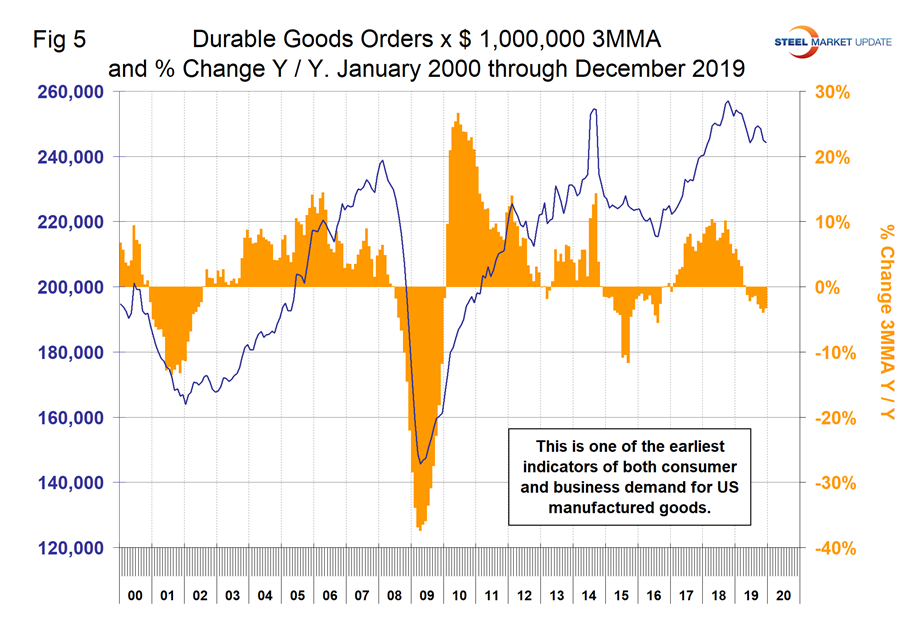
The year-over-year growth rate of durable goods reached 10.1 percent in September 2018 and then had declined to negative 4.0 percent in November 2019. There was an improvement to negative 3.2 percent in December. Figure 4 shows the 3MMA since January 2010. This is considered to be one of the earliest indicators of both consumer and business demand for U.S. manufactured goods. Orders picked up in June through August last year, but year over year are still in negative territory.
New Orders for Manufactured Products
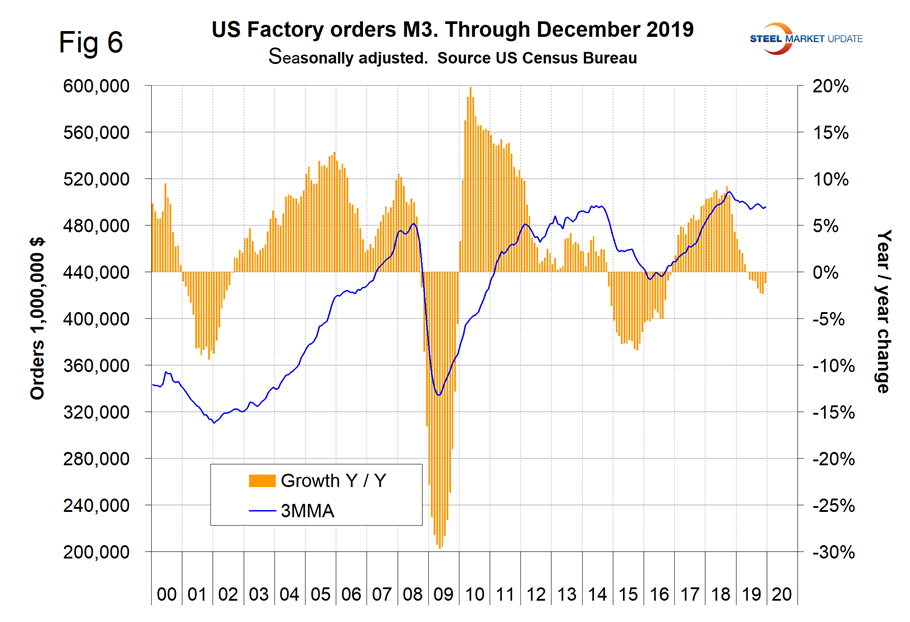
The growth rate of new orders for manufactured products as reported by the Census Bureau declined for 14 straight months on a 3MMA basis from 9.2 percent in September 2018 to negative 2.3 percent in November 2019. There was an improvement to negative 1.2 percent in December, which yielded a green arrow in Figure 1 (Figure 6).
New Orders for Products Manufactured from Iron and Steel
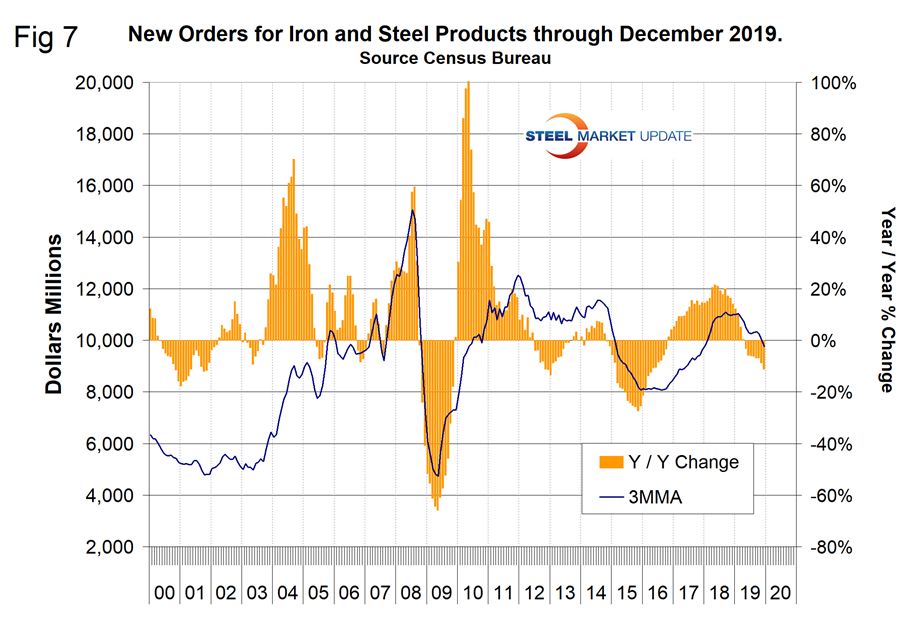
Within the Census Bureau M3 manufacturing survey is a subsection for iron and steel products. Figure 7 shows the history of new orders for iron and steel products since January 2000. The year-over-year growth rate was negative 11.2 percent in December, which was down from positive 21.6 percent in May 2018.
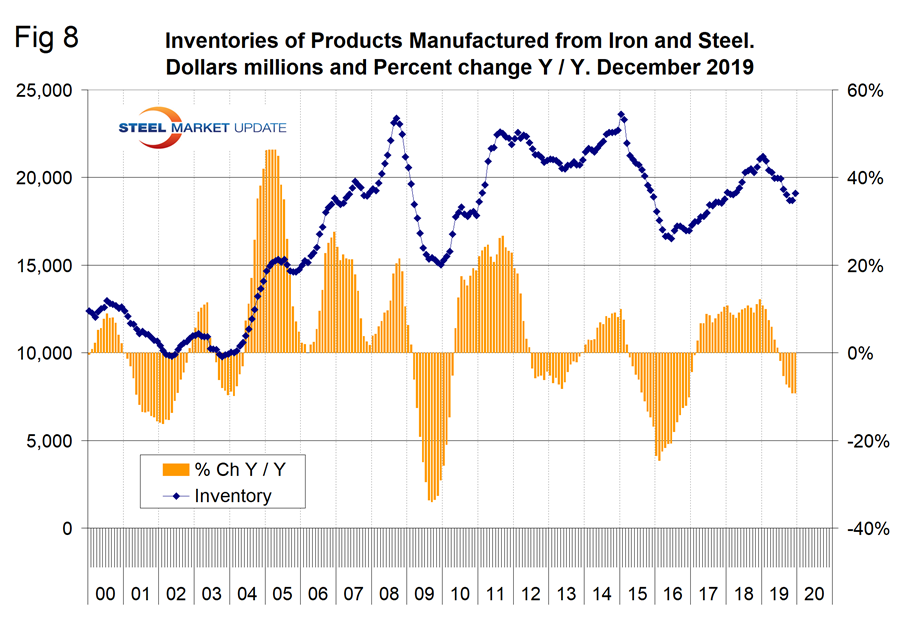
Inventories of Products Manufactured from Iron and Steel
Inventories of iron and steel products declined by less than new orders in December, therefore we rated this indicator as negative. Year over year, inventories of iron and steel products in the supply chain grew by 12.2 percent in December 2018, then the growth rate declined every month through November 2019 when the growth rate was negative 9.2 percent, which was then unchanged in December, yielding a blue arrow in Figure 1 (Figure 8).
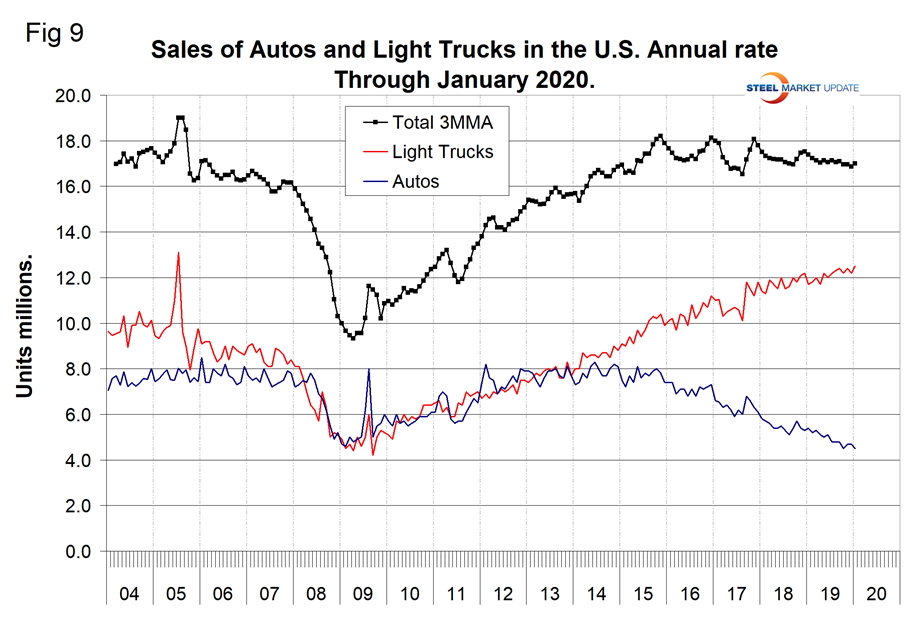
Light Vehicle Sales in the U.S
Year over year on a 3MMA basis, light vehicle sales were down by 2.3 percent in January, which was an improvement from the 3.8 percent decline in December. In January, sales were 17.0 million units annualized and were comprised of 73.5 percent light trucks and 26.5 percent autos. This was the highest proportion of light trucks, which includes crossovers and SUVs, ever. Light vehicle sales have trended down slightly in the last three years as measured by the cyclical peaks. Overall, sales are still higher than the pre-recession level of 2007 (Figure 9). Import market share in December was 21.8 percent, which was at the bottom of the range for the last two years.
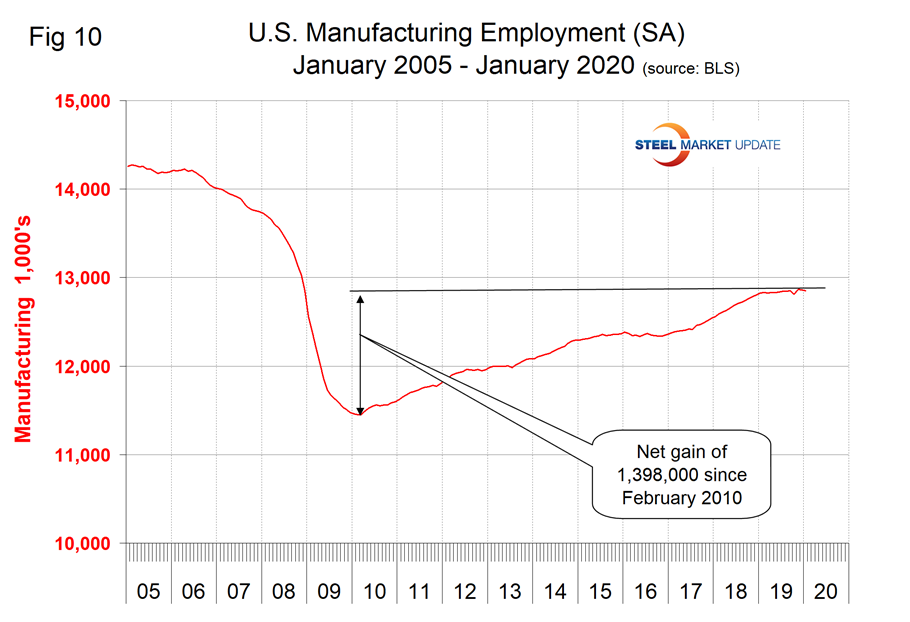
Manufacturing Employment
Manufacturing employment plummeted during the recession and gradually improved from the spring of 2010 through 2014. Growth was flat in 2015 and declined slightly in 2016 when 23,000 jobs were lost during the year as a whole. There was a turnaround in 2017, and 264,000 jobs were created in the 12 months of 2018. The number of manufacturing jobs created in 2019 was 58,000 and in January 2020, 12,000 jobs were lost (Figure 10).
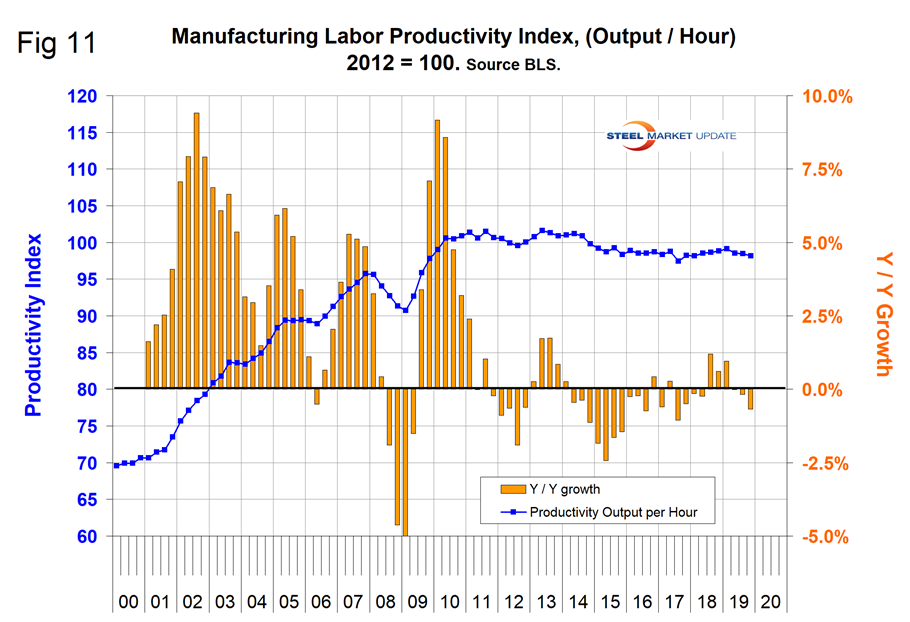
Manufacturing Productivity
The Bureau of Labor Statistics reported that in Q4 2019 manufacturing productivity declined by 0.7 percent, down from an average of positive 0.74 percent in the four quarters of 2018 (Figure 11). Productivity is lower than it was in 2013 and has been treading water for the last five years.
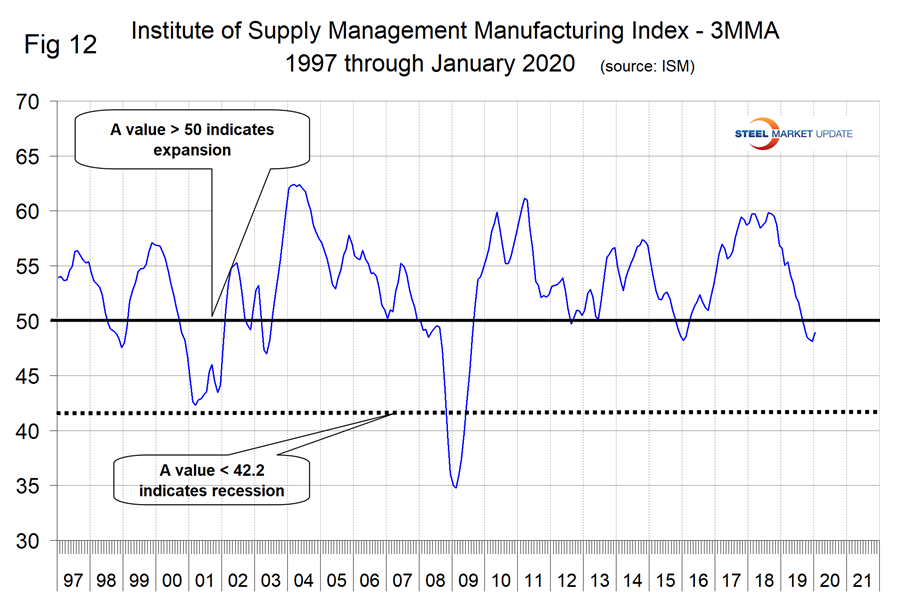
The ISM Manufacturing Index
The Institute for Supply Management’s Manufacturing Index is a diffusion index. ISM states: “Diffusion indexes have the properties of leading indicators and are convenient summary measures showing the prevailing direction of change and the scope of change. An index value above 50 indicates that the manufacturing economy is generally expanding; below 50 indicates the opposite.” Figure 12 shows the 3MMA of the ISM index from January 1997 through January 2020. The index surged from February 2016 through October 2017, leveled off through October 2018 and has declined through December 2019. There was a welcome surge in January 2020 when the index rose to 50.9 from 47.8 on December. The 3MMA was down by 7.7 points year over year, which was a slight improvement from October when it was down by 11.03 points. September 2019 was the first month for the 3MMA of the index to be below 50 since March 2016. On Feb. 20, Michael Gayed of the Lead Lag report wrote: “On Feb. 3, we finally received some welcome news from the manufacturing sector, when the Institute for Supply Management (ISM) released its January Manufacturing Report for the U.S. saying that the number bounced would be an understatement. Manufacturing rebounded to a 50.9, now into expansionary territory. As I noted on the Lead-Lag report last week, this was one of the few recessionary signals that has now reversed into expansionary, much like the yield curve inversion did in 2019. The 3.7 increase off December’s small number was one of the most substantial bounces in the last 20 years and was the largest bounce since May 2009. Expectations for this month’s report were for a 48.5 reading, so to see the number come well above into expansionary growth was excellent. Remember, we just had a five-month stretch from July to December with contractionary readings, so economists in the U.S. are breathing a sigh of relief. If we can sustain growth in the manufacturing sector to complement the already steady and robust consumer sector, not much could stop this U.S. expansion anytime soon. Especially if the Federal Reserve stays at our back and follows through without any interest hikes in 2020 (they have maintained a preference to keep rates steady, and I think they are leaning towards another insurance rate cut, if anything).”