Analysis

February 26, 2020
North American Auto Assemblies Continued to Contract in 2019
Written by Peter Wright
This report is based on data from LMC Automotive for automotive assemblies in the U.S., Canada and Mexico. The breakdown of assemblies is “Personal” (cars for personal use) and “Commercial” (light vehicles less than 6.0 tonnes gross vehicle weight rating, heavy trucks and buses are not included). In this report we will briefly describe light vehicle sales in the U.S. before reporting in detail on assemblies in the three regions of North America.
U.S. Vehicle Sales
Economy.com summarized January’s vehicle sales as follows: “U.S. vehicle sales started 2020 on a strong note by increasing to 17 million seasonally adjusted annualized units. Light-truck and SUV sales were responsible for the increased sales, jumping by 3.1%, or 383,000 annualized units, to 12.5 million annualized units. Car sales were down 5.1% to 4.5 million annualized units. January vehicle sales were 1.9% above those in January 2019 and 1.8% above expectations. Still, our forecast has new-vehicle sales in 2020 slowing to under 17 million units for the first time in five years. Risks to the upside remain, as the resiliency of the U.S. consumer has powered new-auto sales above expectations for two consecutive years.”
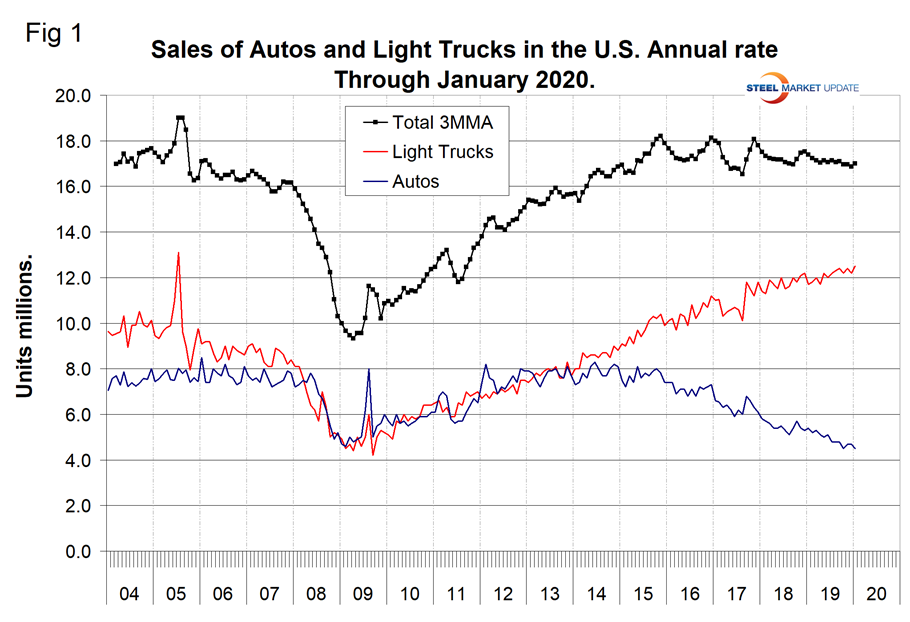
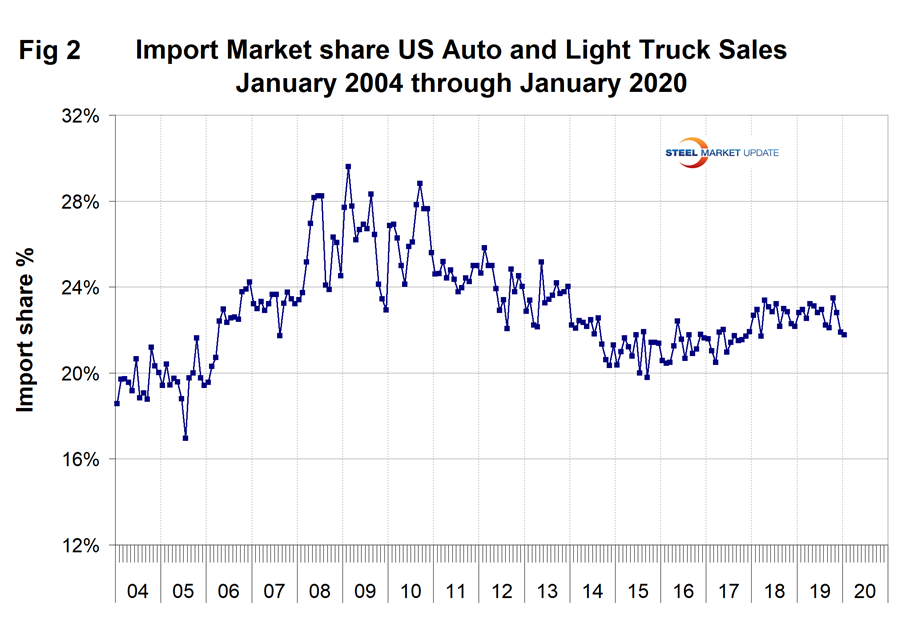
Figure 1 shows auto and light truck sales since January 2004. In January 2020, total sales were down by 2.3 percent on a three-month moving average (3MMA) basis year over year. Light trucks that include pickups, SUVs and crossovers have been surging at the expense of cars for four years. In January, the mix was 73.5 percent light trucks and 26.5 percent autos. This was the highest proportion ever for light trucks, and there is no sign of the trend slowing. In 2019, import market share had a high of 23.5 percent in October and declined to 21.8 percent in January 2020 as shown in Figure 2.
North American Assemblies
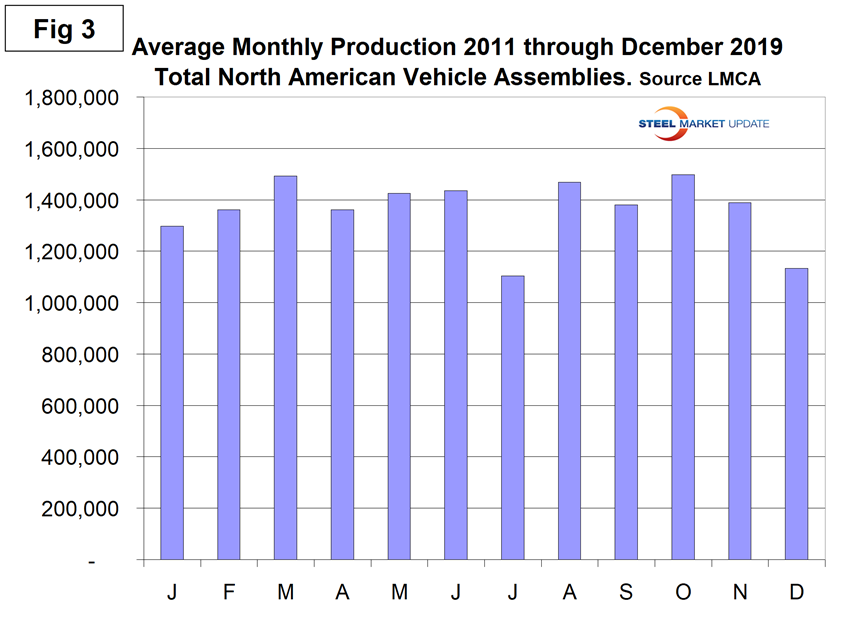
Total light vehicle (LV) production in North America in December was at an annual rate of 13.2 million units, down from 17.2 million in November. On average since 2007, December’s production has been down by 18.5 percent from November. This year production was up by 23.5 percent, therefore worse than normal. Figure 3 illustrates the seasonality of production on average since January 2011. On a rolling 12-months basis, total North American assemblies were down by 3.8 percent year over year through December. Note that production numbers are not seasonally adjusted; the sales data reported above are seasonally adjusted.
There has been a gradual slowdown in production since December 2017, which prior to the GM strike had almost stabilized as indicated by the brown bars in Figure 4.
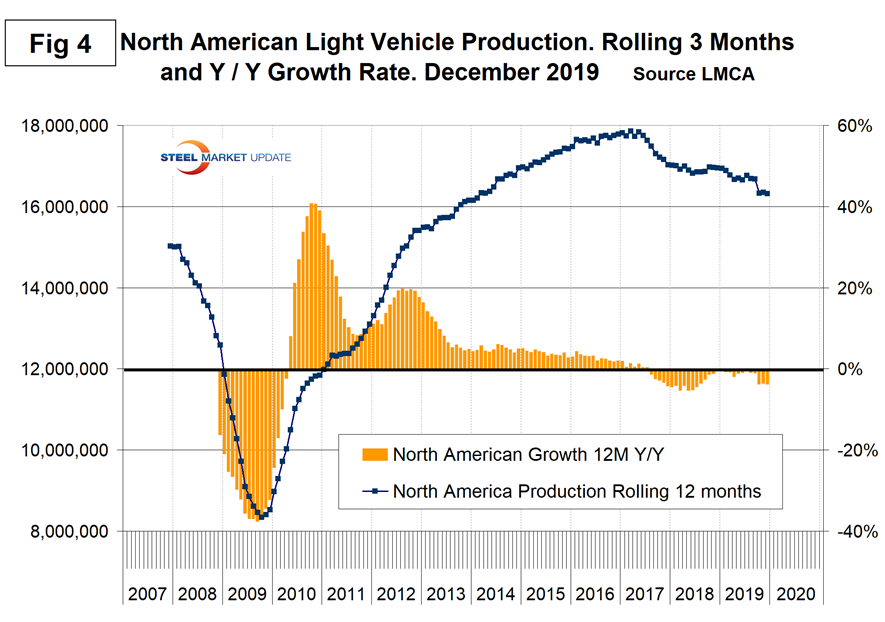
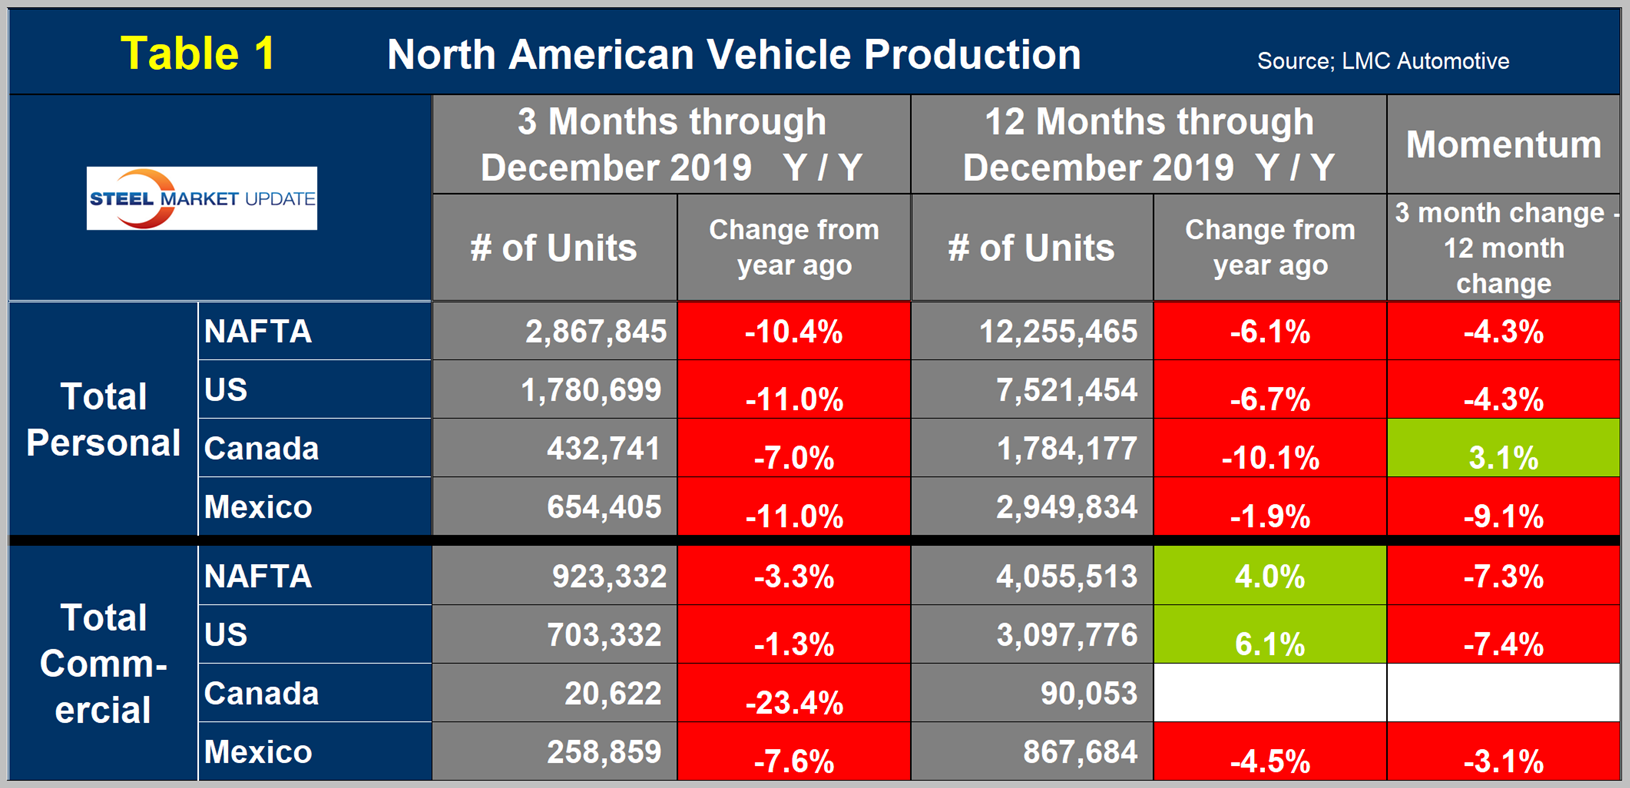
Table 1 is a short-term snapshot of assembly by nation and vehicle type. It breaks down total North American personal and commercial vehicle production into the U.S, Canada and Mexican components and the three- and 12-month growth rate for each. At the far right it shows the momentum for the total and for each of the three nations. In three months through December, assemblies of both personal and commercial vehicles were down in all three nations. Commercial assemblies were up in the U.S. in 12 months year over year, which put NAFTA as a whole in the green. Note, there are blank cells for Canadian commercial production in Table 1. See explanation below.
The longer-term picture is shown in the following charts by vehicle type and nation. Figure 5 shows the total personal vehicle production for North America and the total for each nation.
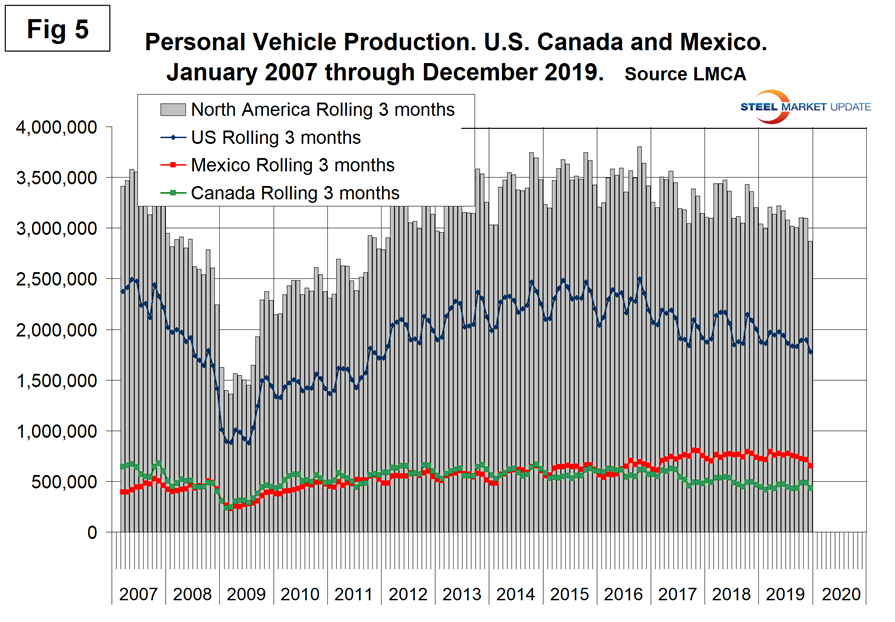
Figures 6, 7 and 8 show the production of personal vehicles by nation and the year-over-year growth rate for each. Figure 9 shows the production share for each nation. Production in the U.S. has been declining since 2016 and in Canada since 2017. Mexican production has been erratic but making no progress since the end of 2017. The U.S. share rose for five months through December to 62.1 percent as Mexico’s share fell for five months to 22.8 percent.
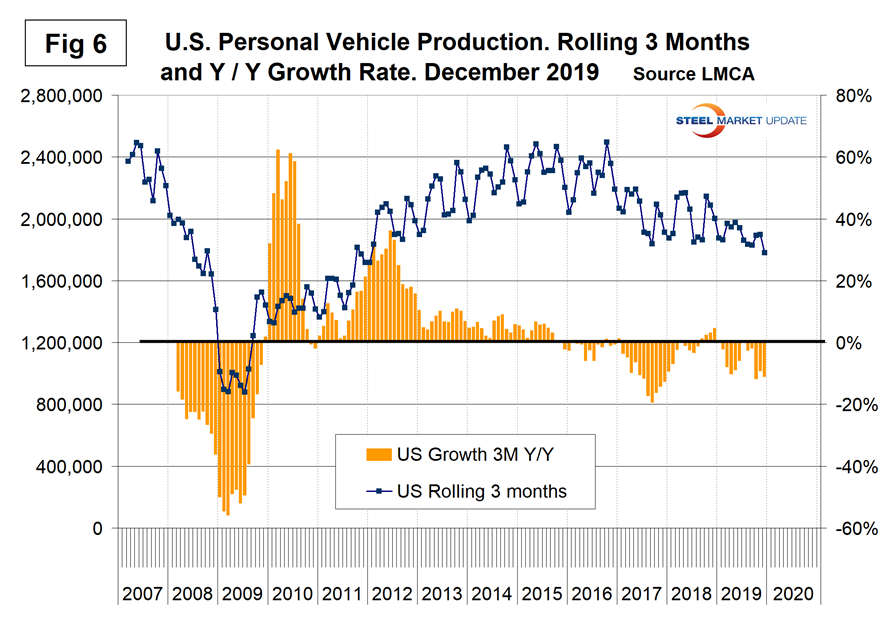
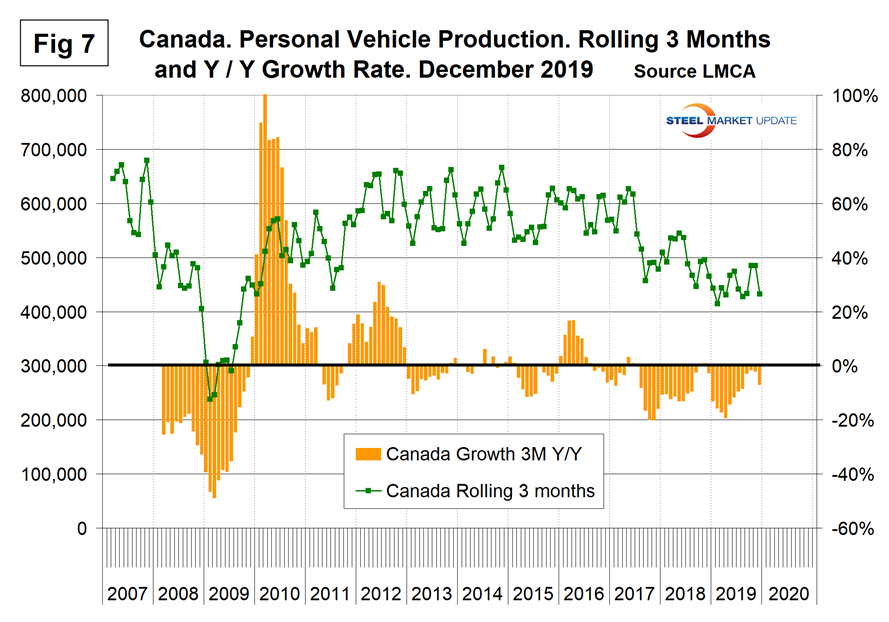
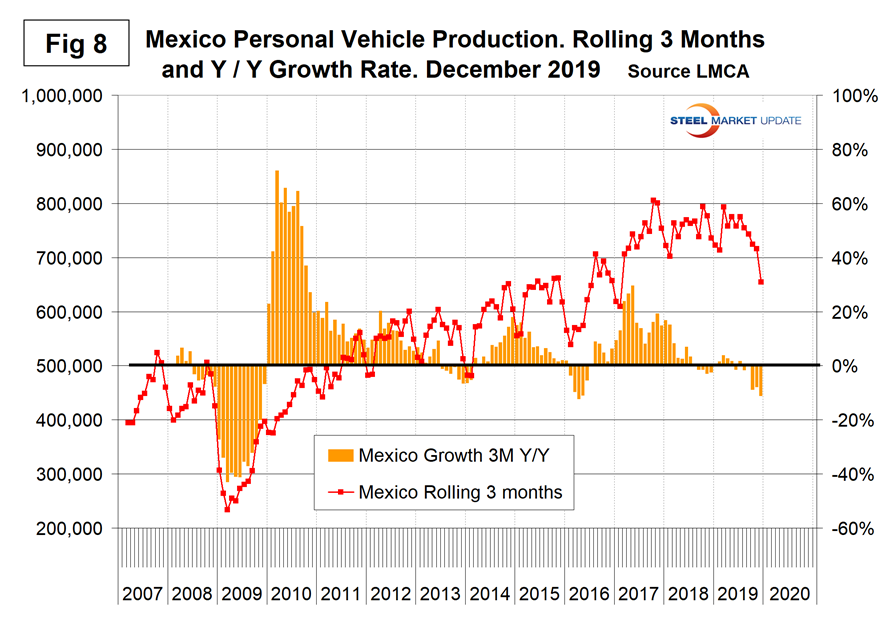
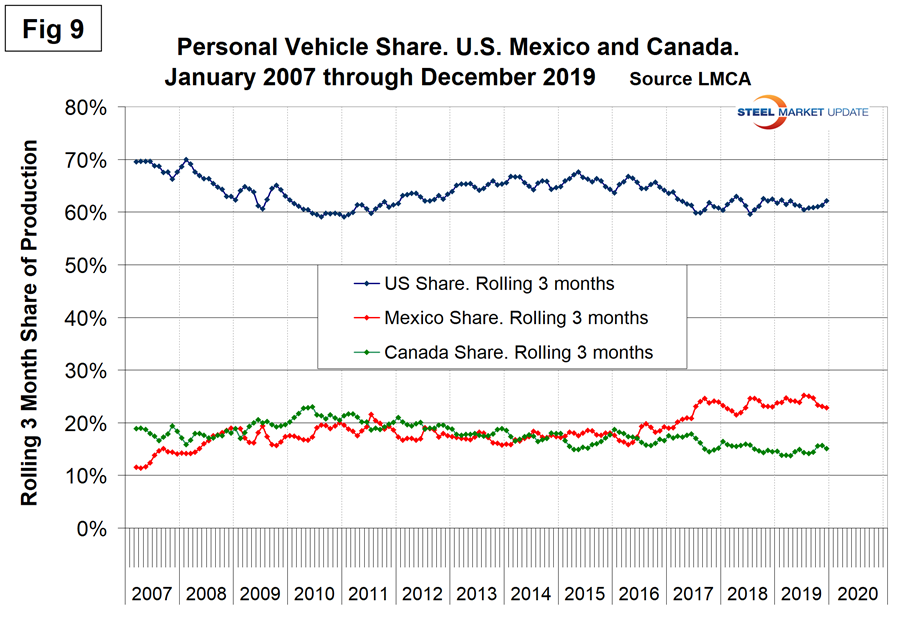
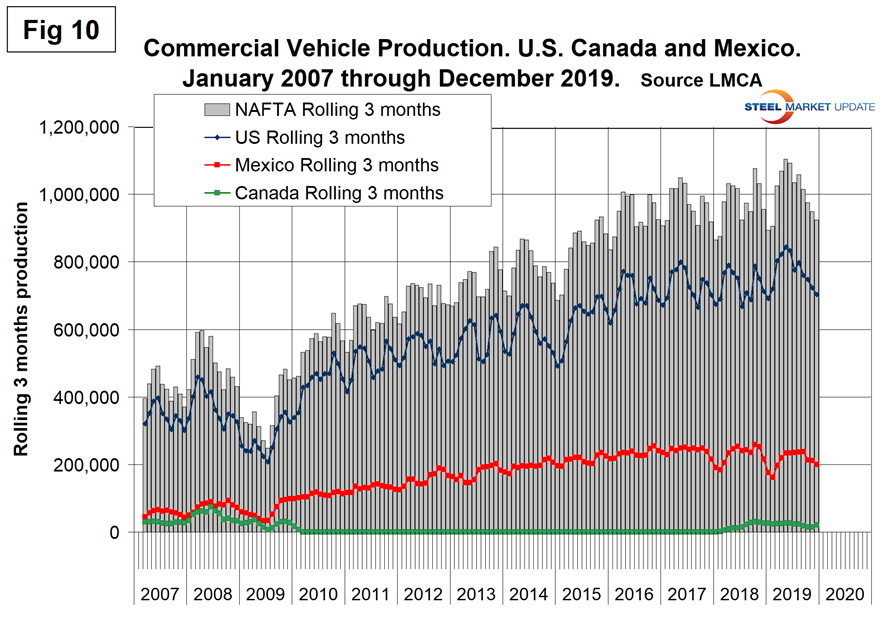
Figure 10 shows the total commercial vehicle production for North America and the total for each nation. The U.S. has held its ground much better in commercial vehicles than in the personal segment.
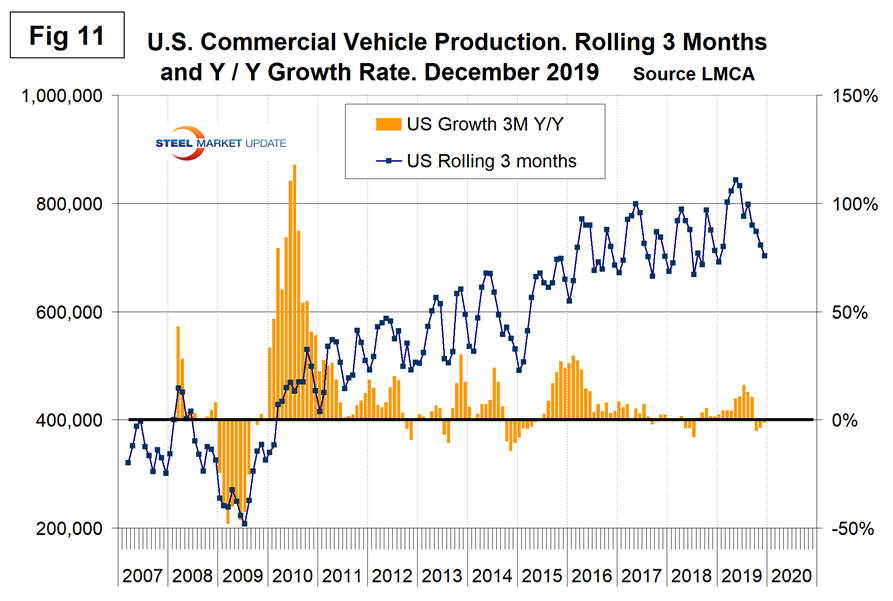
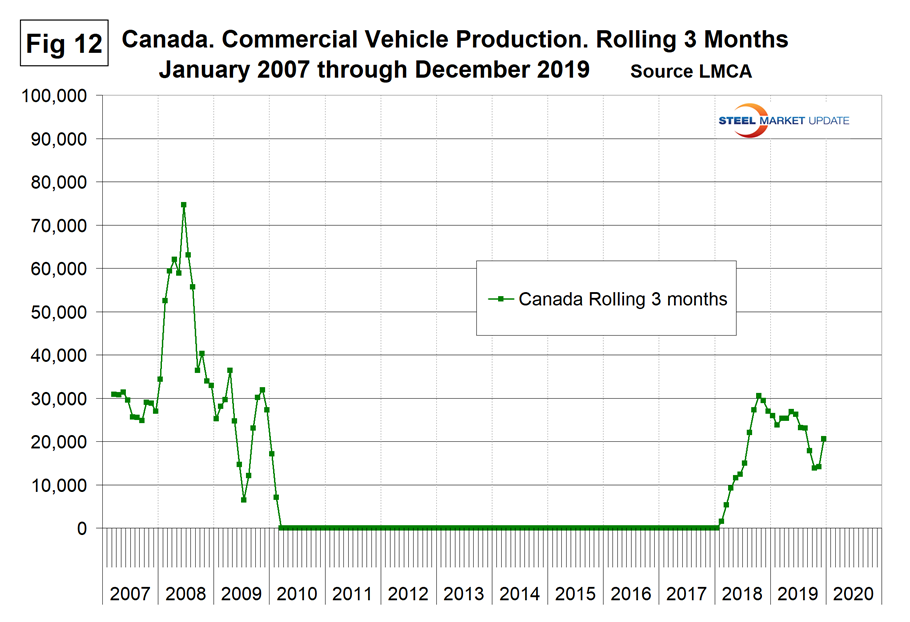
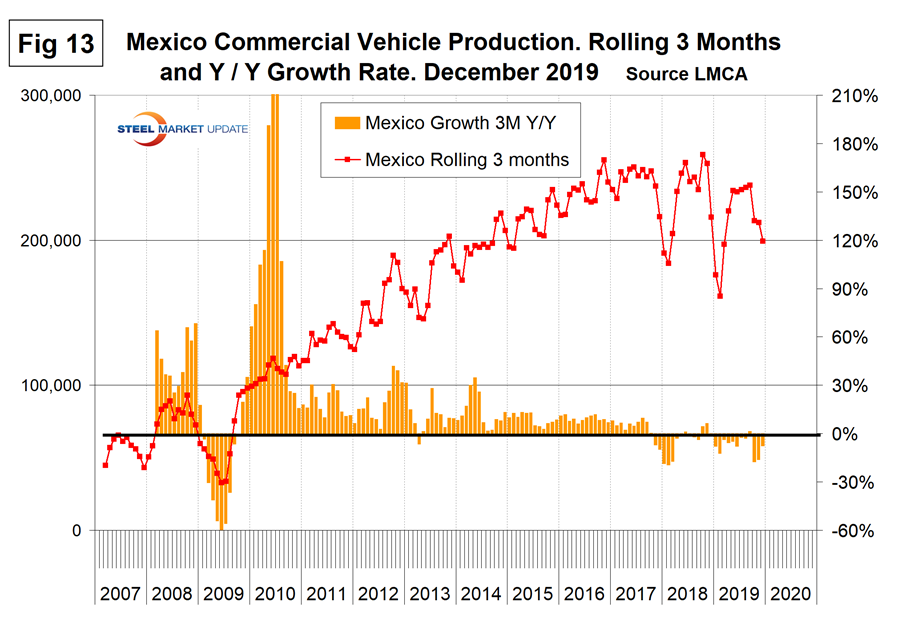
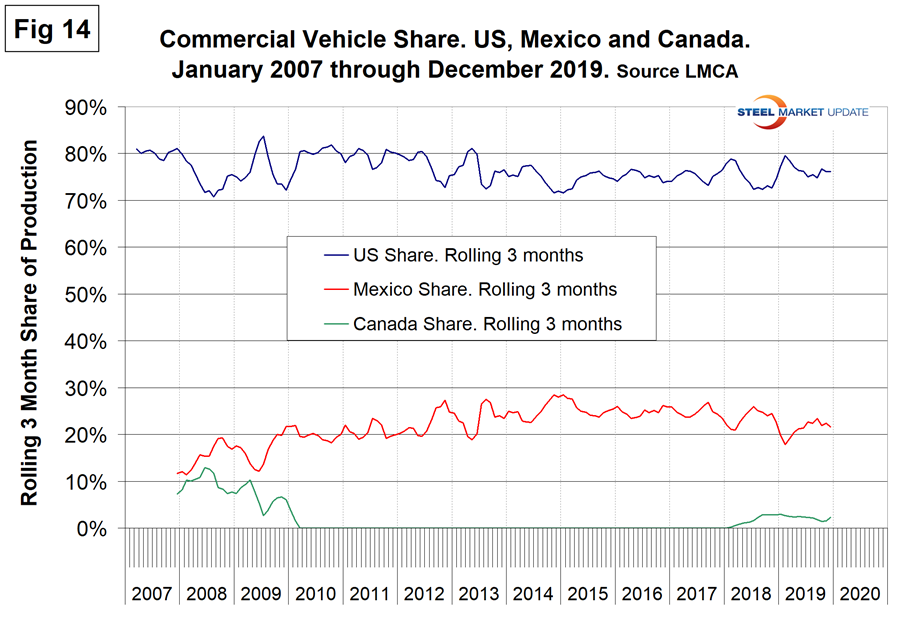
Figures 11, 12 and 13 show the production of commercial vehicles by nation and the year-over-year growth rate for each. Figure 14 shows the production share for each nation. Commercial vehicle production in Canada was zero from January 2010 through January 2018. The only Canadian plant making commercial vehicles in the past couple of decades was in Oshawa. At the end of 2009, they shifted their production from the Chevy Silverado to the Camaro. That changed again in February 2018 when the Oshawa plant shifted away from the Equinox (personal vehicle) and again began to produce the Silverado and Sierra (both commercial vehicles). In 2019, GM has declared their intention to permanently close the Oshawa plant in late 2020 as part of a global restructuring plan. In its heyday, the Oshawa plant was one of the biggest auto assembly plants in the world, producing almost a million cars a year. Multiple shifts of workers used to crank out more than one type of vehicle every day when the plant was operating at full capacity.
Both the U.S. and Mexico have achieved strong growth in commercial vehicle assemblies since the recession and their production shares have been almost a mirror image of each other in the short term. Mexico currently exports about 80 percent of its light vehicle production with the U.S and Canada as the highest volume destinations.
SMU Comment: There is no doubt that assembly volume in North America is declining. On a year-over-year rolling 12-month basis, growth has been negative every month since July 2017.