

Analysis
March 8, 2020
Construction Put in Place Data for January
Written by Peter Wright
In January, total construction continued to boom with a 5.1 percent year-over-year growth rate
Total construction is enjoying a remarkable turnaround with positive momentum in all sectors. The January results for total construction spending yielded the best growth rate for 15 months. Growth is being led by state and locally funded work including infrastructure, but the growth of private construction became positive in December and January and has been improving since last July.
At SMU, we analyze the Construction Put in Place (CPIP) data to provide a detailed description of activity that accounts for about 45 percent of total U.S. steel consumption. See the end of this report for a description of how we perform this analysis and structure the data. The growth or contraction that we report in our analysis has had seasonality removed by providing only year-over-year comparisons.
The CPIP expenditures data for January was released on March 3. In three months through January, total construction had the best performance since October 2018.
![]()
Total Construction
Total construction expanded by 5.1 percent in three months through January and by 1.0 percent in 12 months through January, both year over year. Since the three-month growth rate is higher than the 12-month rate, we conclude that momentum was positive in January when construction expenditures totaled $82.4 billion. This breaks down to $60.8 billion of private work, $19.7 billion of state and locally funded (S&L) work, and $1.8 billion of federally funded work (Table 1 January). Construction expenditures are experiencing a remarkable turnaround. This can clearly be seen by comparing the January 2020 update of Table 1 with the version we published for September 2019 (Table 1 September).
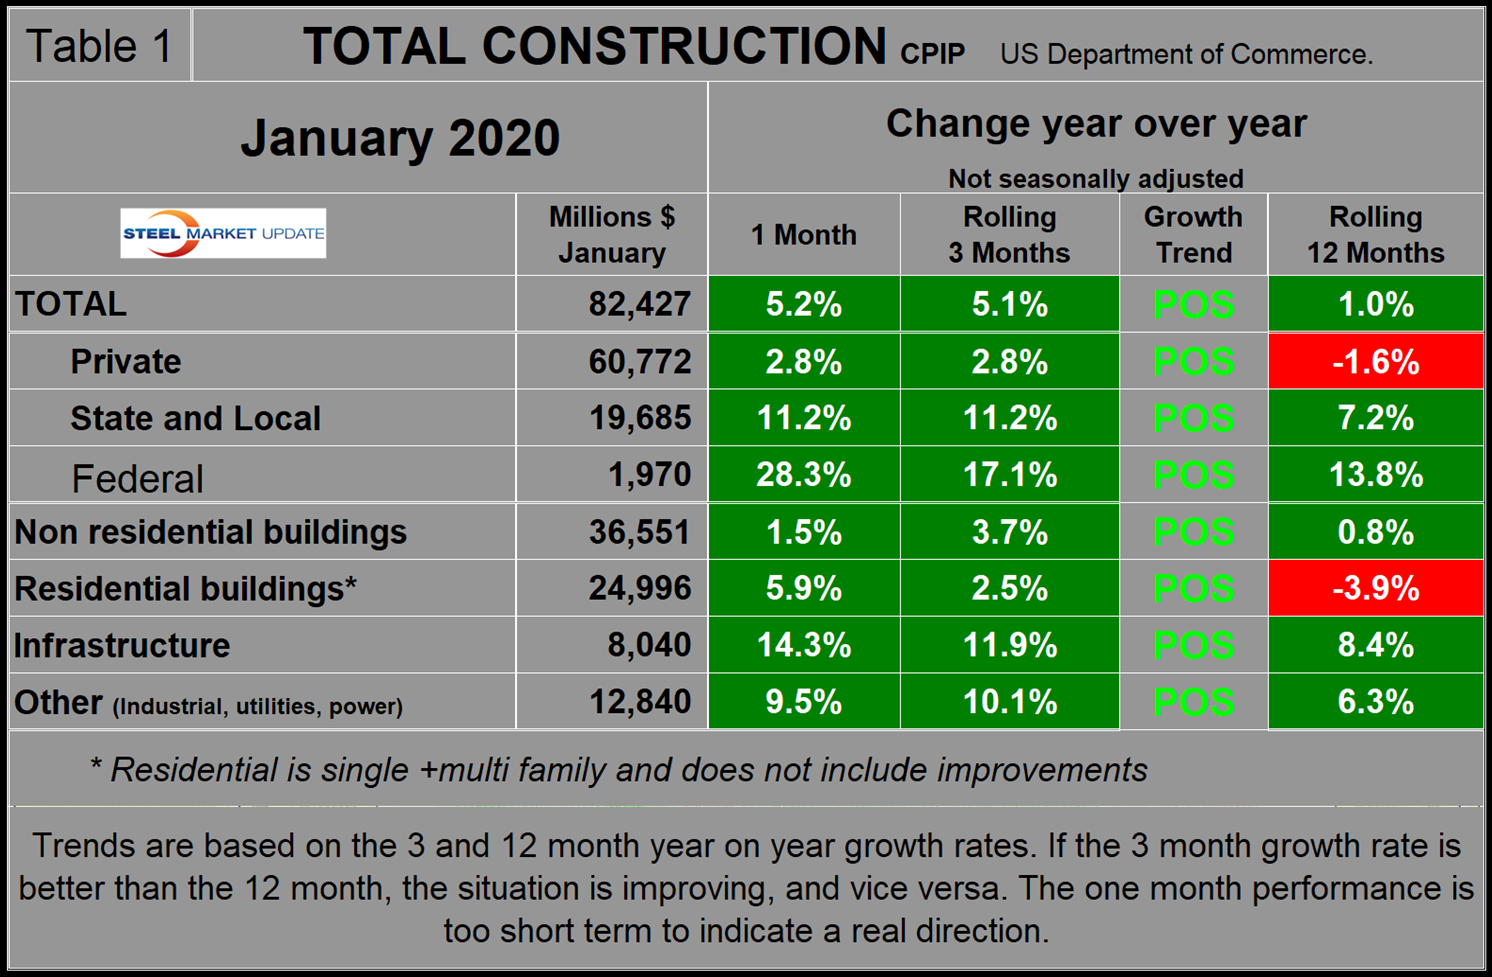
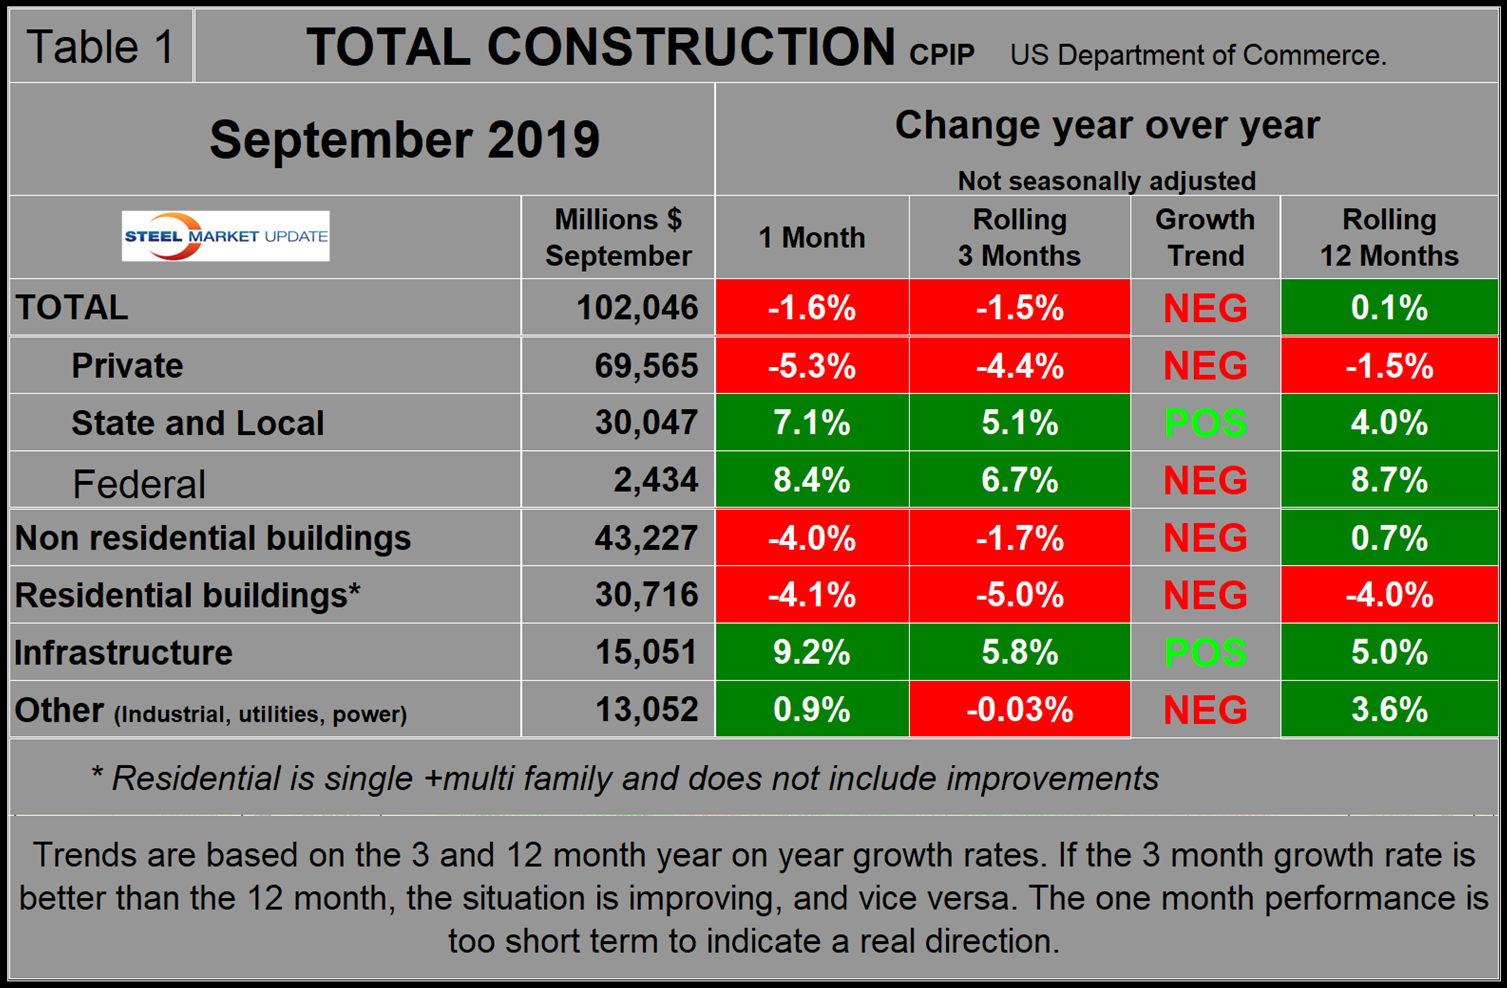
Growth trend columns in all five tables in this report show momentum. In May 2015 we began to file monthly copies of Table 1. December 2019 and January 2020 were the first months that we have on file in which momentum was positive for all sectors.
Figure 1 shows total construction expenditures on a rolling 12-month basis as the blue line and the rolling three-month year-over-year growth rate as the brown bars. Total construction on a rolling 12-months basis was at an all-time high in January (not inflation adjusted) after declining each month April through September and picking up each month October through January. The brown bars show growth on a 3MMA basis year over year, and the contraction in June through September was the first since November 2011. In 12 months through January 2020, construction expenditures totaled $1.129 trillion. (This number excludes residential improvements; see explanation below.) To put that number in perspective, the pre-recession peak of total construction on a rolling 12-month basis was $1.028 trillion through September 2006. The low point was $665.1 billion in the 12 months through March 2011.
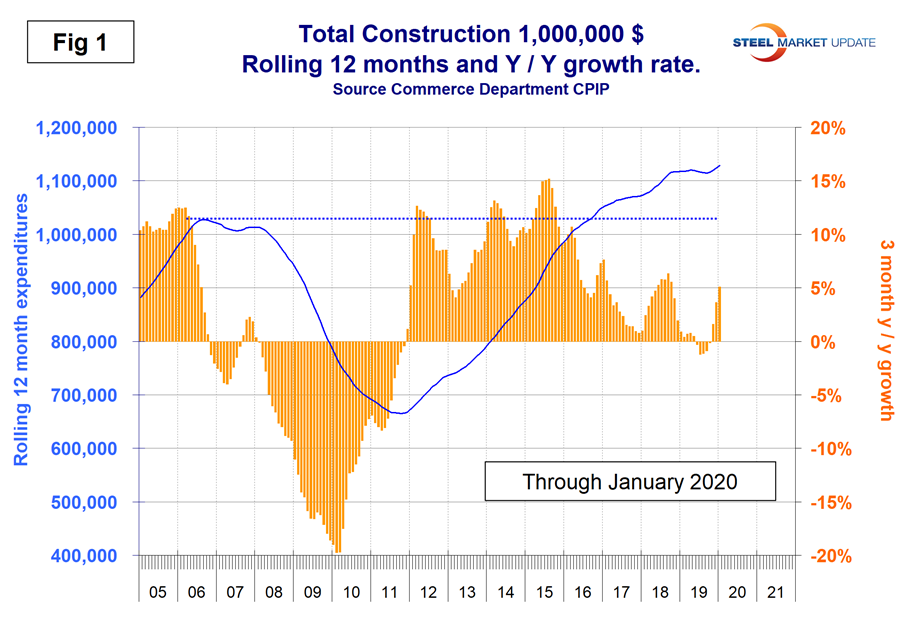
Figures 1, 2, 6, 7 and 9 in this analysis have the same format, the result of which is to smooth out variation and eliminate seasonality. We consider four sectors within total construction: nonresidential, residential, infrastructure and other. The latter is a catchall and includes industrial, utilities and power.
Private Construction
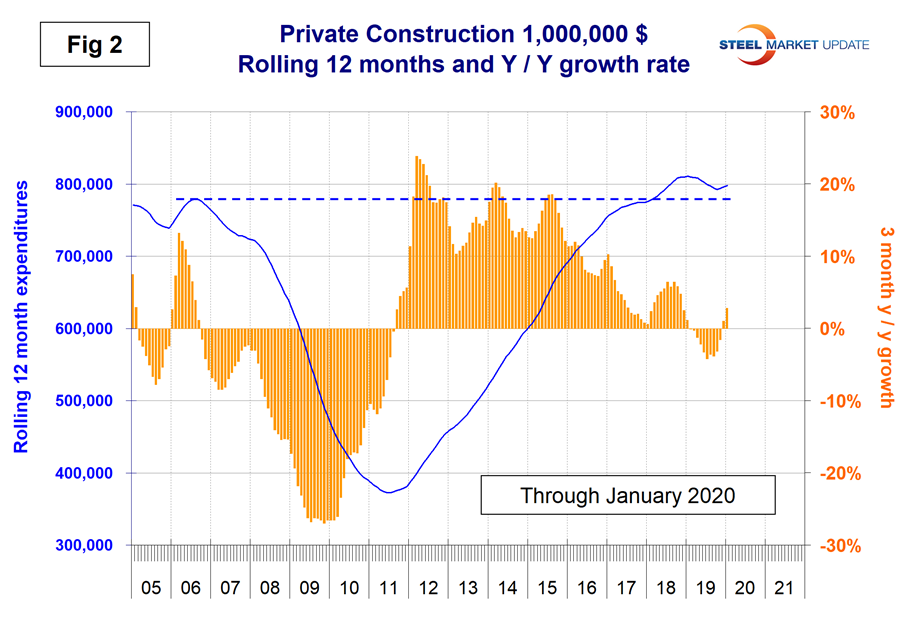
Table 2 shows the breakdown of private expenditures into residential and nonresidential and subsectors of both. The growth rate of private construction in three months through January was positive 2.8 percent, up from negative 4.2 percent in three months through July last year. Since then there has been a steady improvement as shown by the brown bars in Figure 2. Momentum was positive in November through January for the first time since October 2018.
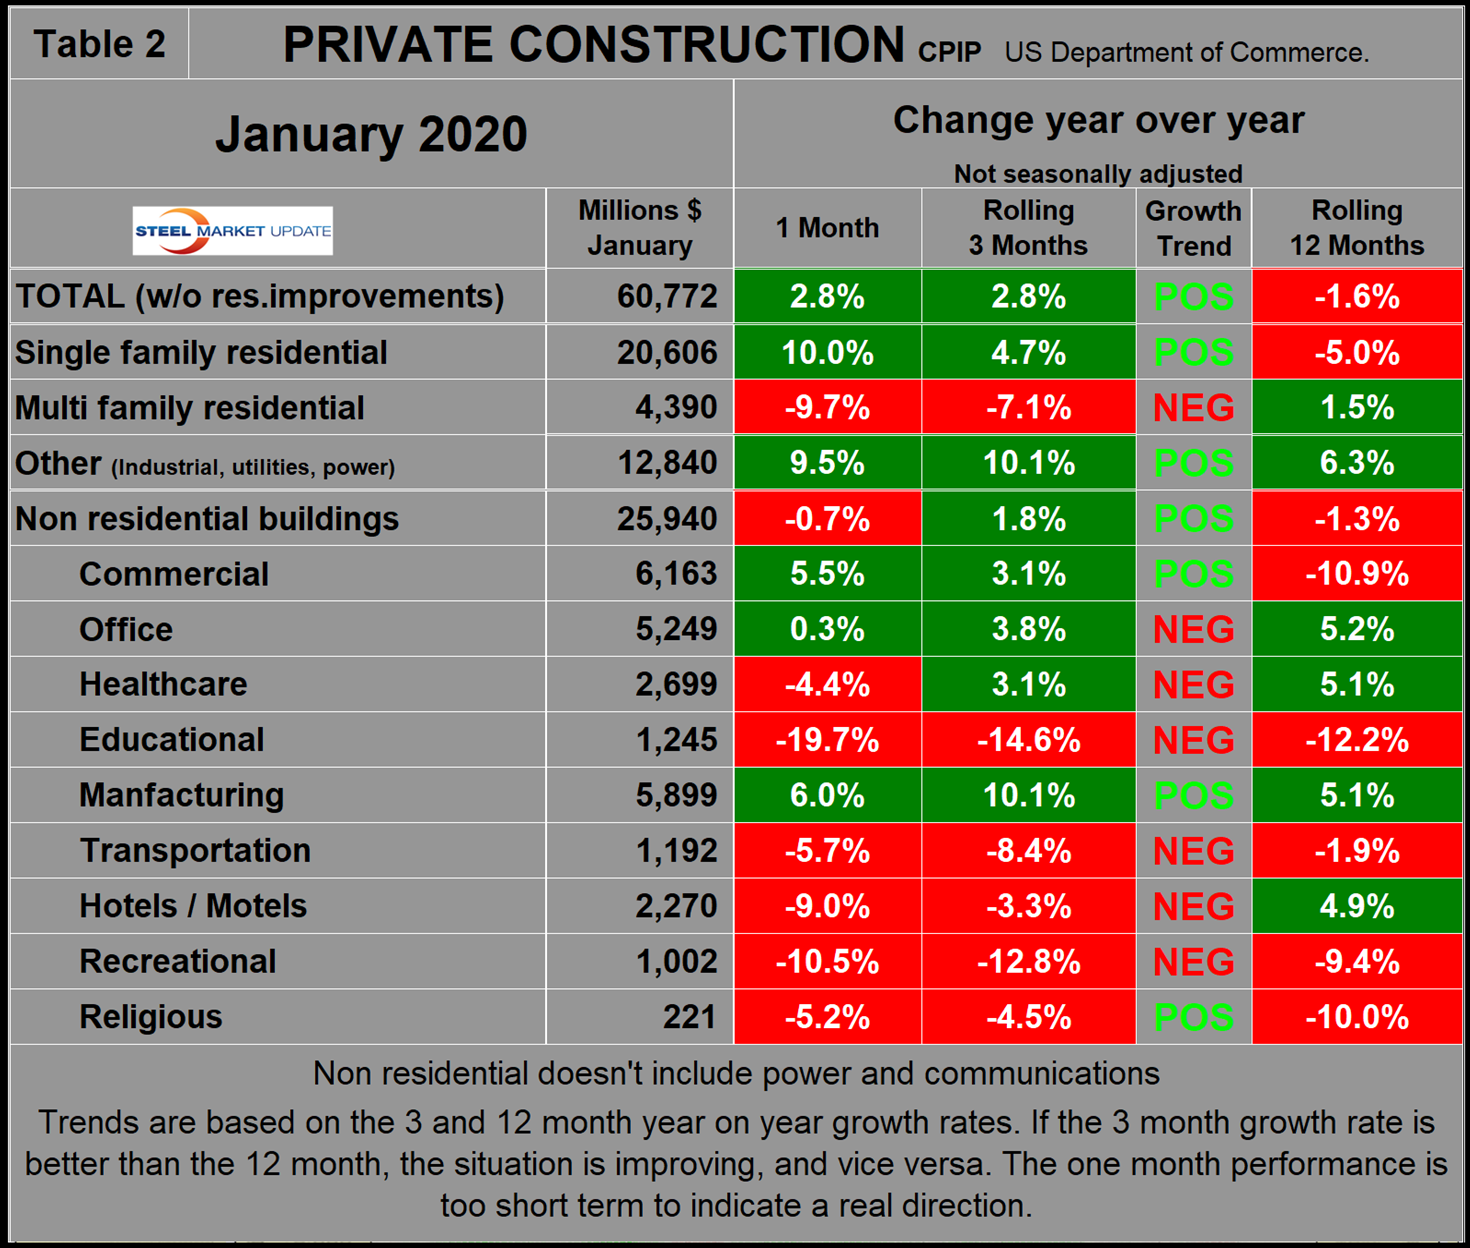
Within the nine sectors of private nonresidential buildings, commercial (mainly stores), manufacturing and religious had positive momentum in three months through January, which was no change from our last update. The other six sectors had negative momentum. (Commercial and manufacturing are the two biggest sectors, which swayed the overall momentum result).
Excluding property improvements, single-family residential expanded by 4.7 percent in three months through January with positive momentum and multifamily residential contracted by 7.1 percent with negative momentum. Total housing starts as reported by the Census Bureau expanded by 17.0 percent in three months through January year over year. In the starts data, the whole project is entered into the database when ground is broken. Construction put in place is based on spending work as it proceeds; the value of a project is spread out from the project’s start to its completion. Last month we commented that the Census Bureau result for single-family starts in December was probably an outlier because it rose abruptly to the highest level since October 2007. The January result continued the December trend, therefore we are finally developing some optimism about the housing market, which has had a very slow recovery since the recession. Multifamily starts in December and January were even more unusual being up by 32.5 percent and 47.6 percent, respectively, year over year on a 3MMA basis. Both the single- and multifamily starts data are now completely out of line with the CPIP result, which if they continue in that mode bodes very well for future expenditures. Figure 3 shows the growth of both housing sectors since January 2005.
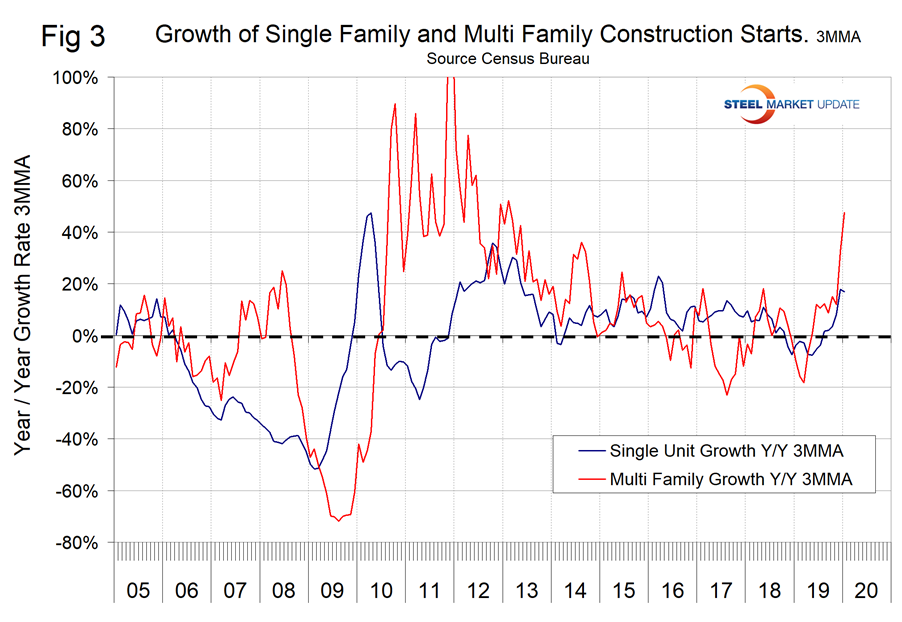
Figure 4 shows the ratio of single-family to multifamily starts. The proportion of single-family gradually increased from January 2015 when the ratio was 1.66 in favor of single units to 2.02 in January 2020.
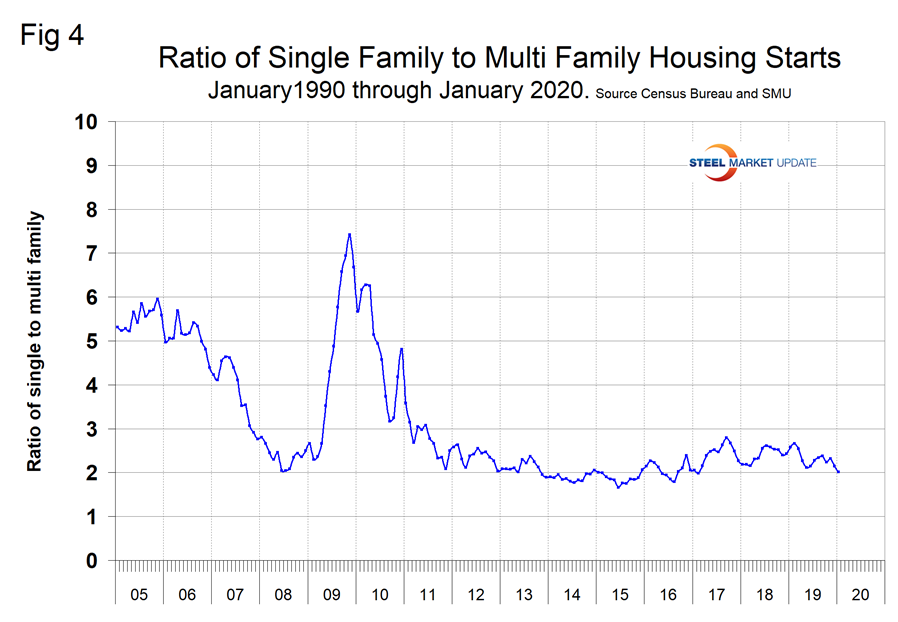
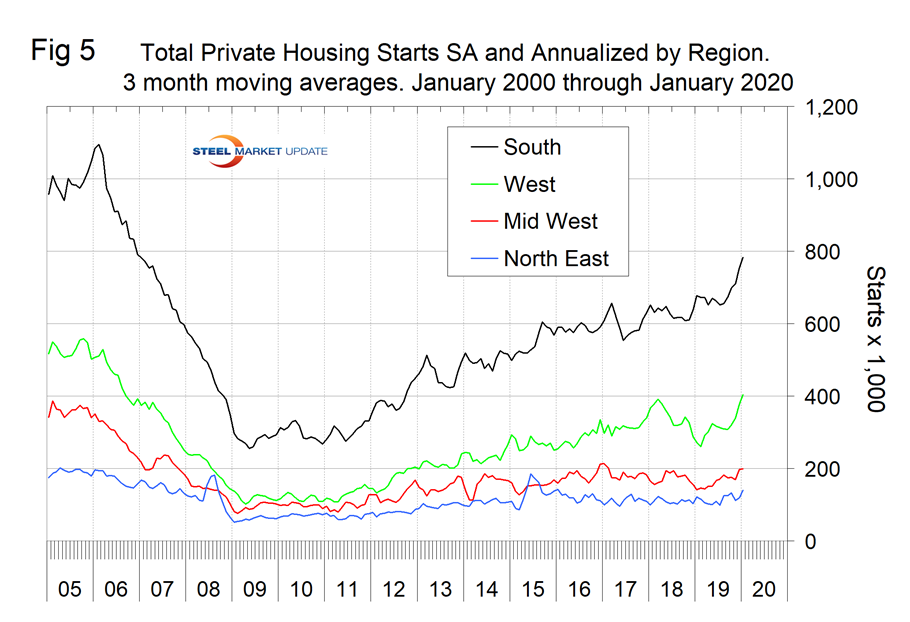
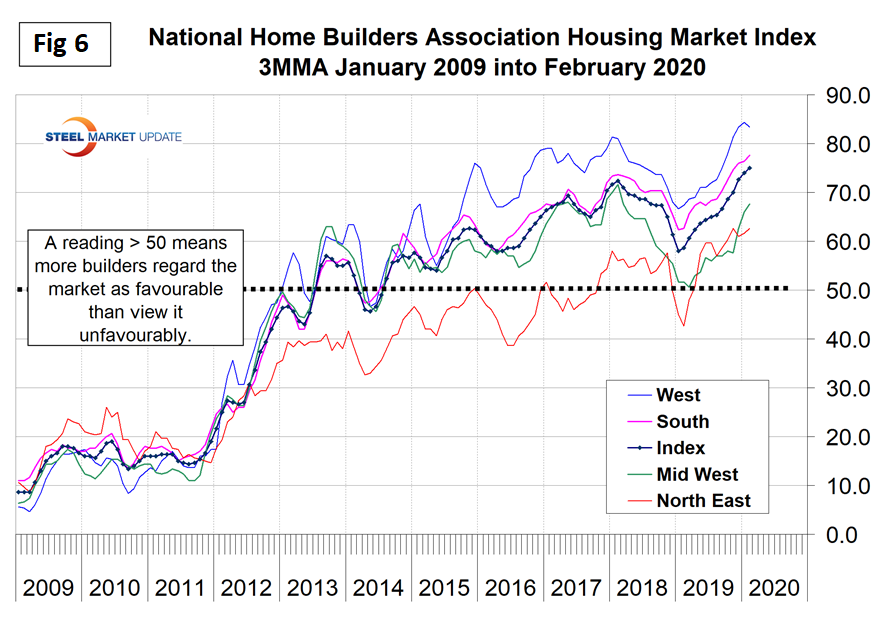
Figure 5 shows total housing starts in four regions with the South being the strongest and the Northeast the weakest. On a 3MMA basis, the National Association of Home Builders optimism index improved every month from January 2019 through January 2020 (Figure 6). Economy.com had good things to say about the NAHB index on Feb. 18: “Homebuilder confidence inched down 1 point to 74 in February. Even so, the index is 24 points above the 50-point threshold, indicating a healthy housing market. All subcomponents edged downward this month. Meanwhile, three of the four regional scores increased on a three-month moving average basis. Overall, building conditions are in great shape and the short-term outlook is overwhelmingly positive.”
State and Local Construction
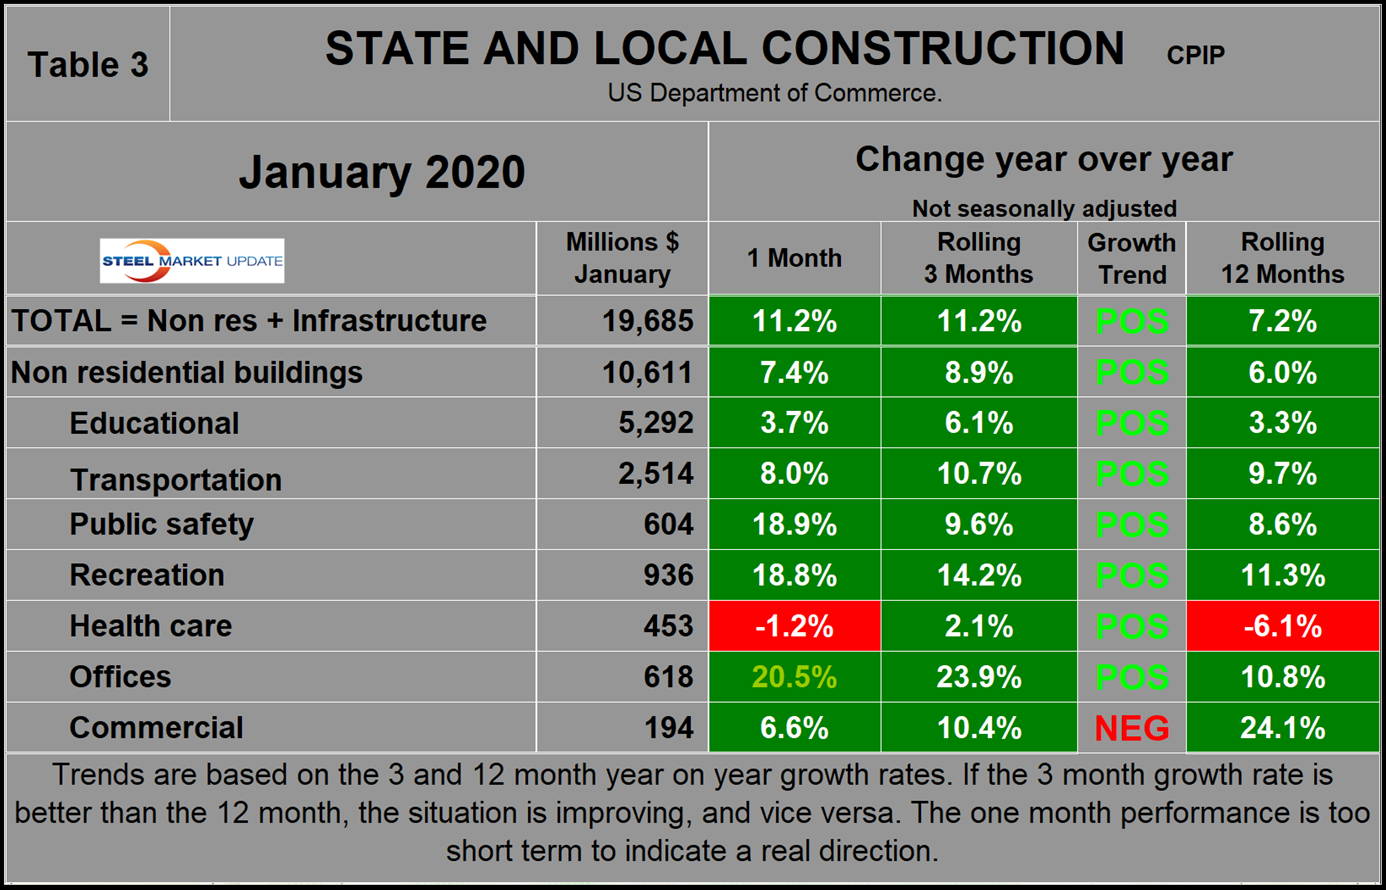
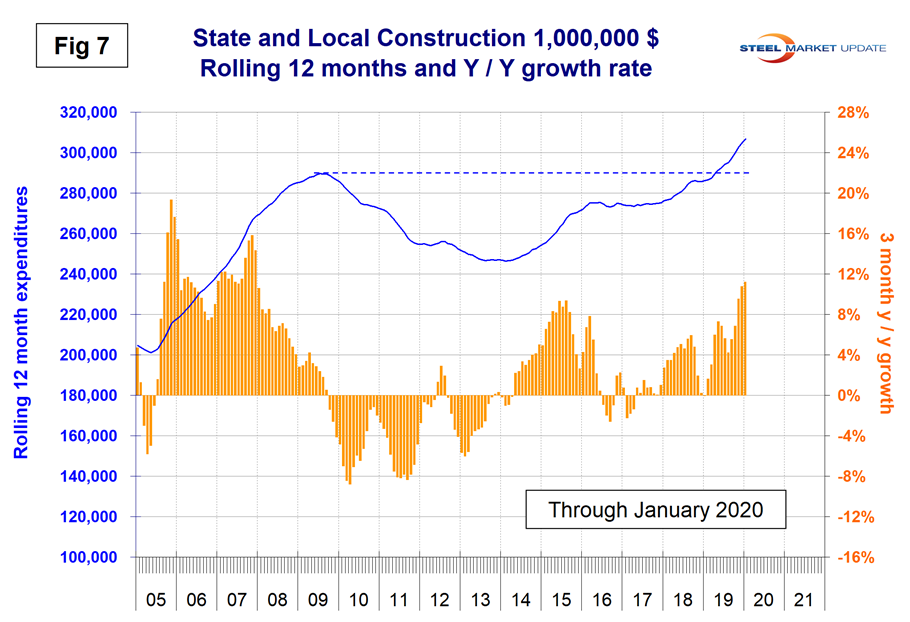
The growth rate of S&L work was in the range 4.2 to 7.3 percent for the period April through October 2019, but broke out to the upside in November to 9.5 percent and continued to improve in December to 10.8 percent and to 11.2 percent in January (Table 3). This includes both infrastructure and non-residential buildings. S&L non-residential buildings had negative momentum each month from October 2018 through July 2019 and became positive in August through January with an 8.9 percent growth rate in January. Educational is by far the largest subsector of S&L nonresidential buildings at $5.3 billion in January and expanded at a 6.1 percent rate in three months through January with positive momentum. Figure 7 shows the history of total S&L expenditures.
Drilling down into the private and S&L sectors as presented in Tables 2 and 3 shows which project types should be targeted for steel sales and which should be avoided. There are also regional differences to be considered, data for which is not available from the Commerce Department.
Infrastructure
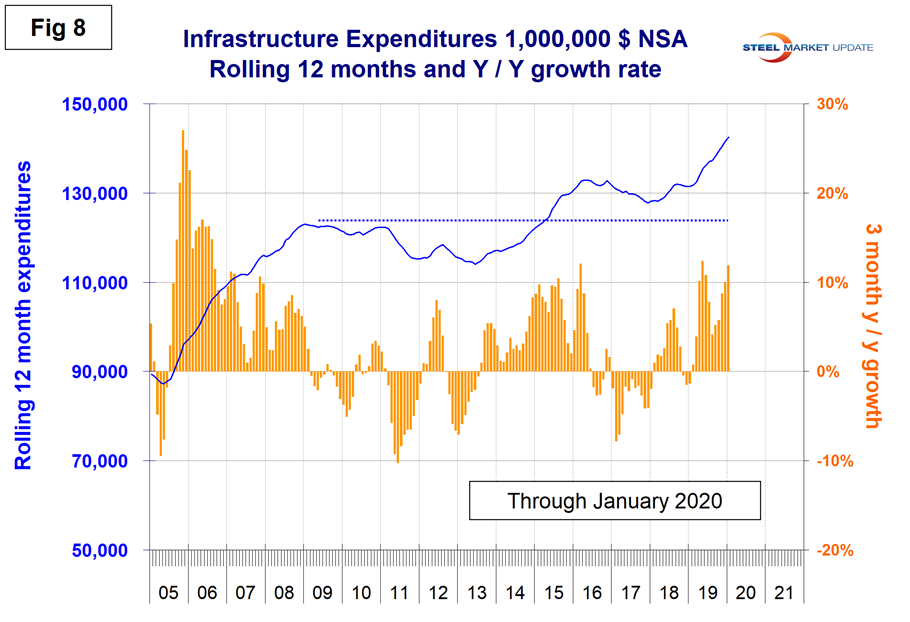
Infrastructure expenditures had robust growth in 2019 that continued in January 2020. Year over year, the growth of infrastructure expenditures in three months through January was 11.9 percent. On a rolling 12-months basis, infrastructure expenditures in January were at an all-time high. (Note: There is no seasonality in this report as we are considering year-over-year data.) Highways and streets including pavement and bridges account for almost three quarters of total infrastructure expenditures. Highway pavement is the main subcomponent of highways and streets and had a 17.3 percent growth in three months through January. Bridge expenditures had negative growth in every month from April 2016 through January 2019. This was followed by a brief five months of expansion before dipping back into contraction in July 2019. In January 2020, bridge work contracted by 12.0 percent year over year (Table 4).
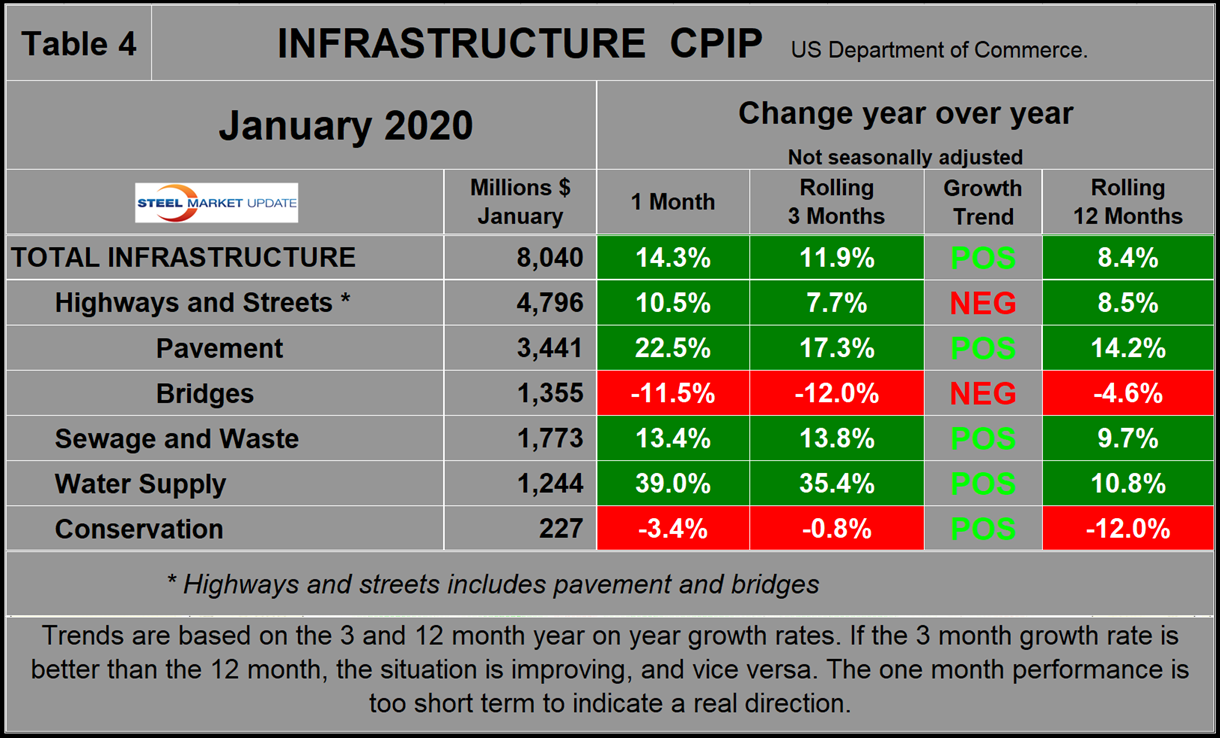
Figure 8 shows the rolling 12-month history of infrastructure expenditures and the year-over-year growth rate.
Total Building Construction Including Residential
Figure 9 compares year-to-date expenditures for the construction of the various building sectors for 2018 and 2019. We haven’t updated this annual comparison for 2020 since we only have one month of data at this time. Single-family residential is dominant and in the 12 months of 2019 totaled $274.0 billion, down from $289.6 billion in 2018.
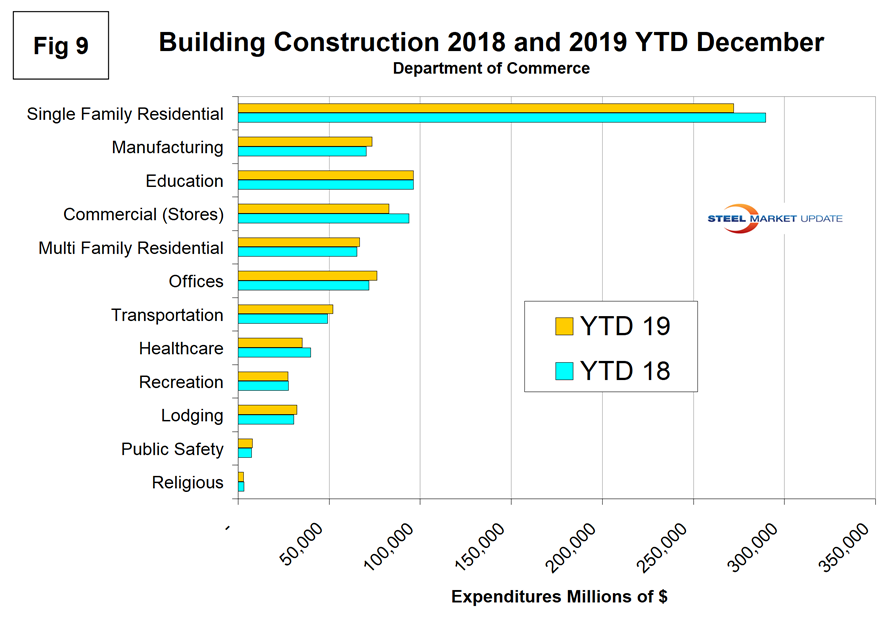
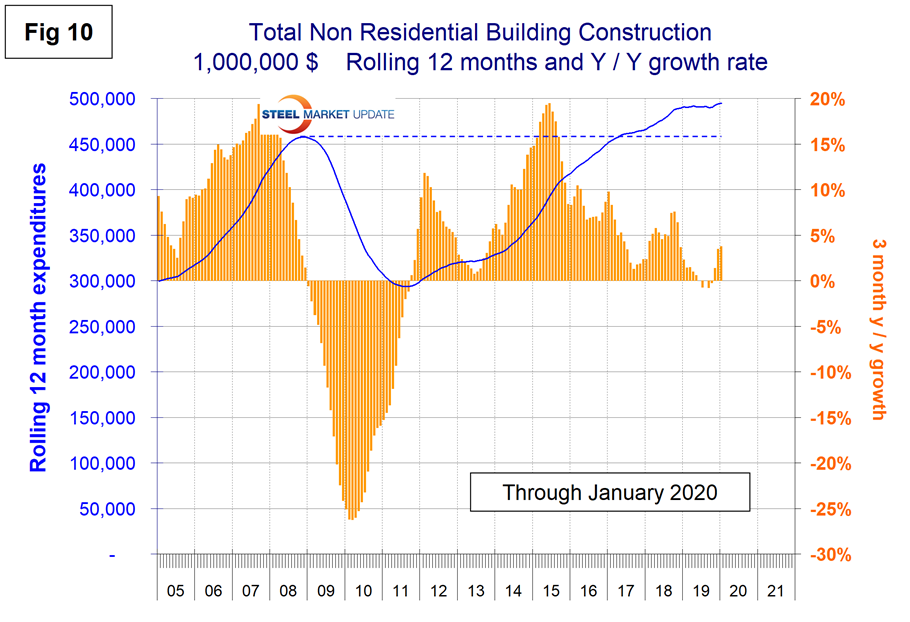
Figure 10 shows total expenditures and growth of nonresidential building construction through January 2020. On a rolling 12-months basis, expenditures on non-residential buildings were at an all-time high in April 2019, but that record was broken in November 2019 with a continuing improvement in December and January. In its February update the American Institute of Architects had this to say: “Starting the year on a strong note, architecture firm billings strengthened slightly in January. AIA’s Architecture Billings Index (ABI) score of 52.2 for January compared to 52.1 in December reflects an increase in design services provided by U.S. architecture firms (any score above 50 indicates an increase in billings). Indicators of work in the pipeline, including new project inquiries and new design contracts remained positive, posting scores of 57.9 and 56.0, respectively. “Despite the continued presence of volatility in the economy, design activity has begun to accelerate in recent months,” said AIA Chief Economist, Kermit Baker. “Even with the ongoing challenges facing the nonresidential construction sector, this upturn points to at least modest growth over the coming year.”
Explanation: Each month, the Commerce Department issues its Construction Put In Place (CPIP) data, usually on the first working day covering activity one month and one day earlier. There are three major categories based on funding source, private, state and local, and federal. Within these three groups are about 120 subcategories of construction projects. At SMU, we slice and dice the expenditures from the three funding categories to provide as concise a summary as possible of steel consuming sectors. For example we combine all three to reach a total of non-residential building expenditures. CPIP is based on spending work as it occurs and is estimated each month from a sample of projects. In effect, the value of a project is spread out from the project’s start to its completion. This is different from the starts data published by the Census Bureau for residential construction, by Dodge Data & Analytics and by Reed Construction for nonresidential, and by Industrial Information Resources for industrial construction. In the case of starts data, the whole project is entered into the data base when ground is broken. The result is that the starts data can be very spiky, which is not the case with CPIP.
The official CPIP press release gives no appreciation of trends on a historical basis and merely compares the current month with the previous one on a seasonally adjusted basis. The background data is provided as both seasonally adjusted and non-adjusted. The detail is hidden in the published tables, which SMU tracks and dissects to provide a long-term perspective. Our intent is to provide a route map for those subscribers who are dependent on this industry to “follow the money.” This is a very broad and complex subject, therefore to make this monthly write-up more comprehensible we are keeping the information format as consistent as possible. In our opinion, the absolute value of the dollar expenditures presented are of little interest. What we are after is the magnitude of growth or contraction of the various sectors. In the SMU analysis, we consider only the non-seasonally adjusted data. We eliminate seasonal effects by comparing rolling three-month expenditures year over year. CPIP data also includes the category of residential improvements, which we have removed from our analysis because such expenditures are minor consumers of steel.
In the four tables included in this analysis, we present the non-seasonally adjusted expenditures for the most recent data release. Growth rates presented are all year over year and are the rate for the single month’s result, the rolling three months and the rolling 12 months. We ignore the single-month year-over-year result in our write-ups because these numbers are preliminary and can contain too much noise. The growth trend columns indicate momentum. If the rolling three-month growth rate is stronger than the rolling 12 months, we define that as positive momentum, and vice versa. In the text, when we refer to growth rate, we are describing the rolling three-month year-over-year rate. In Figures 1, 2, 6, 7 and 9 the blue lines represent the rolling 12-month expenditures and the brown bars represent the rolling three-month year-over-year growth rates.


