

Market Data
March 17, 2020
Oil Price Dips Below $30 Per Barrel
Written by Peter Wright
The West Texas Intermediate crude price has fallen through $30 per barrel for the first time since September 2003.
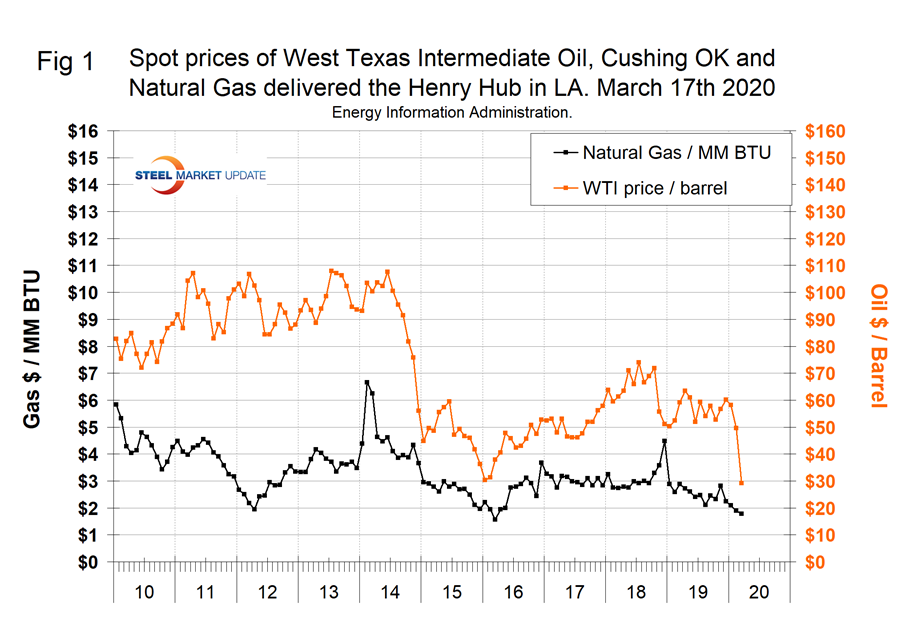
Normally our price data comes from the Energy Information Administration (EIA), but their data is not keeping up with today’s collapsing market. Their latest was March 6 when they published a price of $42.24 per barrel for WTI. This month we researched commodity prices from Markets Insider, which publishes trading prices by the second. On the morning of March 17, the price was $29.16 for WTI and $29.25 for Brent. The price of natural gas published by Markets Insider on Tuesday morning was $1.78/MM BTU at the Henry Hub in Louisiana, which was only a few cents below the price published by the EIA for March 6. The price of gas is not collapsing.
The prices of oil and natural gas drive the consumption of energy-related steel products including oil country tubular goods, pipe fittings and well head equipment, among others. Welded tubular goods (not including OCTG) consumed about 5.5 million tons of hot rolled sheet in 2018.
Figure 1 shows historical oil and gas prices on a mid-month basis from January 2000 through March 17, 2020.
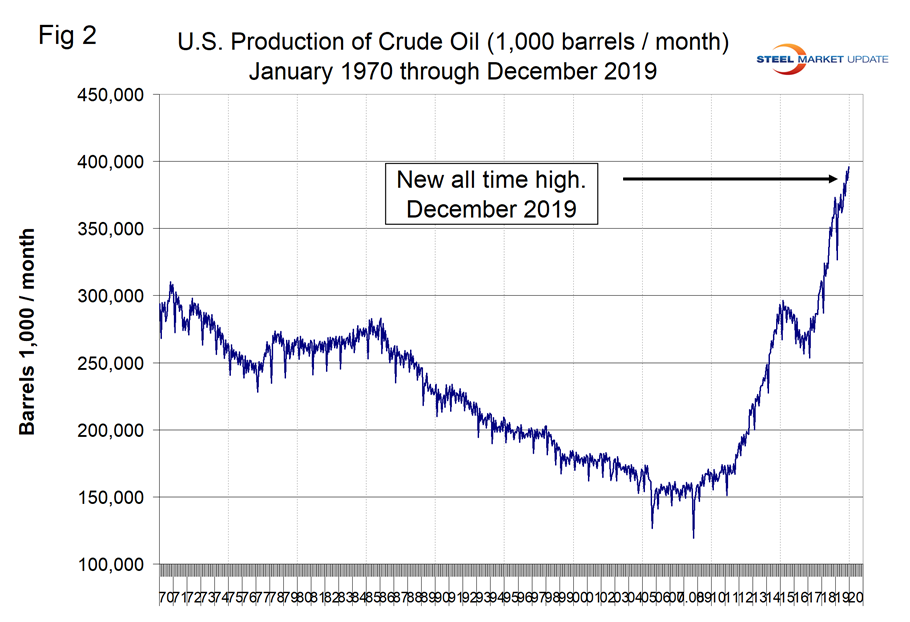
In the light of today’s market volatility, it doesn’t seem appropriate to publish our normal data, which is well behind the curve. One item that seems incredibly historic at the moment is that U.S. oil production set another all-time record in December (latest data) of 396 million barrels for the month as shown in Figure 2.
On March 13, following the collapse of the Russia-Saudi Arabia price negotiations, Vladimir Zernov wrote: “Oil is getting hit by a double blow from the collapse of the OPEC deal and coronavirus containment measures. Currently, it looks like Russia is very serious about sticking to its new position and trying to deal a blow to the U.S. shale, both for political and for longer-term market share reasons. The situation on the coronavirus front gets worse day by day. When Brent oil visited sub-$40 territory back in late 2015-early 2016, it fell towards $30 for about five weeks. The rebound towards $40 took eight weeks, and oil traded near $40 for about four more weeks before it was ready to move to the upside. In total, it took oil about four months to get firmly back above $40. Given the current external shocks that did not exist at that time, it’s hard to believe that oil will have a quicker rebound.”
This week we were asked by a subscriber to examine the relationship between the prices of oil and hot band, which we have done and present here as Figures 3 and 4.
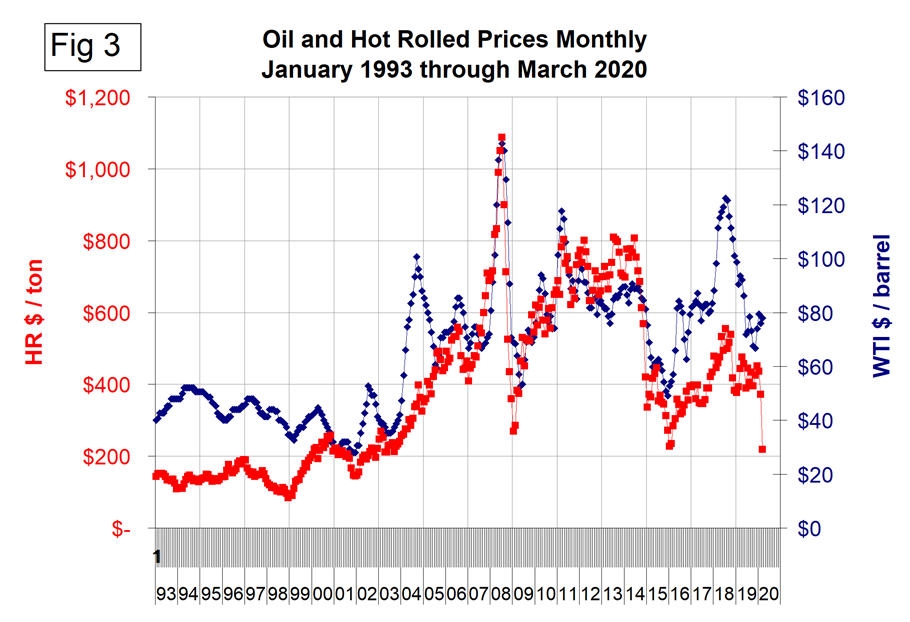
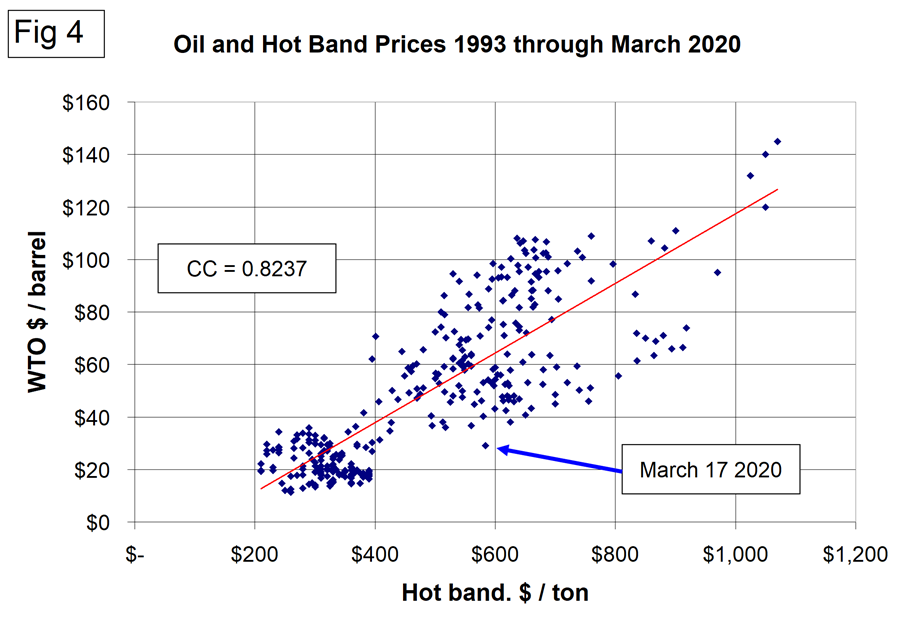
Over a 27-year period there has been a loose correlation between oil and hot rolled sheet prices. This is not necessarily a portent of the immediate future, but based on the scatter the latest data point is an outlier suggesting that either the oil price will recover or the price of HR sheet will decline to bring the relationship back into the normal historical range.
Baker Hughes Rotary Rig Count: This is a weekly census of the number of drilling rigs actively exploring for or developing oil or natural gas in the United States. Rigs are considered active from the time they break ground until the time they reach their target depth and may be establishing a new well or sidetracking an existing one. The Baker Hughes Rotary Rig Count includes only those rigs that are significant consumers of oilfield services and supplies.
Brent and WTI: Brent and West Texas Intermediate (WTI) are the two most commonly traded contracts of crude oil in the markets. Brent refers to oil that is produced in the Brent oil fields and other sites in the North Sea. Brent is the benchmark for African, European, and Middle Eastern crude oil and is often considered the benchmark targeted by OPEC. WTI crude is sourced from the U.S. and is seen as the benchmark in the Western Hemisphere. Both are light, sweet crude oils, although WTI is generally sweeter and lighter than its European counterpart.


