

Market Data
April 6, 2020
BLS Data Shows Shocking Job Losses in April
Written by Peter Wright
We’re all saturated with news of the employment disaster caused by the coronavirus, but to look at the long-term picture graphically is still shocking.
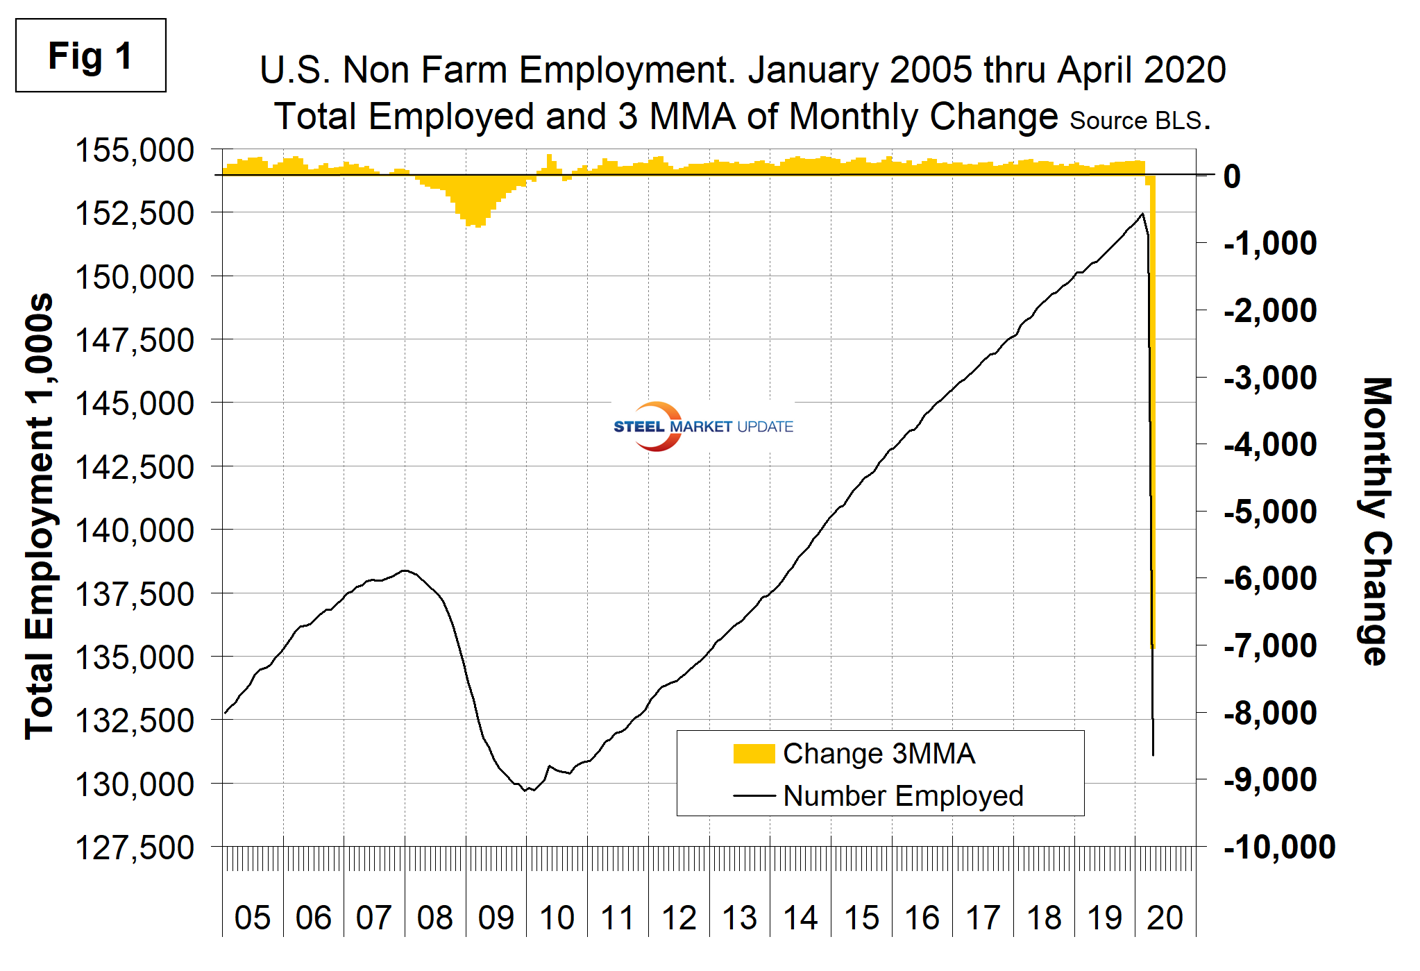
Figure 1 shows the three-month moving average (3MMA) of the number of jobs created or lost through April since 2005 as the brown bars and the total number employed as the black line. The Great Recession of 2008-09 appears as a mere bump in the road. The right hand side Y axis is 3MMA and only extends to negative 10 million. In the single month of April, 20.5 million jobs were lost; therefore Figure 1, as bad as it is, barely describes the gravity of the situation.
Employment and wages are the main contributors to the economy because personal consumption accounts for almost 70 percent of GDP. Steel consumption is related to GDP, but is much more volatile. Therefore, this is another insight into how bad the second quarter will be for steel-related industries.
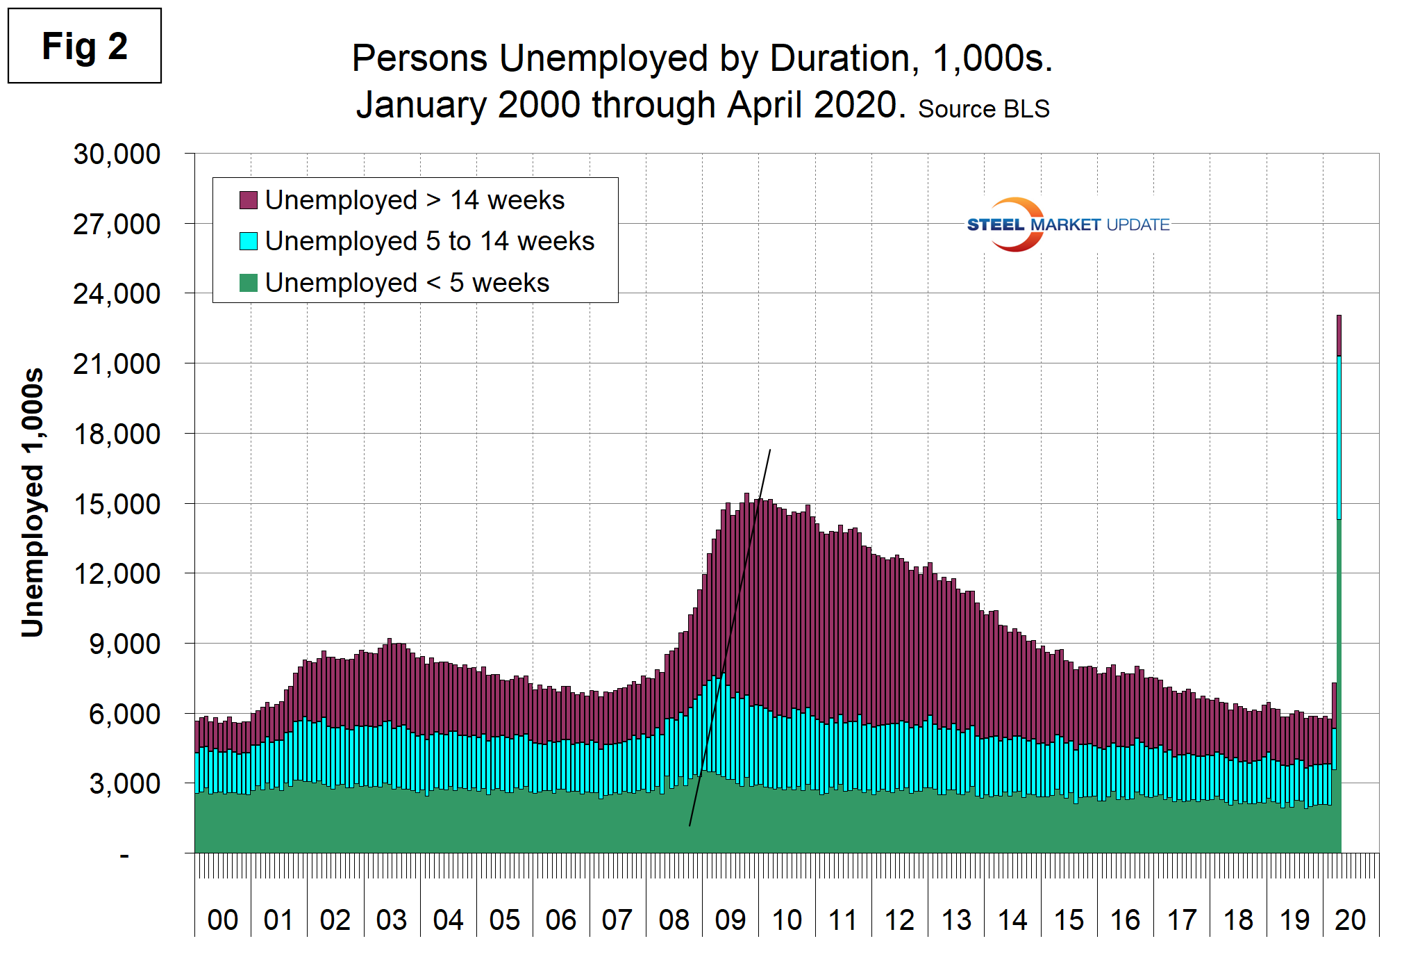
According to the Bureau of Labor Statistics, unemployment rates rose sharply in April among all major worker groups. The jobless rate was 13.0 percent for adult men, 15.5 percent for adult women, 31.9 percent for teenagers, 14.2 percent for Whites, 16.7 percent for Blacks, 14.5 percent for Asians, and 18.9 percent for Hispanics. The rates for all of these groups, with the exception of Blacks, represent record highs for their respective series. The number of unemployed persons who were jobless less for than 5 weeks increased by 10.7 million to 14.3 million, accounting for almost two-thirds of the unemployed. The number of unemployed persons who were jobless for 5-14 weeks rose by 5.2 million to a total of 7.0 million. The number of long-term unemployed (those jobless for 27 weeks or more), at 939,000, declined by 225,000 over the month and represented 4.1 percent of the unemployed.
Figure 2 shows the historical picture for the duration of unemployment since January 2000.
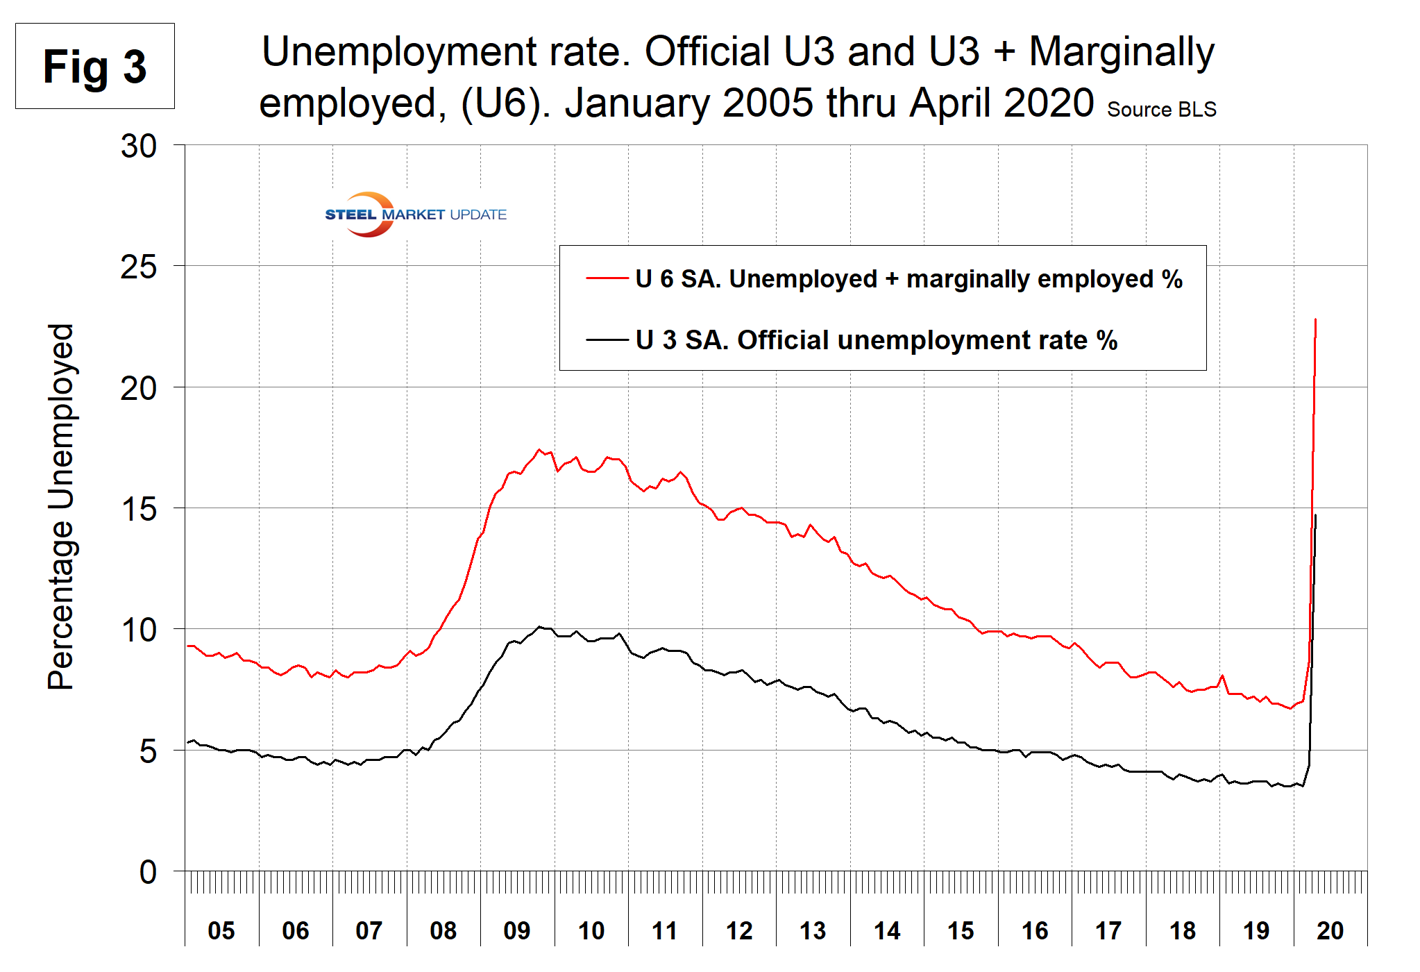
The official unemployment rate, U3, reported in the BLS Household survey (see explanation below) increased from 3.5 percent in February to 4.4 percent in March and to 14.7 percent in April. This is not a very representative number. The more comprehensive U6 unemployment rate at 22.8 percent was up from 8.7 percent in March (Figure 3). U6 includes individuals working part time who desire full-time work and those who want to work but are so discouraged they have stopped looking.
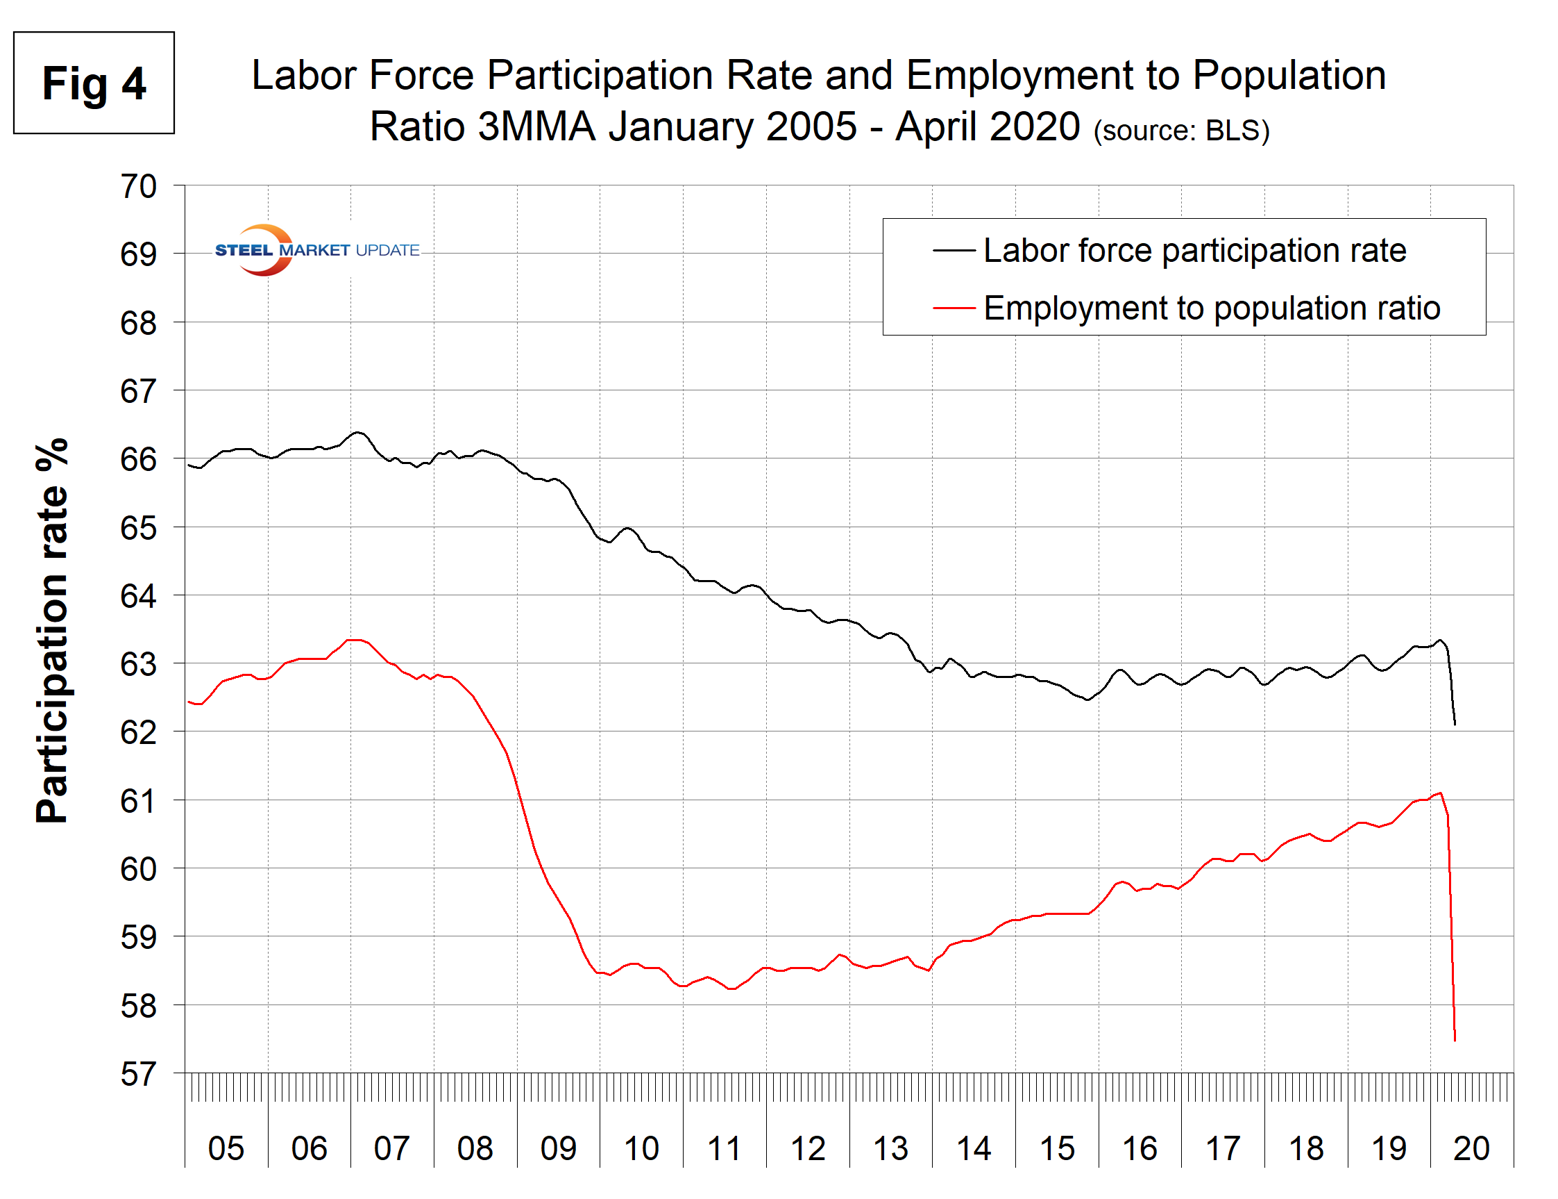
The labor force participation rate is calculated by dividing the number of people actively participating in the labor force by the total number of people eligible to participate. This measure was 60.2 percent in April, down from 62.7 percent in March. Another gauge is the number employed as a percentage of the population. In April, the employment-to-population ratio was 51.3 percent, down from 60.0 in March. Figure 4 shows both measures on one graph.
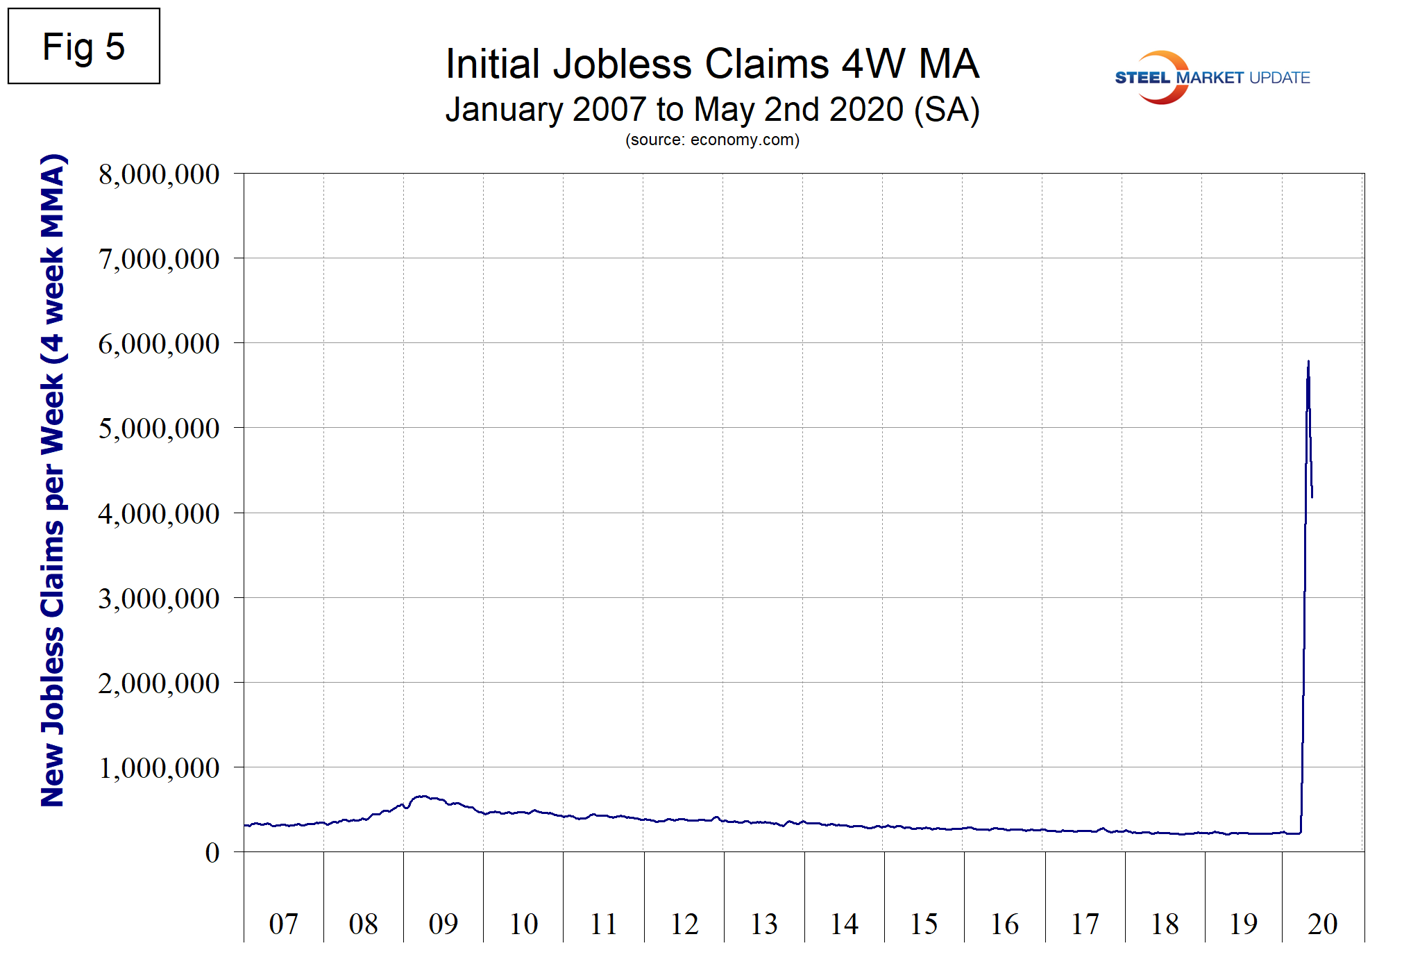
Initial claims for unemployment insurance, reported weekly by the Department of Labor, exploded in the week ending March 21 to 3.3 million from 282,000 in the previous week. The situation deteriorated to over 6 million new claims in each of the next two weeks. In the week ending May 2, the new claims had declined to 3.2 million. Figure 5 shows the four-week moving average of new claims since January 2007.
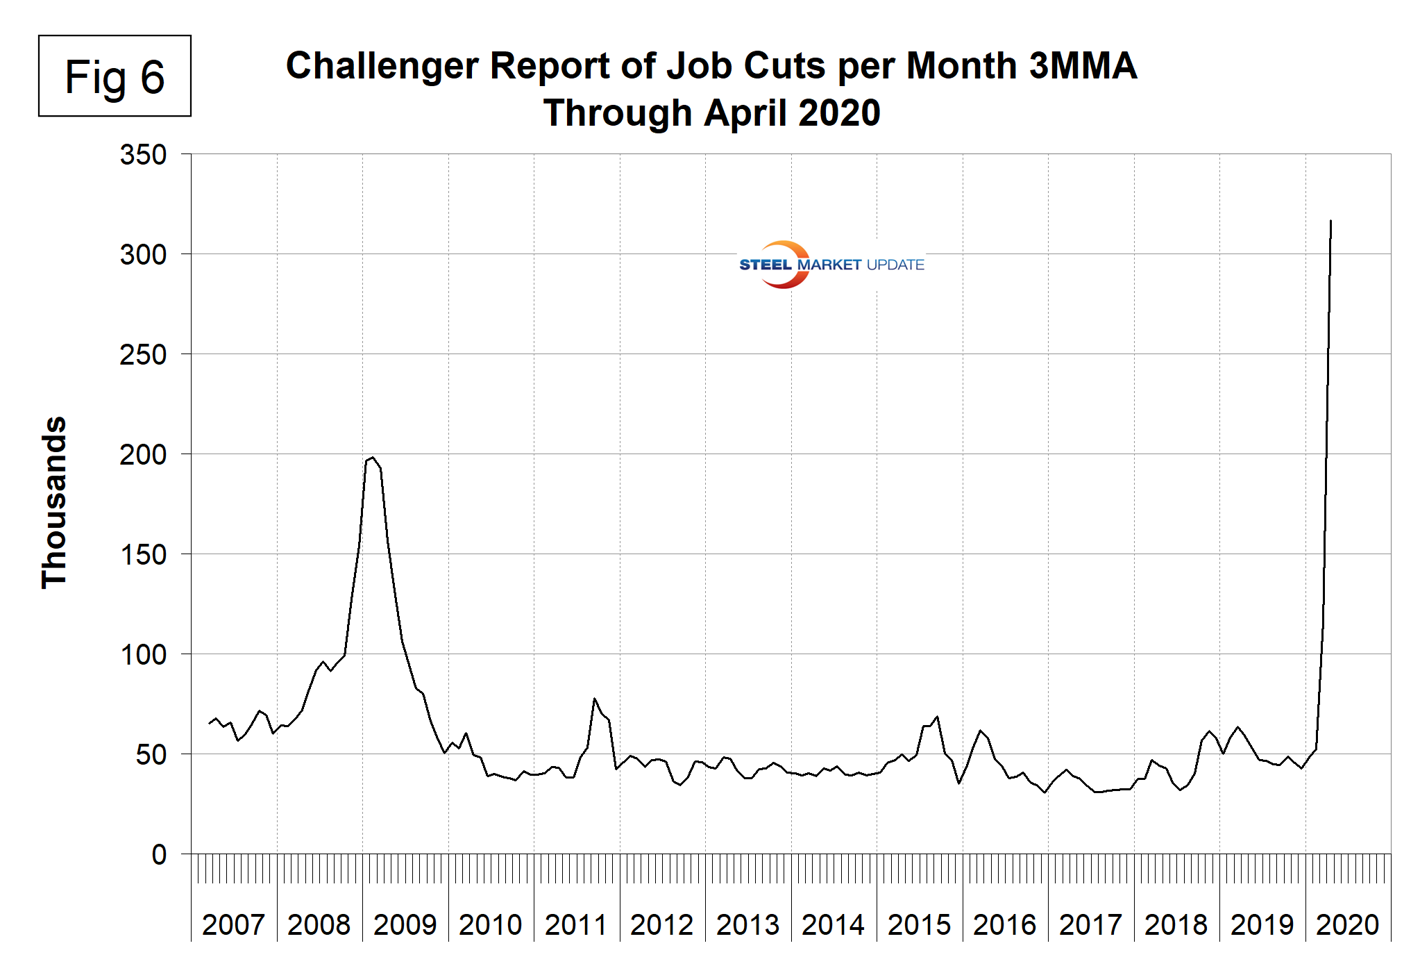
Challenger Grey and Christmas produces a monthly report of job cuts in the U.S. Job cuts increased from 56,700 in February to 222,300 in March and 671,100 in April. Challenger had the following to say on their website: “The vast majority of cuts came from companies in the Entertainment/Leisure sector, which includes bars, restaurants, hotels and amusement parks. So far this year, these companies have announced 415,206 cuts, 5,783 percent higher than the 7,058 announced in the first four months of 2019; 400,985 of these cuts were due to COVID-19. Retailers have announced the second-highest number of job cuts this year with 114,327 in total, 86,982 of which are due to COVID-19. This is 138 percent higher than the 48,076 cuts announced through the same period last year. The Services sector, which includes companies that provide catering, linen, marketing and administrative services, announced 73,137 cuts in 2020, 811 percent higher than the 8,032 cuts announced through the same period in 2019. The Automotive sector—including makers, suppliers and dealers—which prior to the pandemic was seeing fallout from a trade war, shifting consumer behavior and automation, has cut 56,292 jobs in 2020, up 184 percent from the 19,802 cuts announced through April last year. The COVID-19 pandemic is not the only cause for job cuts, although it is the reason for the vast majority. The ongoing downturn in oil was cited for 10,041 cuts in April and a total of 11,310 for the year. Company and plant closings have claimed 60,959 jobs this year. Restructuring was blamed for another 46,751 cuts, and market conditions claimed another 19,672.”
Figure 6 shows the 3MMA of job cuts since January 2007.
SMU Comment: Everything in the April jobs report points to an extremely severe time for our industry in the months ahead. Steel consumption will be driven down by a collapse in GDP, which in turn will be driven primarily by consumers’ unwillingness and inability to spend.
Explanation: On the first Friday of each month, the Bureau of Labor Statistics releases the employment data for the previous month. Data is available at www.bls.gov. The BLS reports on the results of two surveys. The Establishment survey reports the actual number employed by industry. The Household survey reports on the unemployment rate, participation rate, earnings, average workweek, the breakout into full-time and part-time workers and lots more details describing the age breakdown of the unemployed, reasons for and duration of unemployment. It’s important to understand that none of these numbers is an actual count of everyone employed across the country. No one keeps comprehensive records, and they’re certainly not processed centrally on a monthly basis. All the reported numbers are based on samples of the population.
At Steel Market Update, we track the job creation numbers by many different categories. The BLS database is a reality check for other economic data streams such as manufacturing and construction. We include the net job creation figures for those two sectors in our “Key Indicators” report. It is easy to drill down into the BLS database to obtain employment data for many subsectors of the economy such as truck transportation, auto production and primary metals production. Whenever possible, we try to track three separate data sources for a given steel-related sector of the economy. We believe this gives a reasonable picture of market direction. The BLS data is one of the most important sources of fine-grained economic data that we use in our analyses. The states also collect their own employment numbers independently of the BLS. The compiled state data compares well with the federal data. Every three months, SMU examines the state data and provides a regional report, which indicates strength or weakness on a geographic basis. Reports by individual state can be produced on request.


