

Market Data

April 6, 2020
BLS Reports Disastrous March Job Creation Numbers
Written by Peter Wright
The employment situation in the U.S. is a disaster. The current economic situation is so extraordinarily dire that historical data and trend analysis is almost irrelevant except to illustrate the severity of the situation we are all experiencing.
Net job creation in March was negative 701,000 and January was revised down by 59,000, according to Bureau of Labor Statistics data. February was revised up by 2,000. This only takes into account the changes in the first half of the month when the books were closed for the preliminary monthly assessment. Normally this is reasonably accurate, but not in today’s world. Moody’s estimates that job losses could be 10 times worse in April.
In their March summary, the BLS stated, “In April, we are likely to see much broader cuts devastating other ‘nonessential’ businesses, including retail, personal services, non-hospital or clinic healthcare and social services, private education, construction, and manufacturing. We are likely to see the full brunt of the shutdowns in April, and the unemployment rate could shoot up to 10 percent during the month. Other businesses will likely suffer due to the secondary effects of high unemployment, loss of confidence, fear and uncertainty.”
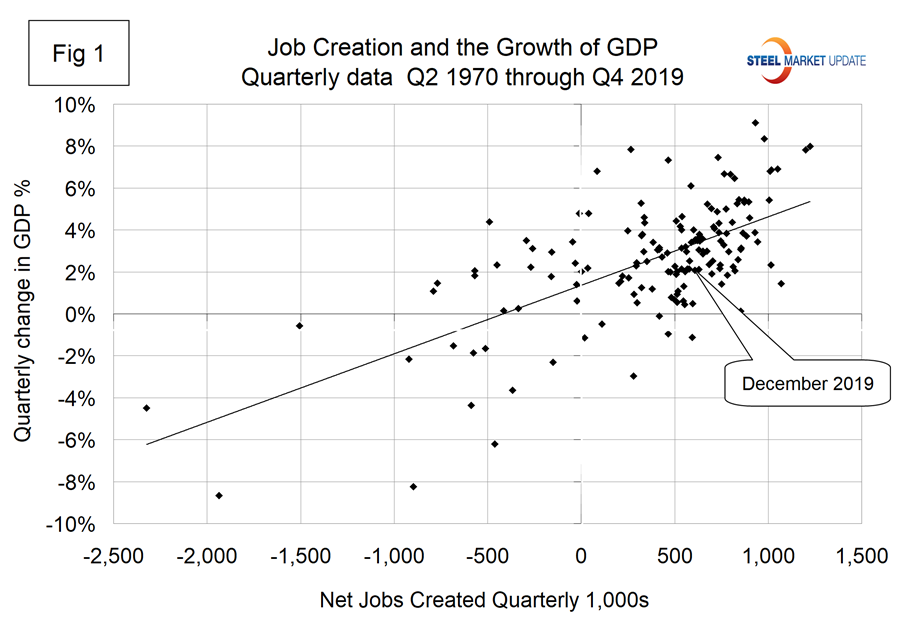
Personal consumption accounts for almost 70 percent of GDP and is driven by employment and wages. Figure 1 shows the loose relationship between job creation and GDP growth from Q1 1970 through Q4 2019. This suggests the possibility of a double-digit decline in GDP in Q2 2020.
Steel consumption is related to GDP; therefore, this is one of the indicators that help us understand where the steel market is headed. The COVID-19 virus is what economists call a black swan—a rare and inherently unforeseeable event with severe consequences.
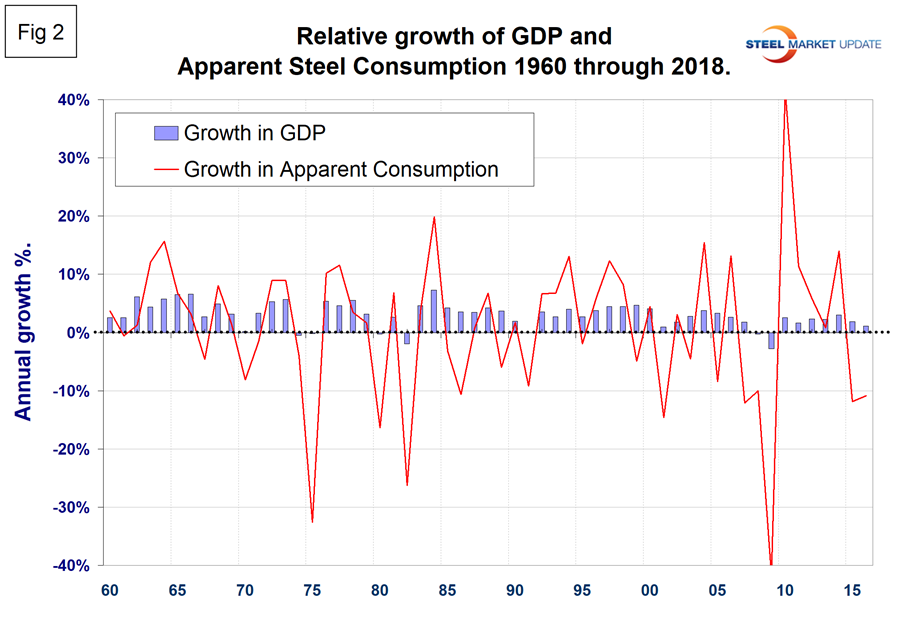
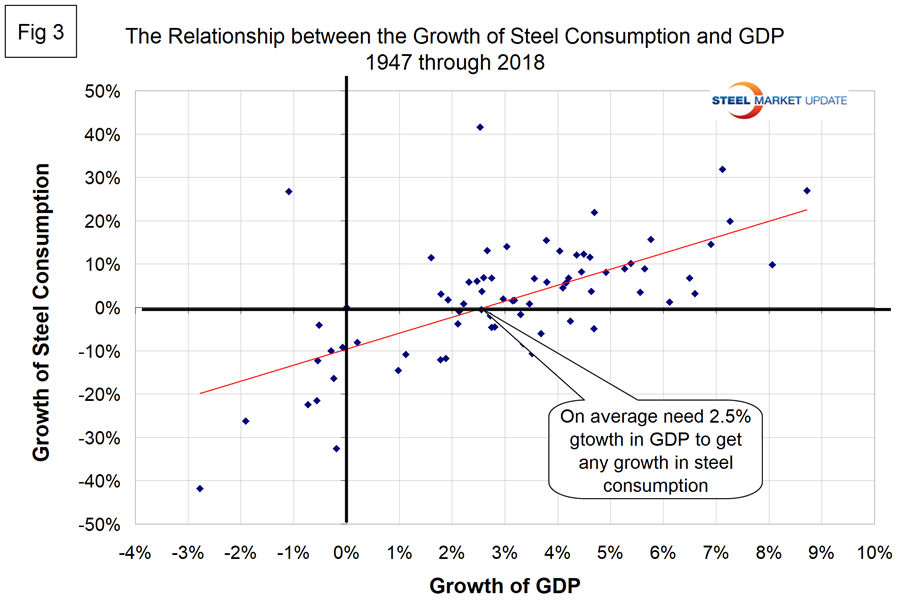
Figure 2 shows how steel consumption is whipsawed by changes in GDP, and Figure 3 is a scattergram of annual steel consumption and the growth of GDP since 1947.
Historical indications are that the next few months will be extremely tough for steel-related businesses.
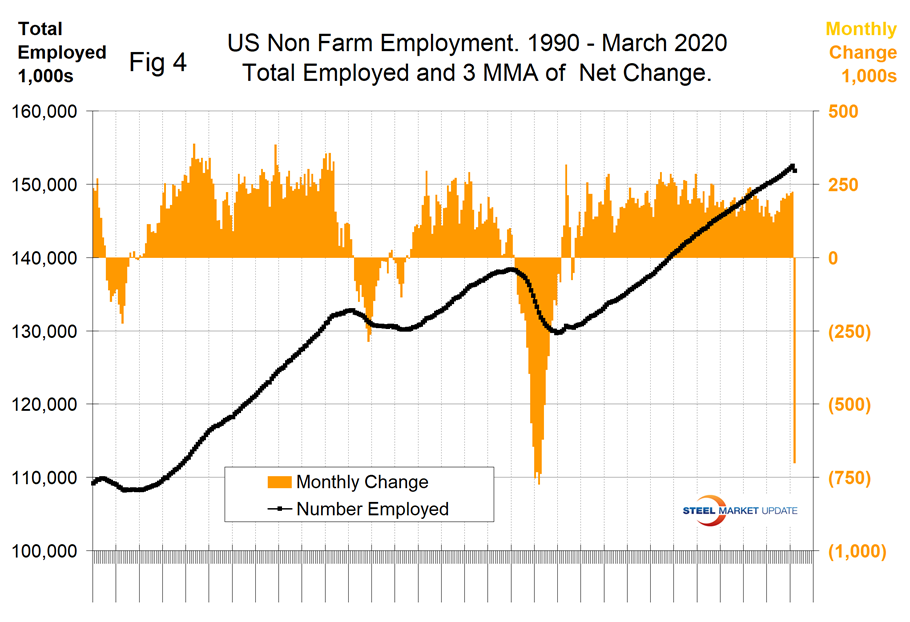
Figure 4 shows the number of jobs created monthly since 1990 as the brown bars and the total number employed as the black line.
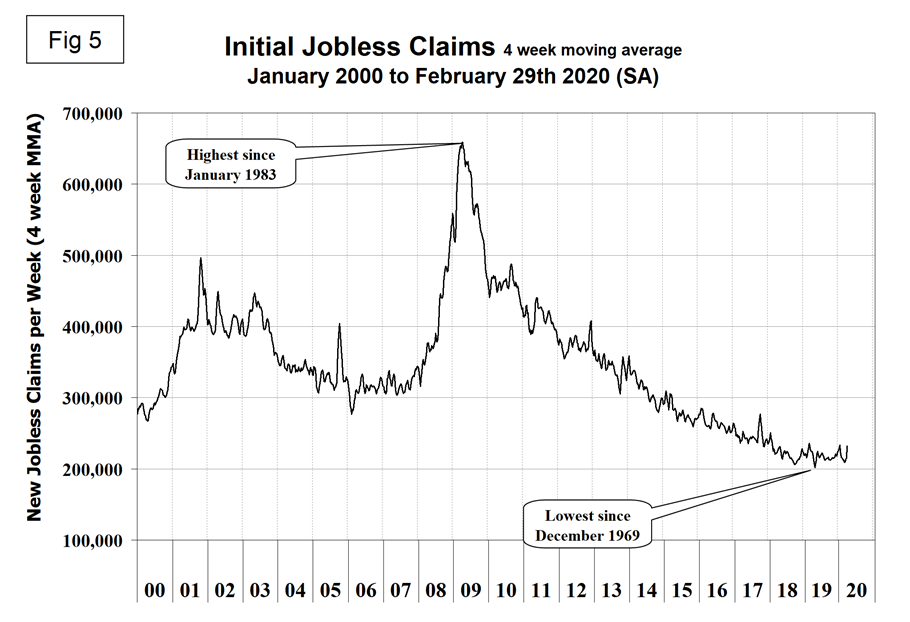
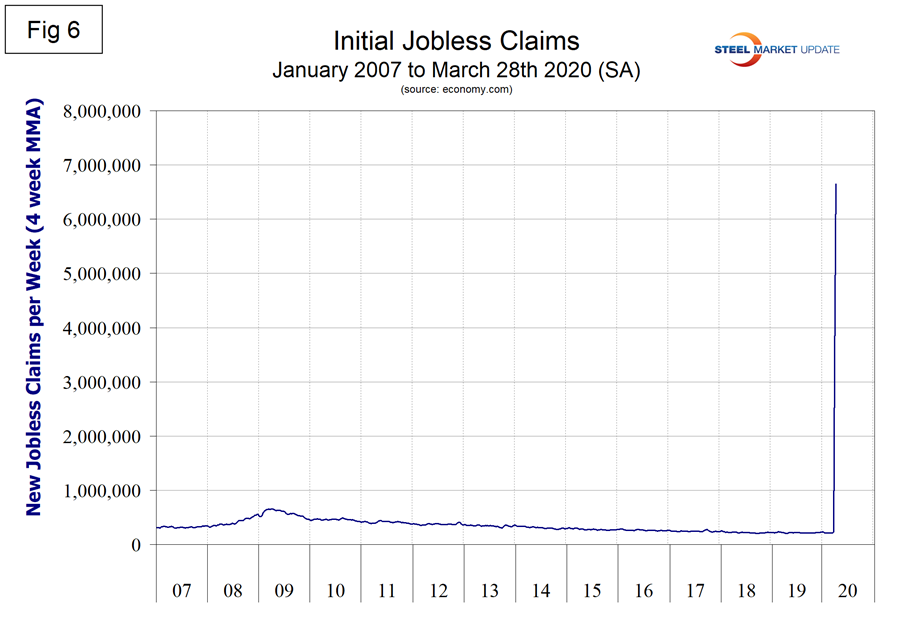
Initial claims for unemployment insurance, reported weekly by the Department of Labor, skyrocketed in the last two weeks of March. This broke the longest streak since 1973 of initial claims below 300,000. Figure 5 is the graph we included in last month’s employment report and Figure 6 shows the same graph through Marc—and that the situation during the Great Recession is now a mere blip. The previous record was set in the week ended Oct. 2, 1982, at 695,000 filings. Currently, initial claims are nearly 10 times higher than their previous record high.
SMU Comment: The coronavirus has been a disaster as far as the U.S. employment situation is concerned and this is about to spill over into steel demand. We have no idea how bad this could get, but the immediate future will be worse than 2009.
Explanation: On the first Friday of each month, the Bureau of Labor Statistics releases the employment data for the previous month. Data is available at www.bls.gov. The BLS reports on the results of two surveys. The Establishment survey reports the actual number employed by industry. The Household survey reports on the unemployment rate, participation rate, earnings, average workweek, the breakout into full-time and part-time workers and lots more details describing the age breakdown of the unemployed, reasons for and duration of unemployment. It’s important to understand that none of these numbers is an actual count of everyone employed across the country. No one keeps comprehensive records, and they’re certainly not processed centrally on a monthly basis. All the reported numbers are based on samples of the population. At Steel Market Update, we track the job creation numbers by many different categories. The BLS database is a reality check for other economic data streams such as manufacturing and construction. We include the net job creation figures for those two sectors in our “Key Indicators” report. It is easy to drill down into the BLS database to obtain employment data for many subsectors of the economy. For example, among hundreds of sub-indexes are truck transportation, auto production and primary metals production. The important point about all these data streams is the direction in which they are headed. Whenever possible, we try to track three separate data sources for a given steel-related sector of the economy. We believe this gives a reasonable picture of market direction. The BLS data is one of the most important sources of fine-grained economic data that we use in our analyses. The states also collect their own employment numbers independently of the BLS. The compiled state data compares well with the federal data. Every three months, SMU examines the state data and provides a regional report, which indicates strength or weakness on a geographic basis. Reports by individual state can be produced on request.


