Analysis

April 24, 2020
Automotive Assemblies Take a Nosedive in March
Written by Tim Triplett
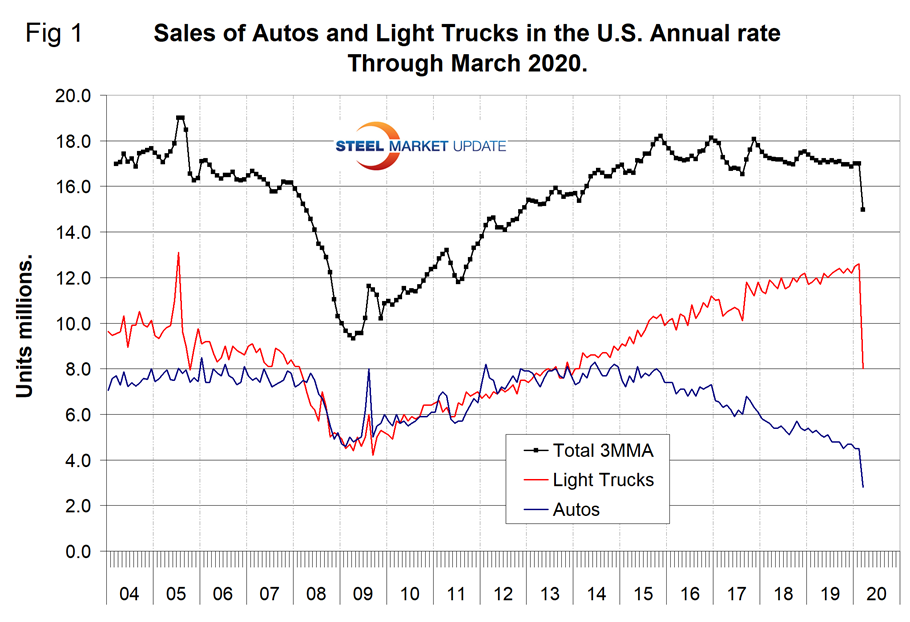
Automotive assemblies in North America nosedived in March as vehicle manufacturers shut down their plants to protect their employees from the spread of the coronavirus. Most plants ceased operations in mid-March, so the data does not reflect a full month of shutdowns, thus the effect may be even more pronounced in April.
Data from LMC Automotive for automotive assemblies in the U.S., Canada and Mexico shows that sales were down by 58.3 percent in March compared with the prior month. Autos were down by 60.7 percent and light trucks (pickups, SUVs and crossovers) were down by 57.5 percent month over month (Figure 1).
North American Assemblies
North American automakers produced light vehicles at an annual rate of 11.8 million units in March, down from 17.2 million in November. Normally, March increases by an average of 5.6 percent from February due to the usual seasonality, but the rest of this year will be anything but normal.
Figure 4 shows the production in North America on a rolling 12-month basis as the blue line and the year-over-year growth as the brown bars. The current downturn is modest so far, compared with the recession in 2009.
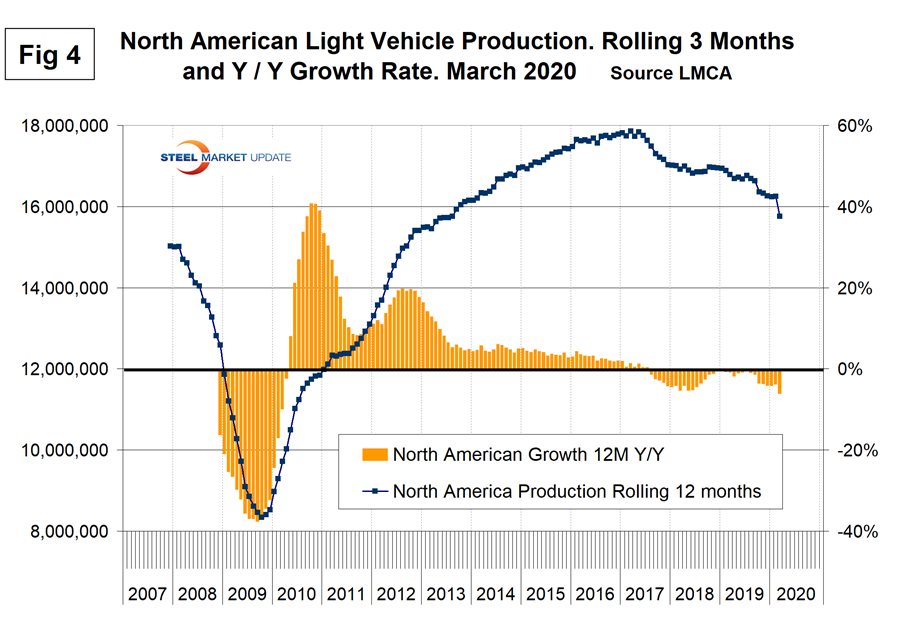
Table 1 is a short-term snapshot of assembly by nation and vehicle type. It breaks down total North American personal and commercial vehicle production into the U.S, Canada and Mexican components and the three- and 12-month growth rates for each. At the far right it shows the momentum for the total and for each of the three nations.
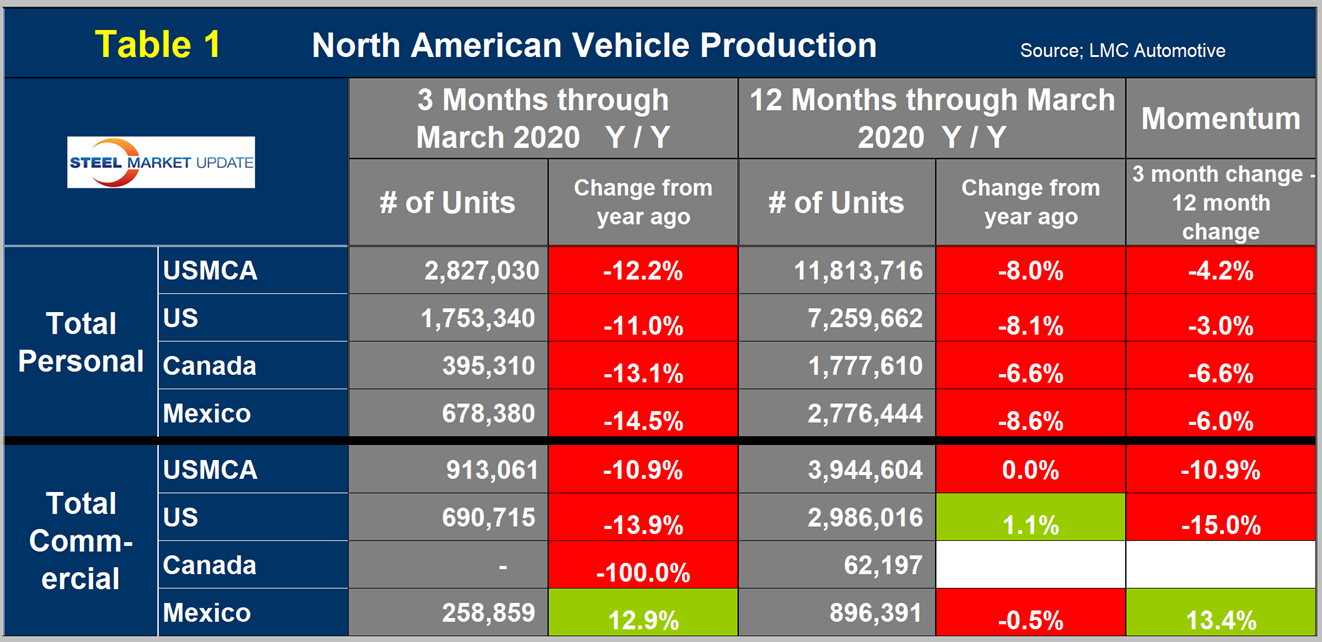
In three months through March, the only sector to have positive growth was commercial vehicles in Mexico. Commercial vehicle production in Canada in the first quarter was zero; clearly this production has moved to Mexico.
Want to Dig Deeper?
Steel Market Update’s automotive trends data dates back to 2007. To explore the rest of the historical data, below, click here:
Figure 2: Import Market Share, U.S. Auto and Light Truck Sales, January 2004-2020
Figure 3: Average Monthly Production 2011-March 2020, Total North American Vehicle Assemblies
Figure 5: Personal Vehicle Production, U.S., Canada, Mexico, January 2007-March 2020
Figure 6: U.S. Personal Vehicle Production, Rolling Three Months and Y/Y Growth Rate, March 2020
Figure 7: Canada, Personal Vehicle Production, Rolling Three Months and Y/Y Growth Rate, March 2020
Figure 8: Mexico Personal Vehicle Production, Rolling Three Months and Y/Y Growth Rate, March 2020
Figure 9: Personal Vehicle Share, U.S., Mexico, Canada, January 2007-March 2020
Figure 10: Commercial Vehicle Production, U.S., Canada, Mexico, January 2007-March 2020
Figure 11: U.S. Commercial Vehicle Production, Rolling Three Months and Y/Y Growth Rate, March 2020
Figure 12: Canada Commercial Vehicle Production, Rolling Three Months, January 2007-March 2020
Figure 13: Mexico Commercial Vehicle Production, Rolling Three Months and Y/Y Growth Rate 2020
Figure 14: Commercial Vehicle Share, U.S., Mexico, Canada, January 2007-March 2020