

Market Data

June 5, 2020
BLS Data Shows Surprising Job Gains in May
Written by Peter Wright
There was positive net job creation in May following April’s disastrous report.
The May jobs report was released by the Bureau of Labor Statistics on Friday, after which the N.Y. Times reported: “Employers added 2.5 million jobs in May, defying economists’ expectations of further losses and offering hope that the rebound from the pandemic-induced economic crisis could be faster than forecast. Still, job openings remain far below normal, and the trillions of dollars in government assistance that have helped keep the economy on life support may be nearing their end.”
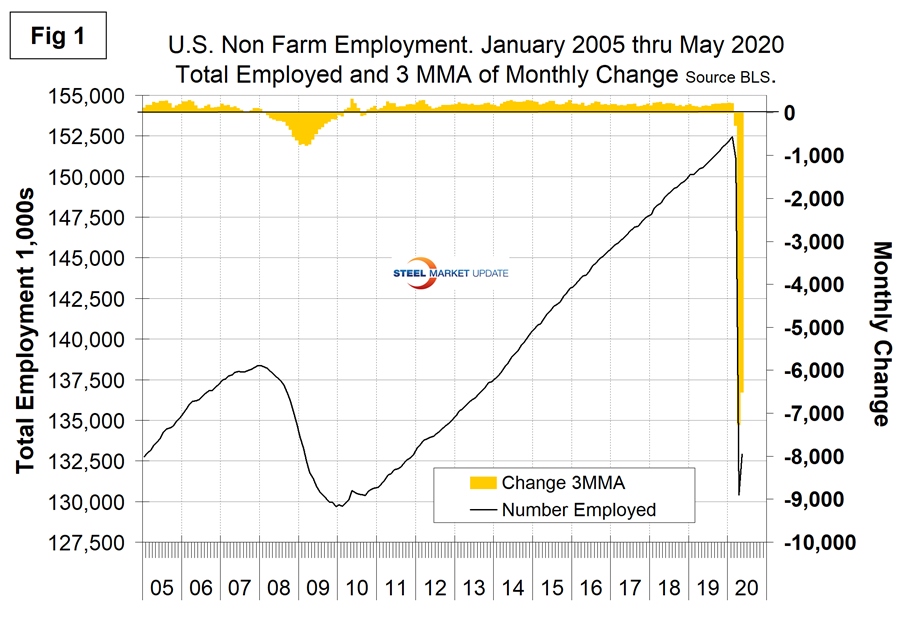
Figure 1 shows the three-month moving average (3MMA) of the number of jobs created or lost through May since 2005 as the brown bars and the total number employed as the black line. The Great Recession of 2008-09 appears as a mere bump in the road. In the single month of May, 2,509,000 jobs were created, following April’s loss of 20,687,000 jobs. Since Figure 1 is a 3MMA, it doesn’t reflect how bad April was. Employment and wages are the main contributors to GDP because personal consumption accounts for almost 70 percent of the total. Steel consumption is related to GDP but is much more volatile. Therefore, this is another insight into how bad the second quarter was and the third quarter will be for steel-related industries.
One caveat to these job loss numbers was hinted at by the Congressional Budget Office in their June 4 report: Economic Effects of Additional Unemployment Benefits of $600 per Week. “Under the Coronavirus Aid, Relief, and Economic Security (CARES) Act, the increase in unemployment benefits for roughly five of every six recipients will exceed the weekly amounts they could expect to earn from work. The estimated effects on output and employment are the net results of two opposing factors. An extension of the additional benefits would boost the overall demand for goods and services, which would tend to increase output and employment. There is also a weaker incentive to work as people compare the benefits available during unemployment to their potential earnings, and those weakened incentives would in turn tend to decrease output and employment.”
According to the June 5 BLS economic news release, “Total nonfarm payroll employment increased by 2.5 million in May, reflecting a limited resumption of economic activity that had been curtailed due to the coronavirus pandemic and efforts to contain it. Employment fell by 1.4 million and 20.7 million, respectively, in March and April. Large employment increase occurred in May in leisure and hospitality, construction, education and health services, and retail trade. Government employment continued to decline sharply.”
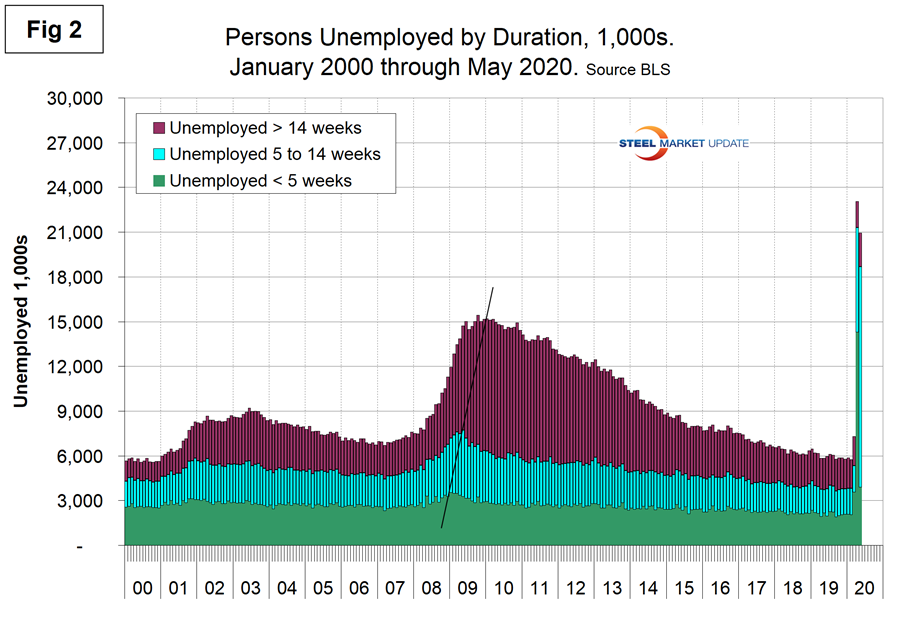
Figure 2 shows the historical picture for the duration of unemployment since January 2000 broken down into < 5 weeks, 5 to 14 weeks and > 14 weeks. The total number unemployed was 20,931,000.
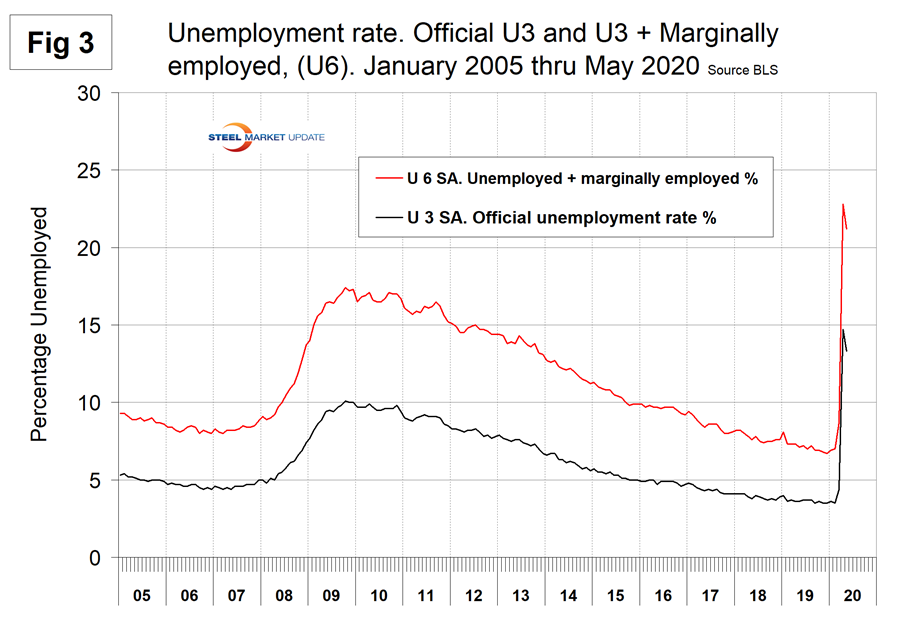
The official unemployment rate, U3, reported in the BLS Household survey (see explanation below) increased from 3.5 percent in February to 4.4 percent in March, to 14.7 percent in April and declined to 13.3 percent in May. This is not a very representative number. The more comprehensive U6 unemployment rate, at 21.2 percent in May, improved from 22.8 percent in April (Figure 3). U6 includes individuals working part time who desire full-time work and those who want to work but are so discouraged they have stopped looking.
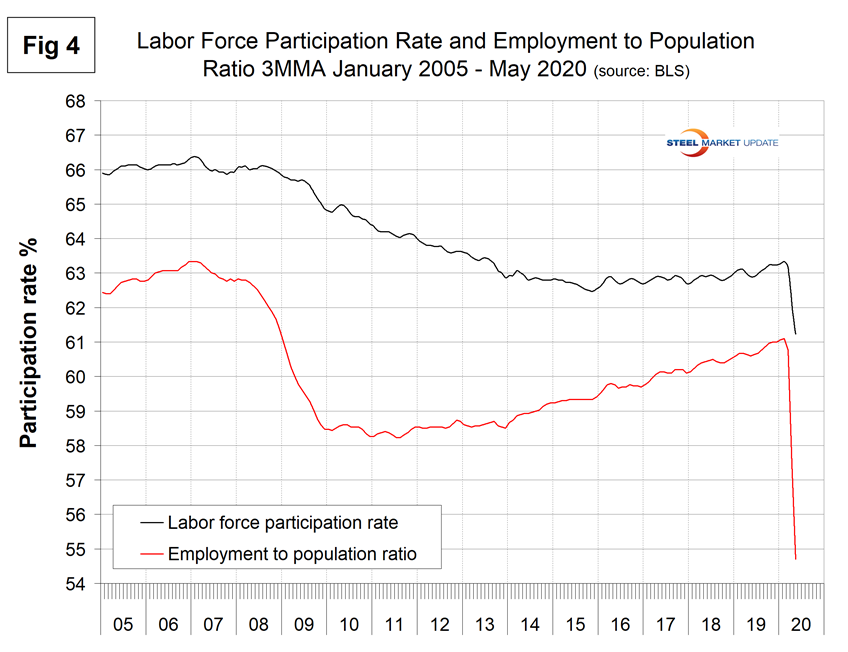
The labor force participation rate is calculated by dividing the number of people actively participating in the labor force by the total number of people eligible to participate. This measure was 60.8 percent in May, up from 60.2 percent in April but down from 63.4 percent in January and February. Another gauge is the number employed as a percentage of the population, which we think is more definitive. In May, the employment-to-population ratio was 52.8 percent, up from 51.3 percent in April. Figure 4 shows both measures on one graph.
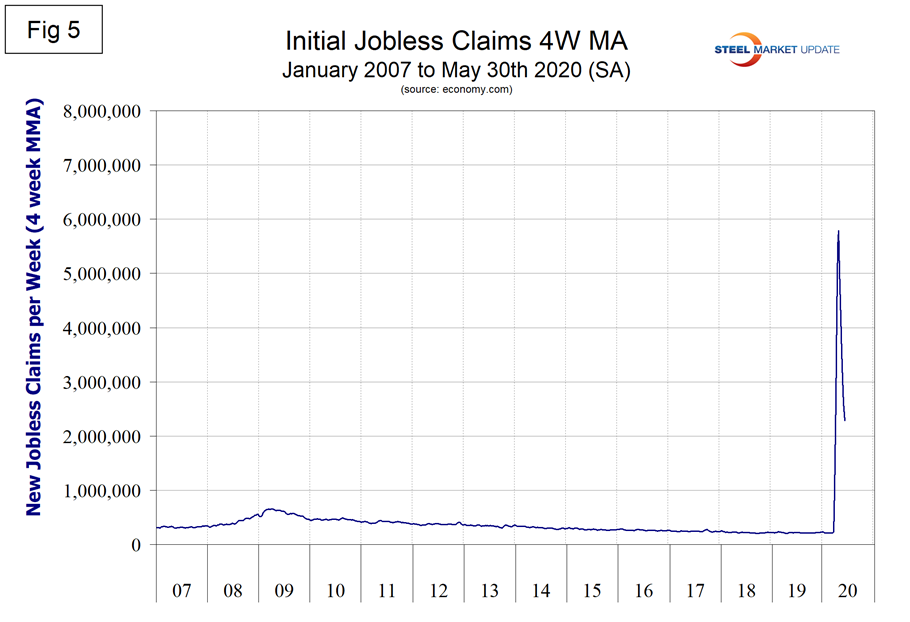
Initial claims for unemployment insurance, reported weekly by the Department of Labor, exploded in the two weeks ending March 21 and March 28 by a total of 6.6 million. Since then new claims have declined every week to a value of 1.9 million in the week ending May 30. Figure 5 shows the four-week moving average of new claims since January 2007.
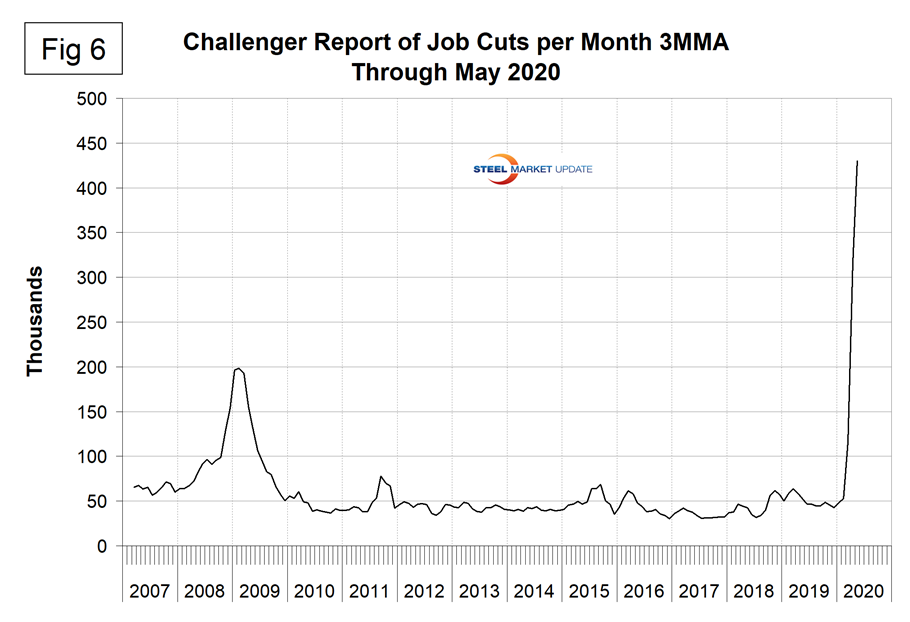
Challenger Grey and Christmas Inc. produce a monthly report of job cuts in the U.S. and reported that job cuts increased from 56,700 in February to 671,000 in April and declined to 397,000 in May. Challenger had the following to say on their website: “By far, the majority of cuts came from Entertainment/Leisure companies, including bars, restaurants, hotels, and amusement parks, which announced 163,680 cuts in May, a 15,900% increase over the 1,023 Entertainment/Leisure cuts tracked in the same month last year. So far this year, these companies have announced 578,886 cuts, a 7,063.5% increase over the 8,081 cuts announced in the sector through May 2019. Retailers have announced the second-highest number of job cuts this year with 151,416, 201.4% higher than the 50,243 cuts announced through the same period last year. The Services sector, which includes companies that provide catering, linen, marketing, and administrative services, announced 107,366 cuts so far in 2020, 846% higher than the 11,348 cuts announced through the same period in 2019. The Automotive sector, including makers, suppliers, and dealers, has cut 73,576 jobs in 2020, up 243% from the 21,446 cuts announced through May 2019.”
Figure 6 shows the 3MMA of job cuts since January 2007.
SMU Comment: Even though this jobs report surprised to the upside, the employment situation is still dire and likely to remain so for the rest of the year. Steel consumption is being driven down by a collapse in GDP, which in turn will be driven primarily by consumers unwillingness and inability to spend.
Explanation: On the first Friday of each month, the Bureau of Labor Statistics releases the employment data for the previous month. Data is available at www.bls.gov. The BLS reports on the results of two surveys. The Establishment survey reports the actual number employed by industry. The Household survey reports on the unemployment rate, participation rate, earnings, average workweek, the breakout into full-time and part-time workers and lots more details describing the age breakdown of the unemployed, reasons for and duration of unemployment. It’s important to understand that none of these numbers is an actual count of everyone employed across the country. No one keeps comprehensive records, and they’re certainly not processed centrally on a monthly basis. All the reported numbers are based on samples of the population. At Steel Market Update, we track the job creation numbers by many different categories. The BLS database is a reality check for other economic data streams such as manufacturing and construction. We include the net job creation figures for those two sectors in our “Key Indicators” report. It is easy to drill down into the BLS database to obtain employment data for many subsectors of the economy. For example, among hundreds of sub-indexes are truck transportation, auto production and primary metals production. The important point about all these data streams is the direction in which they are headed. Whenever possible, we try to track three separate data sources for a given steel-related sector of the economy. We believe this gives a reasonable picture of market direction. The BLS data is one of the most important sources of fine-grained economic data that we use in our analyses. The states also collect their own employment numbers independently of the BLS. The compiled state data compares well with the federal data. Every three months, SMU examines the state data and provides a regional report, which indicates strength or weakness on a geographic basis. Reports by individual state can be produced on request.


