

Market Data
June 5, 2020
Employment by Industry in May
Written by Peter Wright
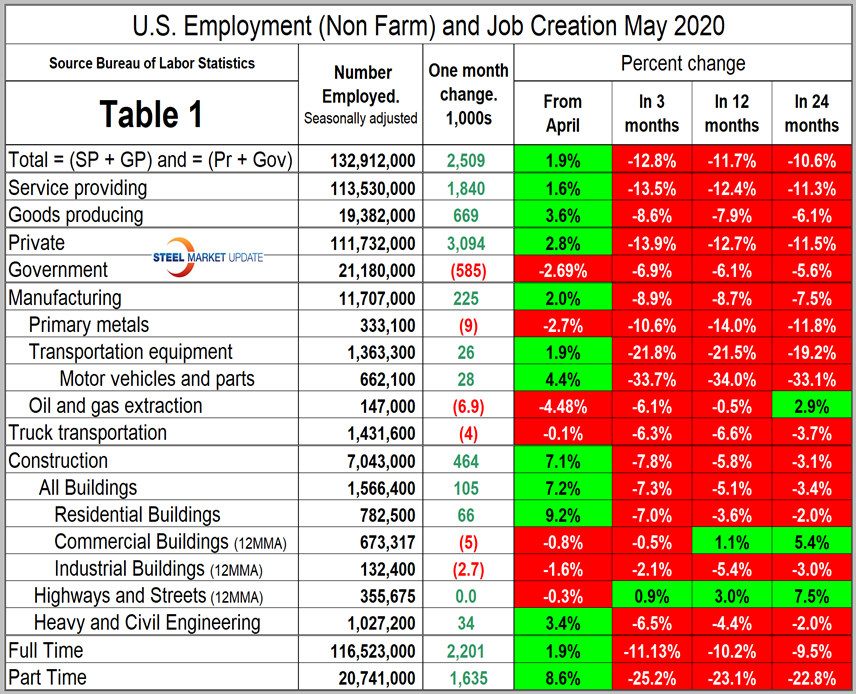
In May, manufacturing gained back 17 percent of April’s job losses, while construction gained back 47 percent, according to the latest Bureau of Labor Statistics data. The net change in employed persons was negative 20.7 million in April and positive 2.5 million in May.
Table 1 breaks total employment down into service and goods-producing industries and then into private and government employees. Most of the goods-producing employees work in manufacturing and construction and the components of these two sectors of most relevance to steel people are broken out in Table 1. Note, the subcomponents of both manufacturing and construction shown in Table 1 don’t add up to the total because we have only included those with the most relevance to the steel industry.
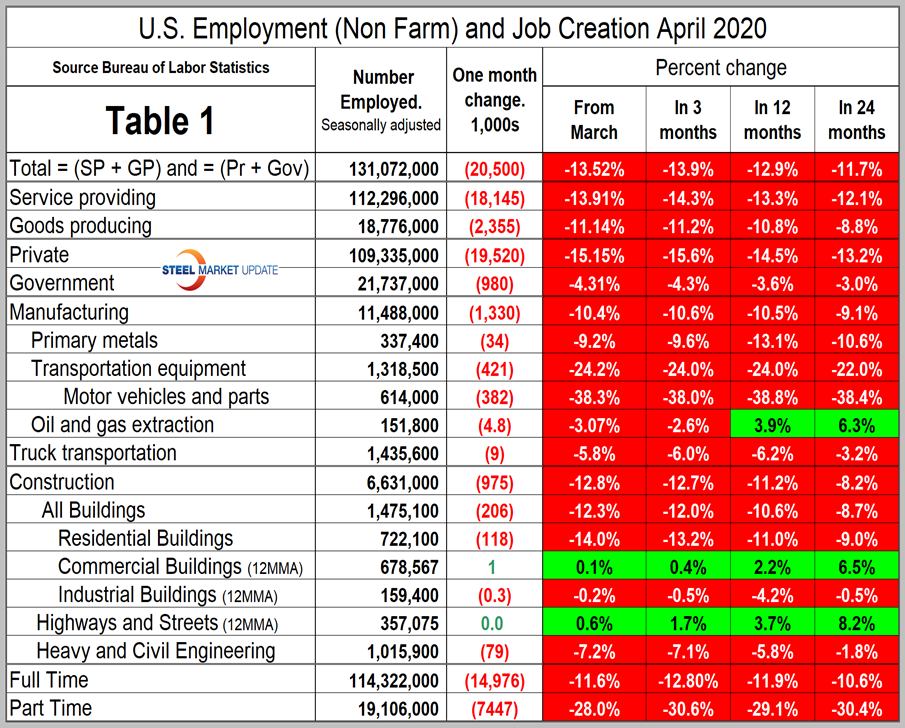
For comparison we include here the April version of Table 1.
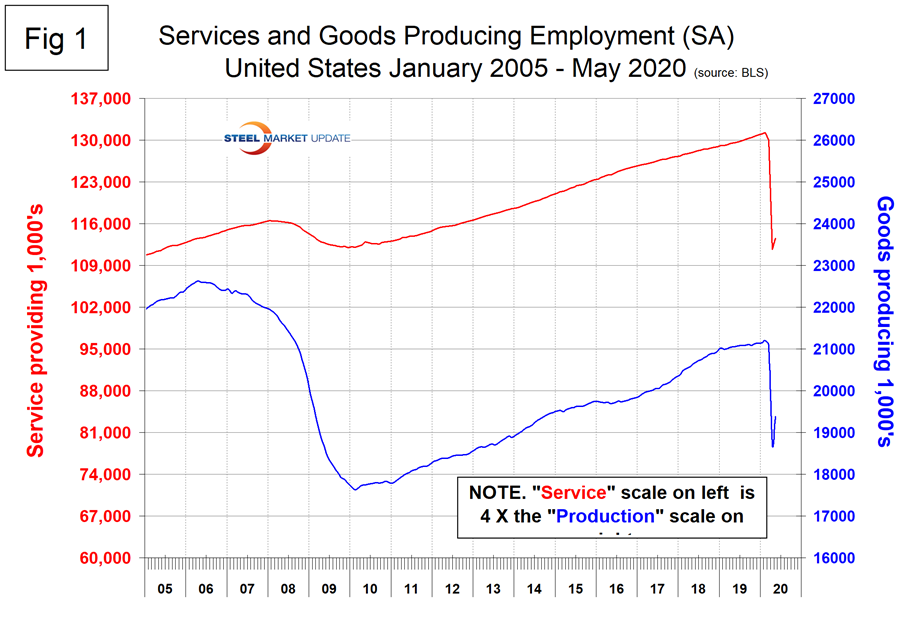
Comparing service industries to goods-producing industries in May and April shows services to be up by 1.6 percent and goods-producing up by 3.6 percent (Figure 1).
Goods-producing is comprised mainly of manufacturing and construction employment. Again, comparing May to April, manufacturing was up 2.0 percent and construction was up by 7.1 percent. The BLS had this to say about manufacturing and construction employment in their June 5 report: “In May, manufacturing employment rose by 225,000, with gains about evenly split between the durable and nondurable goods components. In April, manufacturing employment declined by 1.3 million, with about two-thirds of the loss occurring in the durable goods component. Within durable goods, employment gains in May were led by motor vehicles and parts (+28,000), fabricated metal products (+25,000), and machinery (+23,000). Within nondurable goods, job gains occurred in plastics and rubber products (+30,000) and food manufacturing (+25,000).
“Construction employment increased by 464,000 in May, gaining back almost half of April’s decline (-995,000). Much of the gain occurred in specialty trade contractors (+325,000), with growth about equally split between the residential and nonresidential components. Job gains also occurred in construction of buildings (+105,000), largely in residential building.”
Figure 2 shows the level of employment in these two sectors since January 2005.
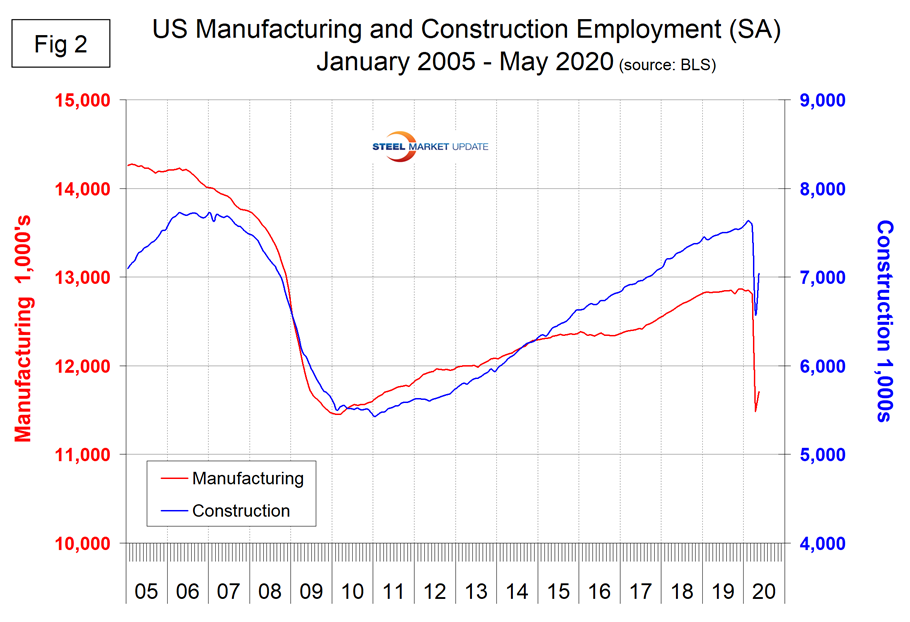
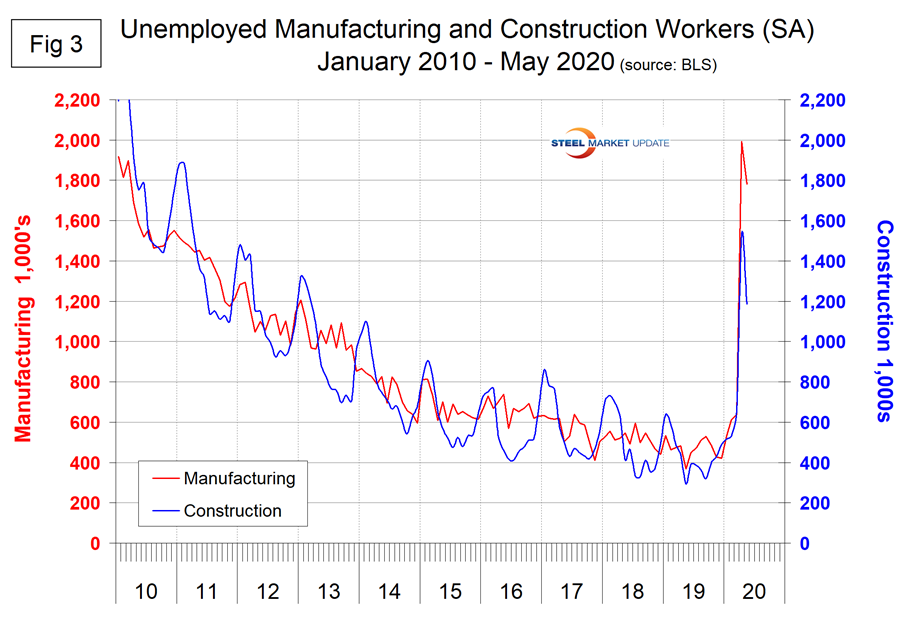
Figure 3 shows the reported number of unemployed manufacturing and construction workers. These were 1.8 million and 1.2 million, respectively.
SMU Comment: The May employment report was a surprise to the upside as most economists had expected losses to continue. However, the level of employment has given back almost all the gains made since the Great Recession. Steel consumption is related to GDP but is vastly more volatile. Over two-thirds of GDP is driven by consumer spending, but in May consumer confidence was lower than at any time since February 2014. It will take months for his/her confidence to recover and that won’t begin until the pandemic is under control. Steel demand won’t recover to its 2019 level for at least the rest of this year.
Explanation: On the first or second Friday of each month, the Bureau of Labor Statistics releases the employment data for the previous month. Data is available at www.bls.gov. The BLS employment database is a reality check for other economic data streams such as manufacturing and construction. It is easy to drill down into the BLS database to obtain employment data for many subsectors of the economy. The important point about all these data streams is the direction in which they are headed.


