

Market Data
July 7, 2020
BLS Data Shows More Job Gains in June
Written by Peter Wright
The U.S. economy added 4.8 million jobs in June, exceeding analysts’ expectations once again, according to data released Thursday by the Bureau of Labor Statistics. May’s job gain was revised up by 160,000 to 2,699,000.
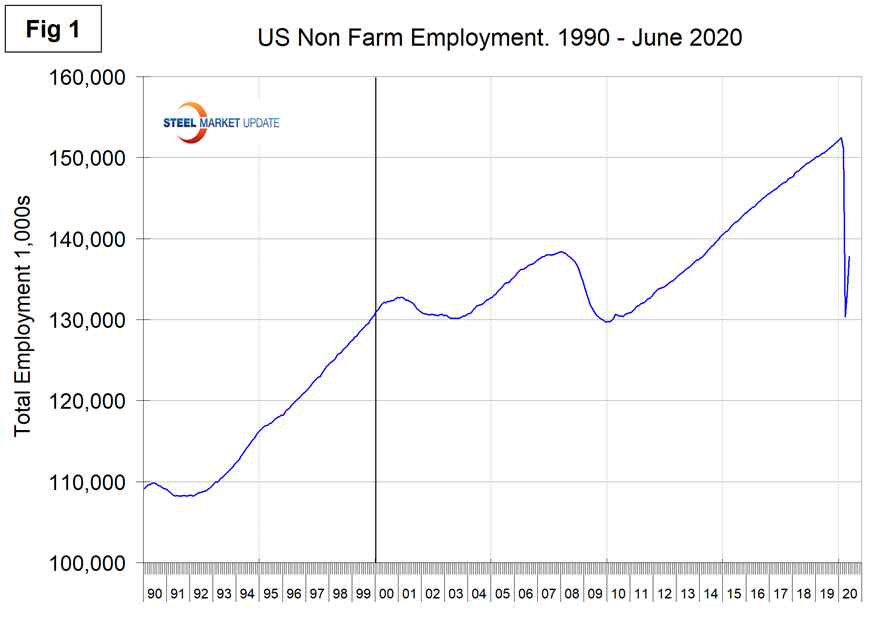
Figure 1 shows the total number of nonfarm workers in the U.S. since 1990. The net loss since February’s all-time high result stands at 14,661,000. GDP declined by 5.0 percent in the first quarter. Employment and wages are the main contributors to GDP because personal consumption accounts for almost 70 percent of the total. Steel consumption is related to GDP, but is much more volatile. Therefore, this is another insight into how bad the second quarter was and how bad the third quarter is likely to be for steel-related industries.
“Total nonfarm payroll employment rose by 4.8 million in June, and the unemployment rate declined to 11.1 percent. These improvements in the labor market reflected the continued resumption of economic activity that had been curtailed in March and April due to the coronavirus (COVID-19) pandemic and efforts to contain it. In June, employment in leisure and hospitality rose sharply. Notable job gains also occurred in retail trade, education and health services, other services, manufacturing, and professional and business services,” reported the BLS.
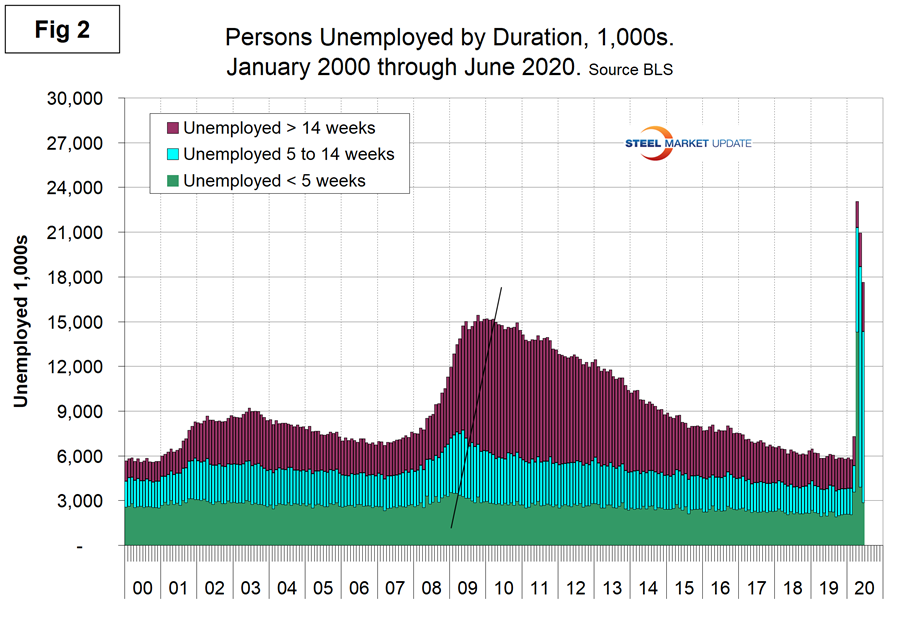
Figure 2 shows the historical picture for the duration of unemployment since January 2000 broken down into <5 weeks, 5 to 14 weeks and >14 weeks. The total number unemployed was 17,628,000 at the end of June, down from 20,931.000 at the end of May.
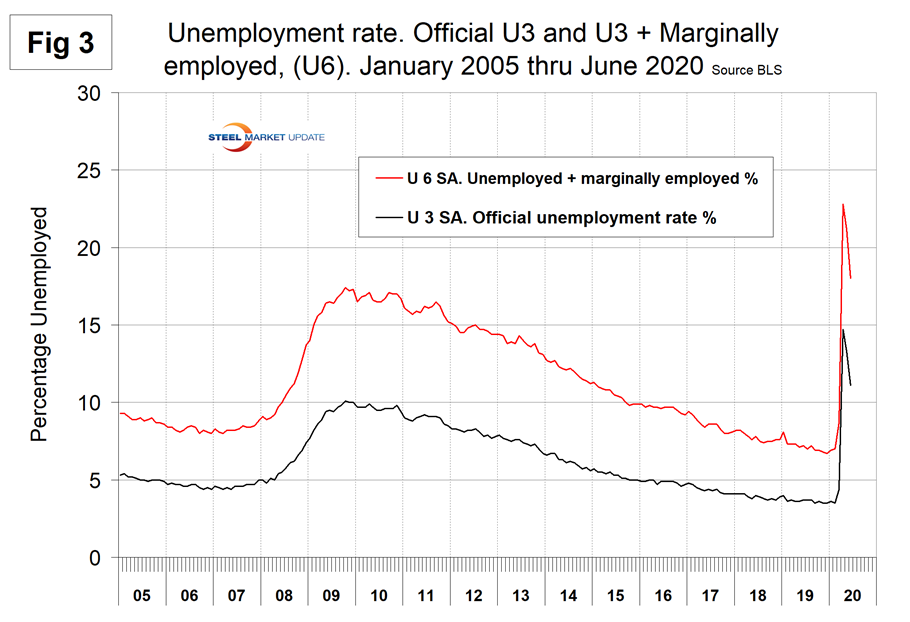
The official unemployment rate, U3, reported in the BLS Household survey (see explanation below) increased from 3.5 percent in February to 14.7 percent in April and declined to 11.1 percent in June. This is not a very representative number. The more comprehensive U6 unemployment rate at 18.0 percent in June improved from 22.8 percent in April (Figure 3). U6 includes individuals working part time who desire full-time work and those who want to work but are so discouraged they have stopped looking.
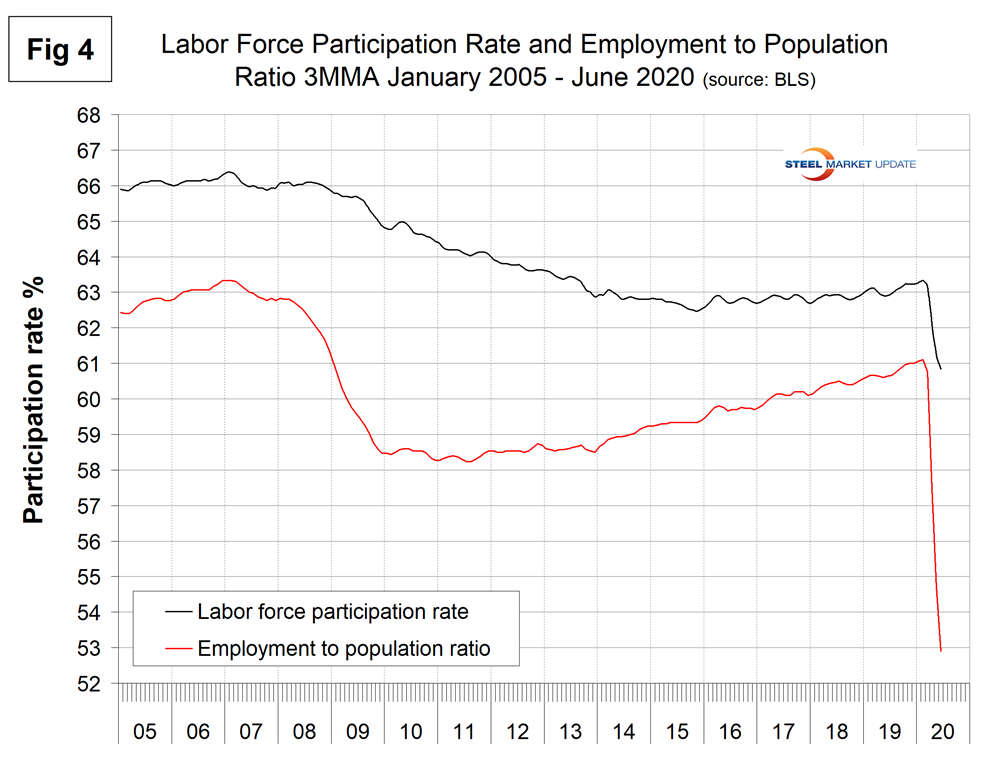
The labor force participation rate is calculated by dividing the number of people actively participating in the labor force by the total number of people eligible to participate. This measure was 61.5 percent in June, up from 60.2 percent in April but down from 63.4 percent in January and February. Another gauge is the number employed as a percentage of the population, which we think is more definitive. In June, the employment-to-population ratio was 54.6 percent, up from 51.3 percent in April. Figure 4 shows both measures on one graph.
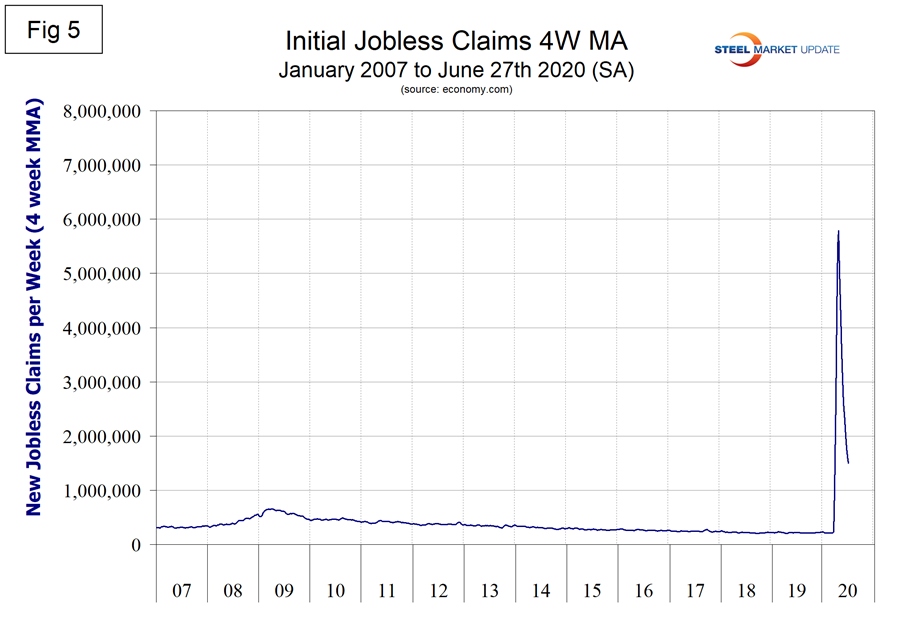
Initial claims for unemployment insurance, reported weekly by the Department of Labor, exploded in the two weeks ending March 21 and March 28 by a total of 6.6 million. Since then through the week ending June 27, new claims have declined every week to a value of 1.427 million. Figure 5 shows the four-week moving average of new claims since January 2007.
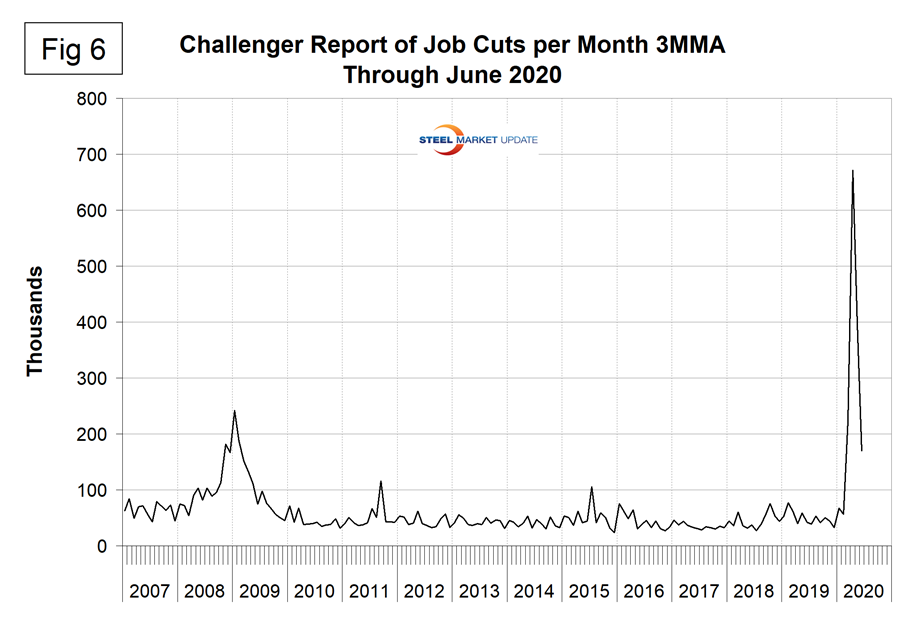
Challenger, Gray and Christmas Inc. produce a monthly employment update for the U.S. and reported that job cuts increased from 56,700 in February to 671,000 in April, then declined to 397,000 in May and 170,000 in June. “Job cuts announced by U.S.-based employers hit 1,238,364 in the second quarter, the highest quarterly total on record. June job cuts totaled 170,219, down 57 percent from May’s total of 397,016, and up 306 percent from the 41,977 cuts recorded in the same month last year. Job cuts are trending down, as expected, as businesses begin the difficult task of reopening. However, with a resurgence in cases, millions of Americans out of work, and enhanced unemployment benefits coming to an end soon, we may expect more companies to make cuts as consumer and business spending slows,” said Andrew Challenger, senior vice president of the executive outplacement firm. “While COVID-19 was cited as the reason for 1,011,387 of the 1,585,047 cuts this year, market conditions were to blame for 228,592. Another 71,814 cuts were due to closings and 62,564 were due to a demand downturn. So far this year, Challenger has tracked 16,805 cuts due to the downturn in oil prices.”
Figure 6 shows the monthly number of job cuts since January 2007.
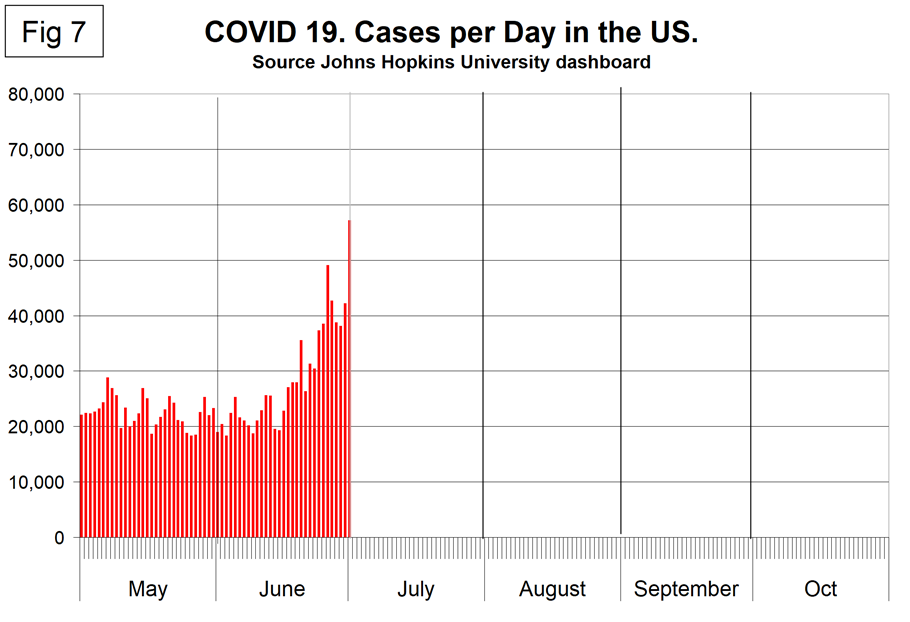
SMU Comment: The employment reports of May and June were better than expected after a disastrous April, but this may be a lull in the storm. New cases of COVID-19 infections surged on July 1 to 57,215 and many states have reintroduced business restrictions. Figure 7 shows the daily new case count since May 1. People are once again taking the pandemic seriously, increasing their unwillingness and inability to spend, which will in turn put downward pressure on GDP and steel consumption.
Explanation: On the first Friday of each month, the Bureau of Labor Statistics releases the employment data for the previous month. Data is available at www.bls.gov. The BLS reports on the results of two surveys. The Establishment survey reports the actual number employed by industry. The Household survey reports on the unemployment rate, participation rate, earnings, average workweek, the breakout into full-time and part-time workers and lots more details describing the age breakdown of the unemployed, reasons for and duration of unemployment. It’s important to understand that none of these numbers is an actual count of everyone employed across the country. No one keeps comprehensive records, and they’re certainly not processed centrally on a monthly basis. All the reported numbers are based on samples of the population. Steel Market Update tracks the job creation numbers by many different categories. The BLS database is a reality check for other economic data streams such as manufacturing and construction. SMU includes the net job creation figures for those two sectors in our “Key Indicators” report. It is easy to drill down into the BLS database to obtain employment data for many subsectors of the economy. For example, among hundreds of sub-indexes are truck transportation, auto production and primary metals production. The important point about all these data streams is the direction in which they are headed.


