

Market Data
July 7, 2020
Employment by Industry in June
Written by Peter Wright
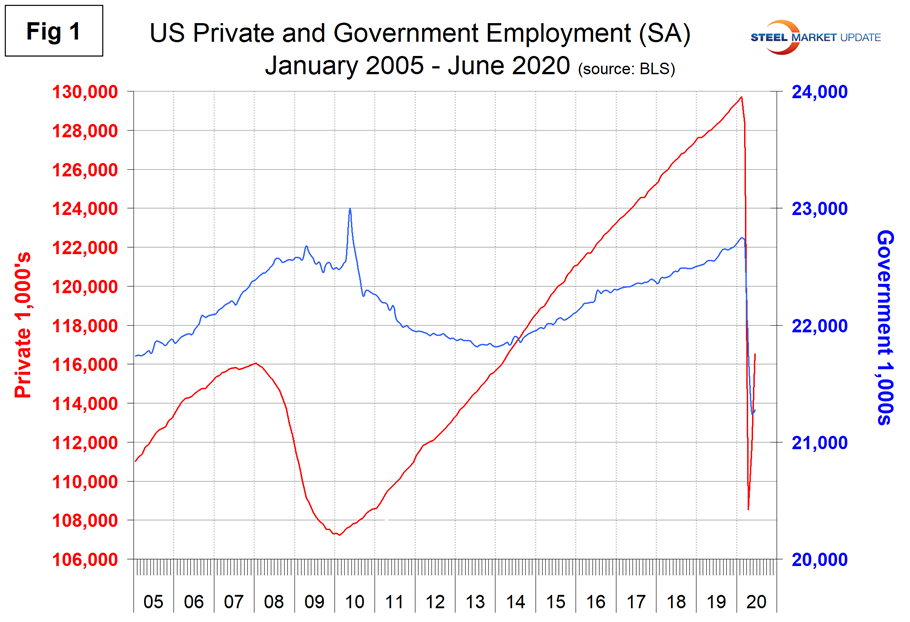
Manufacturing and construction both saw positive growth in employment in June. The net change in employed persons was negative 20.8 million in April followed by positive 2.7 million in May and positive 4.8 million in June.
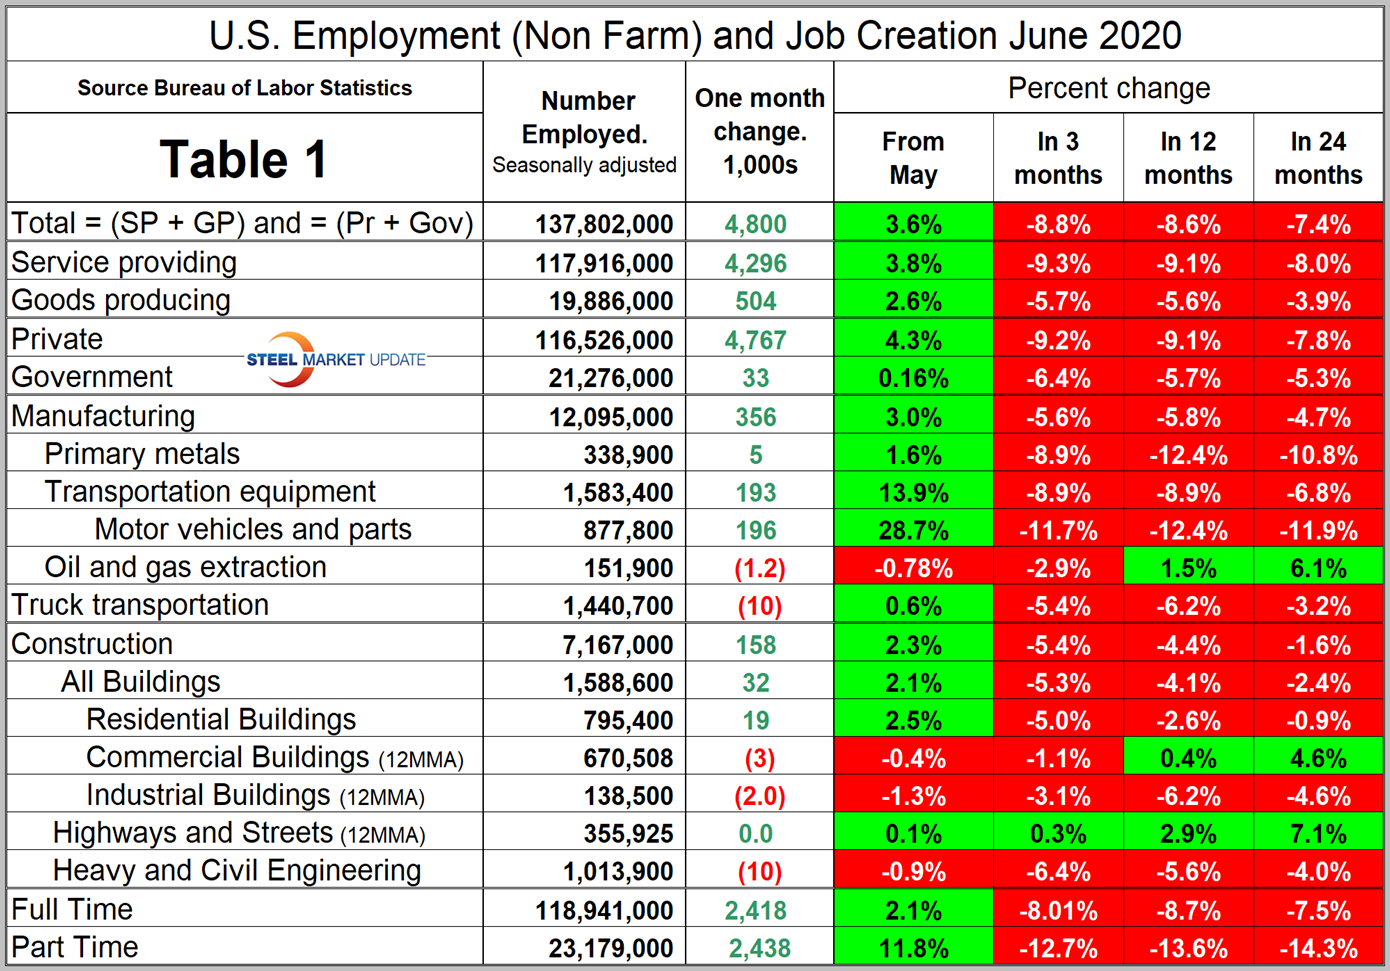
Table 1 breaks total employment down into service and goods-producing industries and then into private and government employees. Most of the goods-producing employees work in manufacturing and construction. The components of these two sectors of most relevance to steel people are broken out in Table 1. Note, the subcomponents of both manufacturing and construction shown in Table 1 don’t add up to the total because we have only included those with the most relevance to the steel industry.
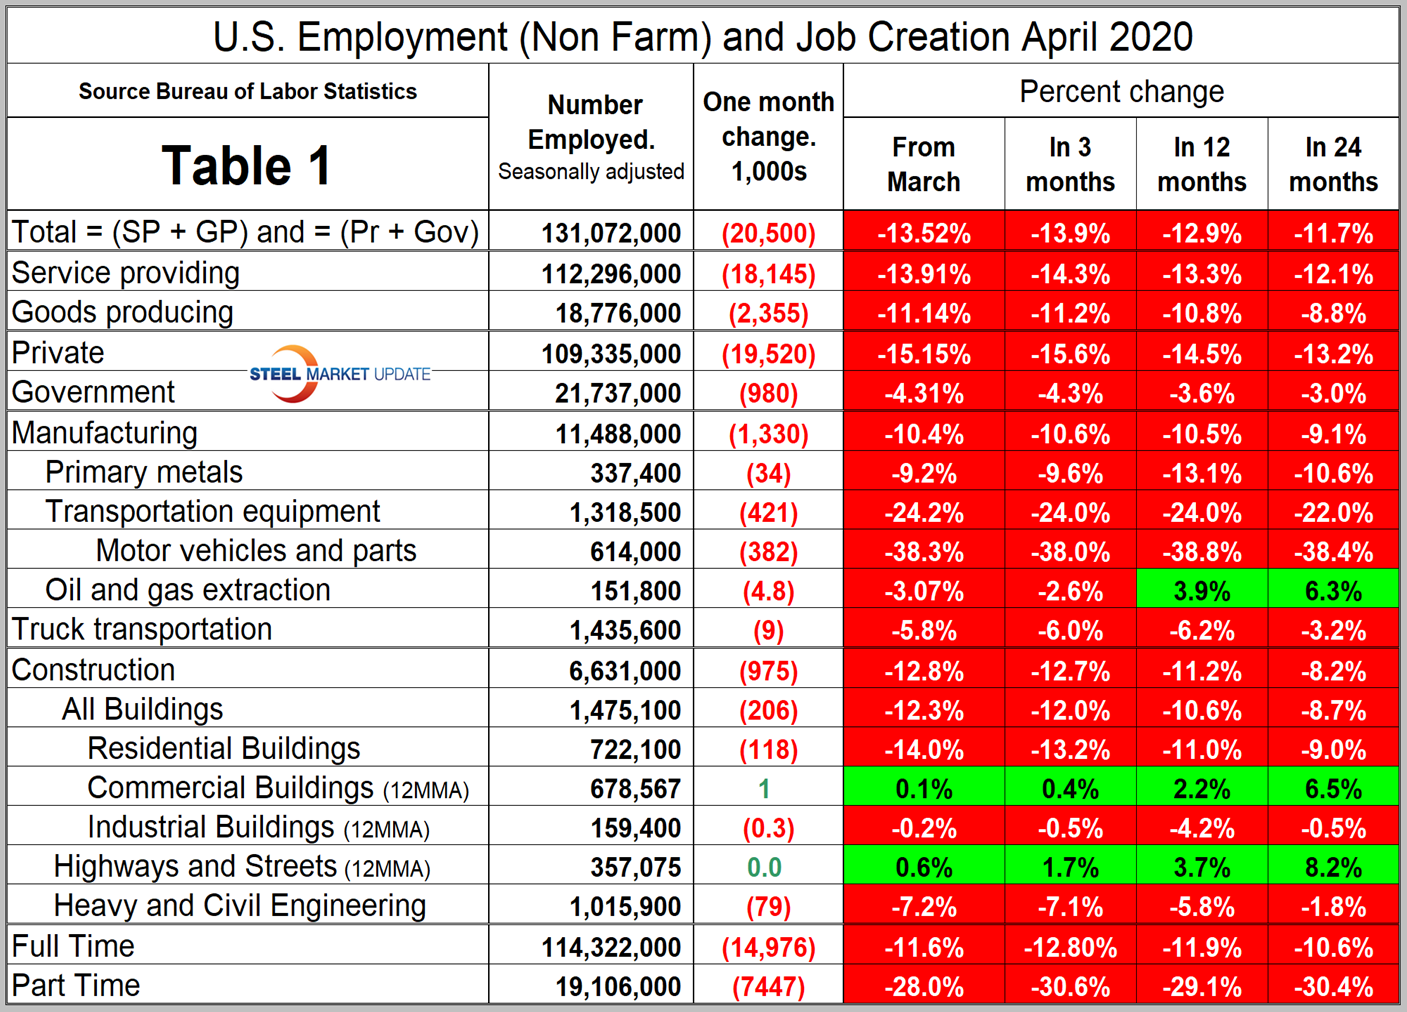
For comparison, we include here the April version of Table 1.
Comparing June data to May’s results shows employment in service industries to be up by 3.8 percent and in goods-producing industries up by 2.6 percent (Figure 1). In the longer term, goods-producing has been hit less than services in each of the 3-, 12- and 24-month periods.
The goods-producing section of this data is comprised mainly of manufacturing and construction employment. Comparing June to May, manufacturing was up 3.0 percent and construction by 2.3 percent. The BLS had this to say about manufacturing and construction employment in their July 2 report: “In June, manufacturing employment rose by 356,000, but is down by 757,000 since February. June employment increases were concentrated in the durable goods component, with motor vehicles and parts (+196,000) accounting for over half of the job gain in manufacturing. Employment also increased over the month in miscellaneous durable goods manufacturing (+26,000) and machinery (+18,000). Within the nondurable goods component, the largest job gain occurred in plastics and rubber products (+22,000).
“Construction employment increased by 158,000 in June, following a gain of 453,000 in May. These gains accounted for more than half of the decline in March and April (-1.1 million combined). Over-the-month gains occurred in specialty trade contractors (+135,000), with growth about equally split between the residential and nonresidential components. Job gains also occurred in construction of buildings (+32,000).”
Figure 2 shows the level of employment in these two sectors since January 2005.
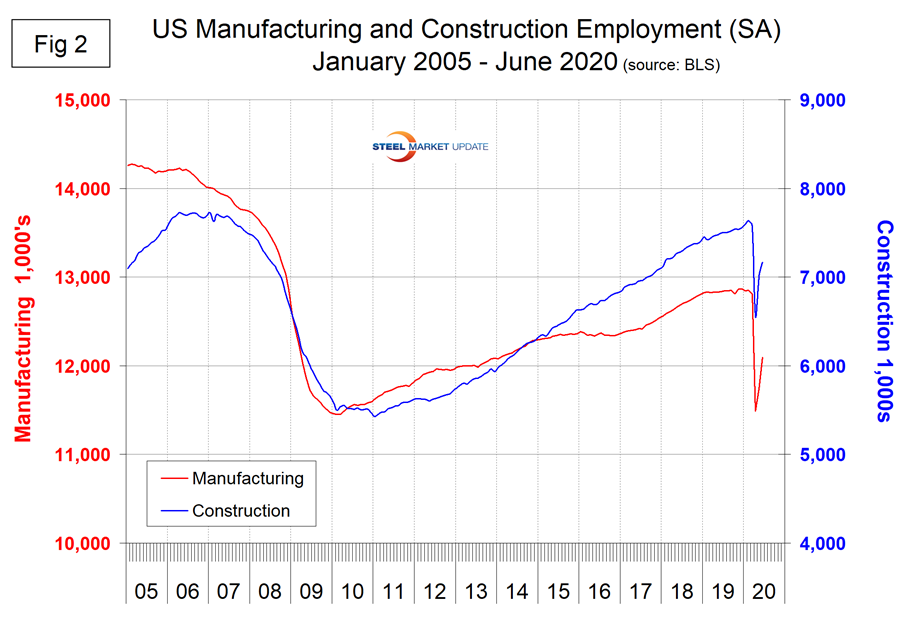
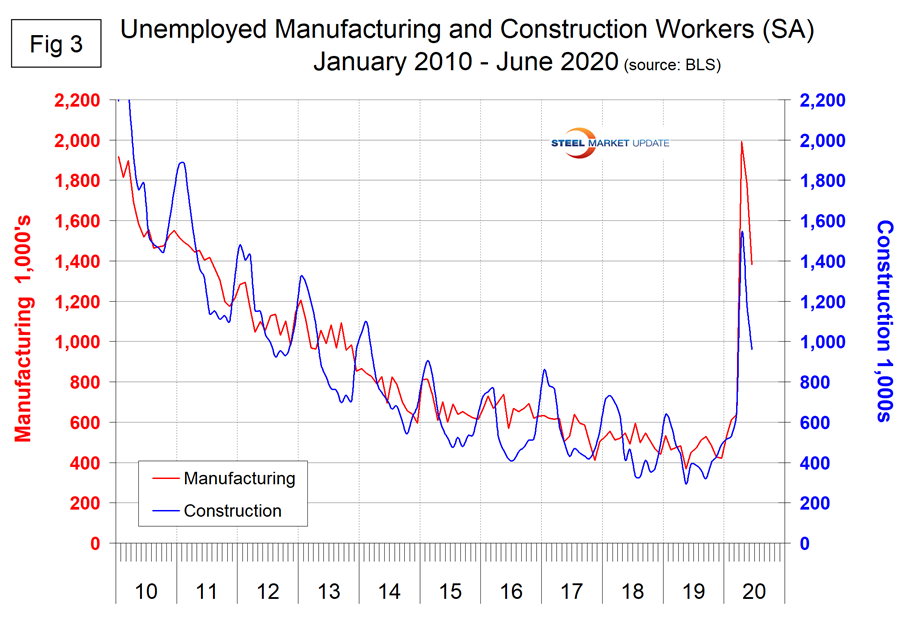
Figure 3 shows the reported number of unemployed manufacturing and construction workers. These were 1.383 million and 962,000, respectively, at the end of June.
SMU Comment: Manufacturing employment increased by 356,000 and construction employment by 158,000 in June, but were down by 5.8 percent and 4.4 percent, respectively, over 12 months. In terms of steel consumption, construction will lag manufacturing on both the downside and upside due to the long-term nature of most construction projects. Primary metals has suffered more than overall manufacturing in all time periods considered in this report.
Explanation: On the first or second Friday of each month, the Bureau of Labor Statistics releases the employment data for the previous month. Data is available at www.bls.gov. The BLS employment database is a reality check for other economic data streams such as manufacturing and construction. It is easy to drill down into the BLS database to obtain employment data for many subsectors of the economy. The important point about all these data streams is the direction in which they are headed.


