Market Data

July 19, 2020
Regional Jobs Report: All States See Some Recovery
Written by Peter Wright
Steel Market Update is pleased to share this Premium content with Executive-level members. For more information on how to upgrade to a Premium subscription, email Info@SteelMarketUpdate.com.
On a percentage basis, the North East and New England suffered the worst job losses in the first half of 2020. The full force of the pandemic-led job losses occurred in April. Since then all regions and all states have had some level of recovery.
Comparing June to April on a regional basis, the North Central has improved the most with a 7.4 percent increase in jobs. The South Central has improved the least at 4.1 percent. On a state-by-state basis, three had a double-digit improvement—Vermont at 11.8 percent, Michigan at 13.5 percent and Nevada at 11.2 percent. The worst performing states were South Dakota at 1.3 percent, Wyoming at 2.2 percent, Virginia at 2.4 percent and Oklahoma at 3.1 percent.
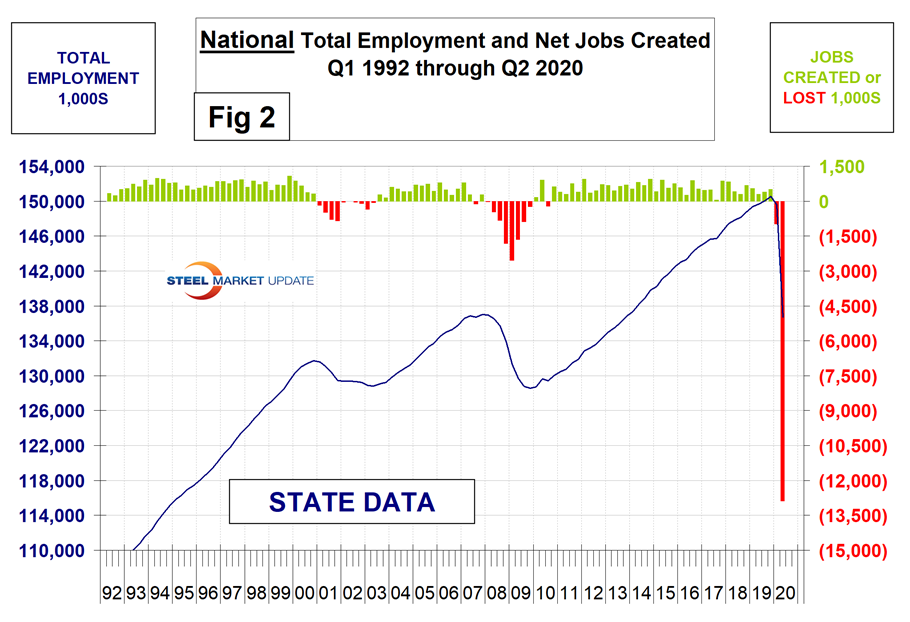
Second quarter regional employment data by state was released by the Bureau of Labor Statistics (BLS) on June 17. The state data follows and confirms the employment situation that we reported at the national level two weeks ago. The states compile their employment numbers independently of the Feds, and then both are reported by the BLS. In the second quarter, the Feds reported total job losses of 13,288,000 and the states reported 12,881,000. Our report covers only the lower 48 states and the state numbers don’t include individuals such as the military who are employed overseas. Therefore, the federal and state totals are close. Figure 1 shows the history of federal data totals since 1992 and Figure 2 shows the same format for the state data.

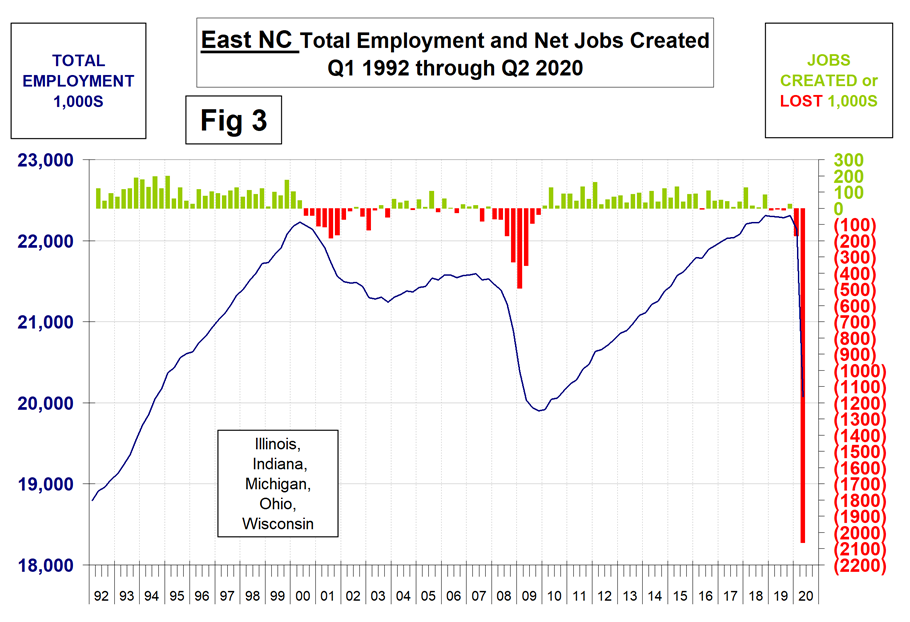
SMU has graphs in the same format for 10 geographic regions and can produce them for individual states on request. Figure 3 shows the history of the East North Central.
The 10 geographic regions described in this report are:
New England (CT, ME, MA, NH, RI, VT)
North East (NY, PA, NJ)
Mid Atlantic (DE, DC, MD, NC, SC, VA, WV)
North Central (IA, KS, MN, MO, NE, ND, SD)
East North Central (IL, IN, MI, OH, WI)
East South Central (AL, KY, MS, TN)
South Central (TX, OK, LA, AR)
Mountain (AZ, CO, ID, MT, NV, NM, UT, WY)
Pacific (CA, OR, WA)
South East (FL, GA)
Table 1 shows the seasonally adjusted history of quarterly job creation by region since Q1 2017. In Q2 2020, the North East lost the most jobs followed by the Pacific and East North Central regions. All three had losses exceeding two million.
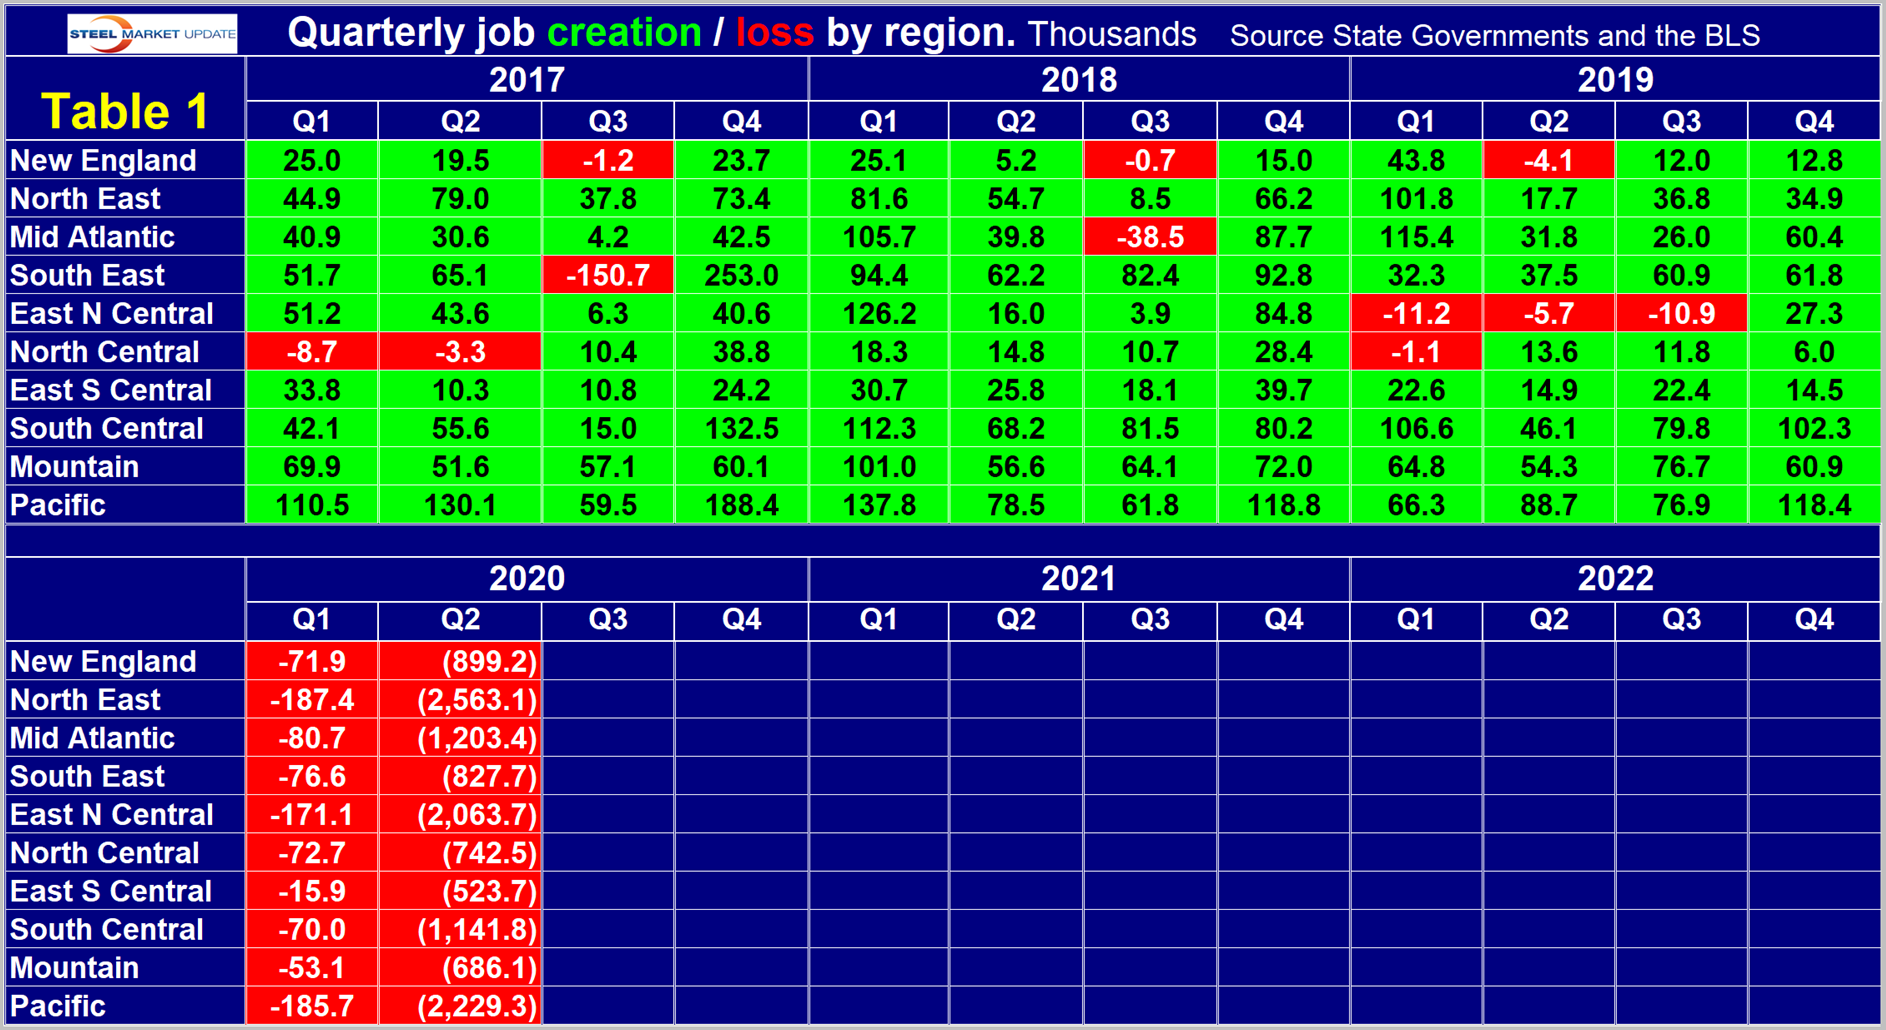
Table 2 shows the change in employment by region in the first two quarters of 2020. Based on state data, the nation as a whole lost 13.866 million jobs in the first half of 2020 (Table 2). National data based on the BLS monthly report released on the first Friday of every month showed a loss of 14.196 million jobs.

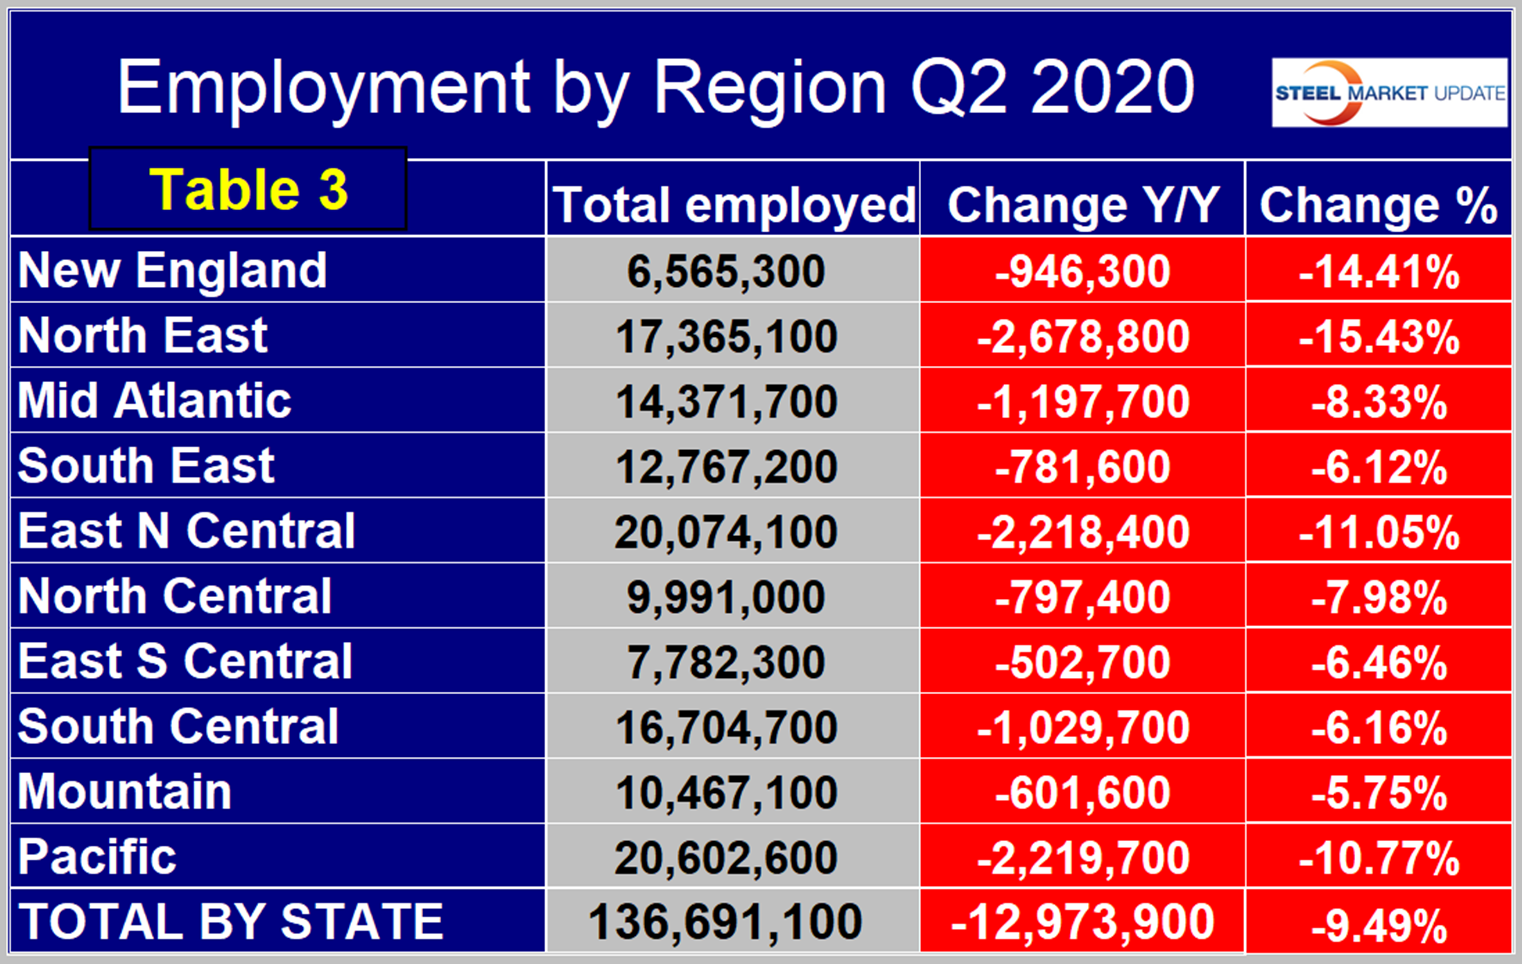
The Pacific region continues to have the highest number of people employed, followed by the East North Central. On a percentage basis, the North East and New England had the worst performance year over year, followed by the East North Central and Pacific. From Q2 2019 through Q1 2020, the Mountain region suffered the least on a percentage basis followed by the South East and the South Central (Table 3).