

Analysis
August 3, 2020
Construction Put in Place Data for June
Written by Peter Wright
In three months through June, total construction expenditures had negative growth for the first time since November 2011.
SMU Comment: Data in this report is not adjusted for seasonality. We remove this effect by considering only year-over-year data. Total construction contracted by 0.6 percent in June as a result of a 2.6 percent contraction in privately funded work. Federally funded and state and locally funded expenditures continued to advance.
At SMU, we analyze the Construction Put In Place (CPIP) data to provide a detailed description of activity that accounts for about 45 percent of total U.S. steel consumption. See the end of this report for a description of how we perform this analysis and structure the data.
Total Construction
Total construction declined by 0.6 percent in three months through June and advanced by 4.2 percent in 12 months through June, both year over year. Since the three-month growth rate is lower than the 12-month rate, we conclude that momentum was negative in June. Construction activity is responding much more slowly than manufacturing to the COVID-19 situation due to project commitments. In June, construction expenditures totaled $103.7 billion. This breaks down to $69.7 billion of private work, $31.6 billion of state and locally funded (S&L) work, and $2.4 billion of federally funded work (Table 1).
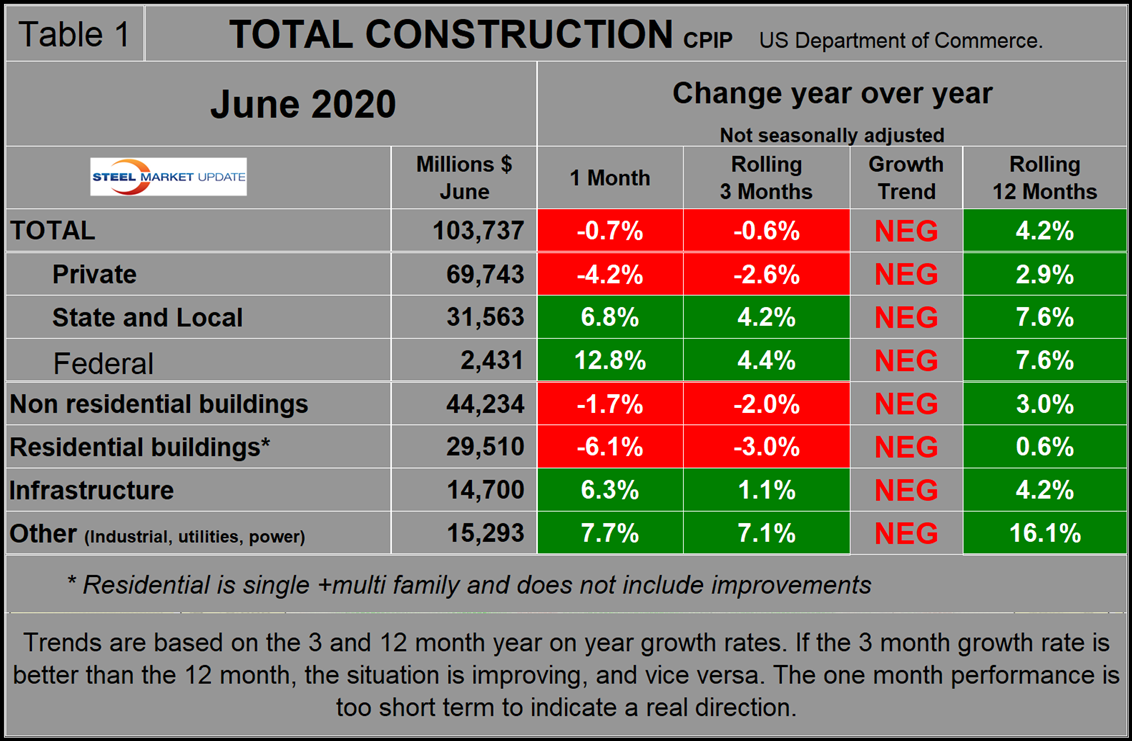
Figure 1 shows total construction expenditures on a rolling 12-month basis as the blue line and the rolling three-month year-over-year growth rate as the brown bars. Total construction was at an all-time high in the single month of August last year. On the rolling 12-months basis shown in Figure 1 the peak was in April 2020. The brown bars show growth on a 3MMA basis year over year. Growth slowed from 8.1 percent in February to negative 0.6 percent in June. In 12 months through June 2020, construction expenditures totaled $1.198 trillion. (This number excludes residential improvements; see explanation below.) The all-time high on a rolling 12-months basis was $1.2 trillion in April 2020, which was a steady improvement from $665.1 billion in the 12 months through October 2011.
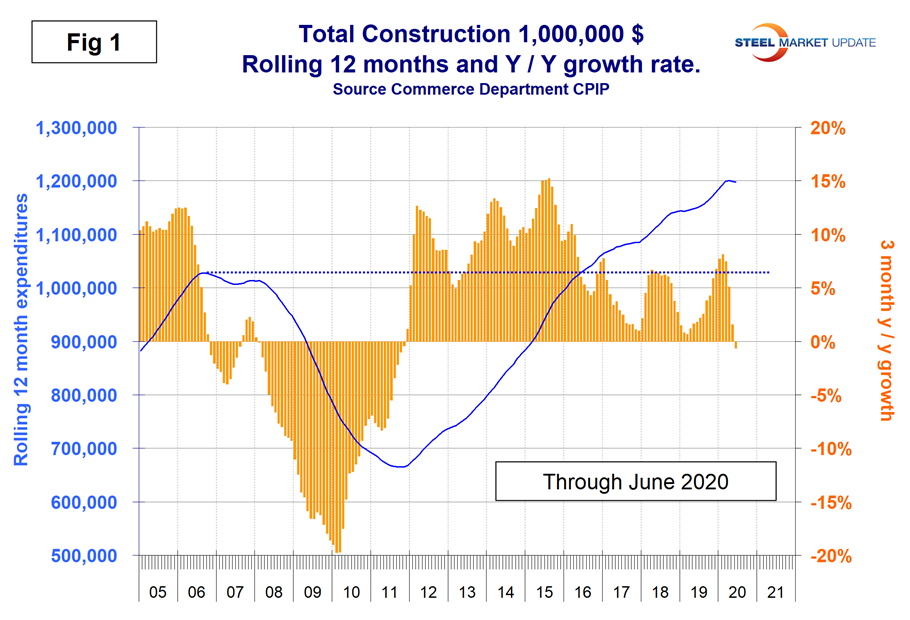
Figures 1, 2, 7, 8 and 10 in this analysis have the same format, the result of which is to smooth out variation and eliminate seasonality. We consider four sectors within total construction: nonresidential, residential, infrastructure and other. The latter is a catchall and includes industrial, utilities and power.
Private Construction
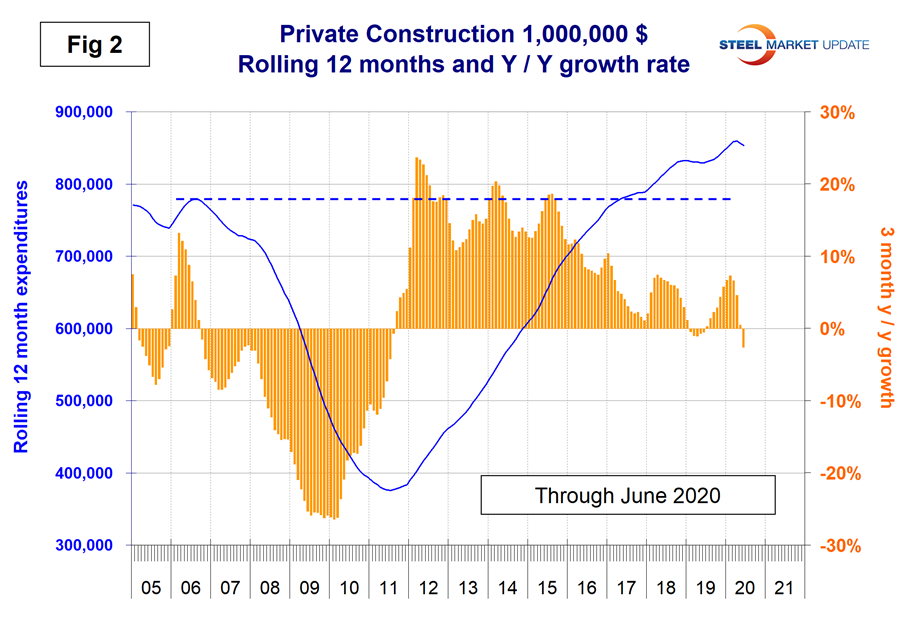
Table 2 shows the breakdown of private expenditures into residential and nonresidential and subsectors of both. The growth rate of private construction in three months through June was negative 2.6 percent, down from positive 7.3 percent in three months through February as shown by the brown bars in Figure 2.
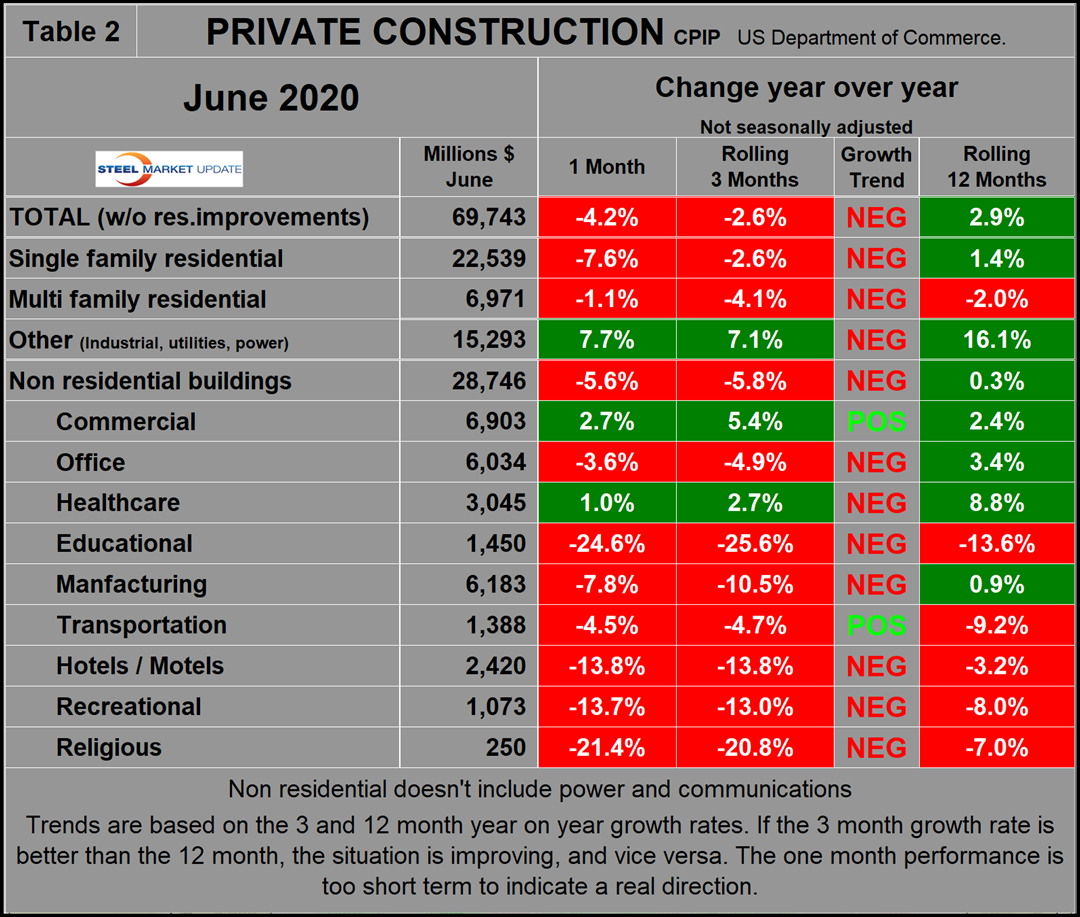
Within the private construction sector, both housing components and nonresidential buildings were down. The bright spot was the catchall of industrial, utilities and power.
Excluding property improvements, single-family residential contracted by 2.6 percent in three months through June with negative momentum and multifamily residential contracted by 4.1 percent, also with negative momentum. The CPIP data that is the main focus of this report is based on spending work as it proceeds; the value of a project is spread out from the project’s start to its completion. The Census Bureau reports separately on construction starts in which data for the whole project is entered into the database when ground is broken. Total housing starts contracted by 16.9 percent in three months through June year over year. On the same basis single and multifamily starts declined by 13.0 percent and 25.2 percent, respectively. Figure 3 shows the growth of both housing sectors since January 2005.
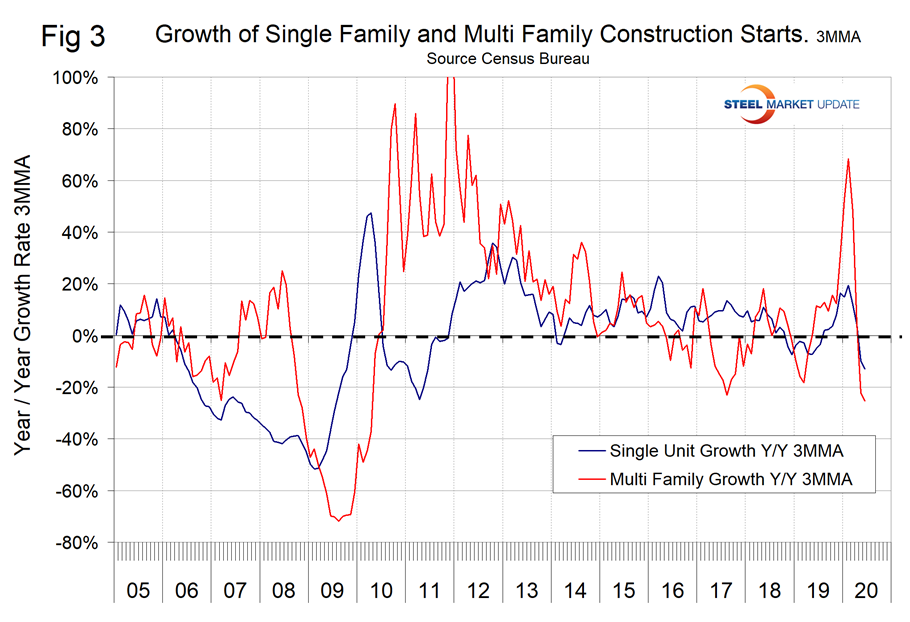
Figure 4 shows the ratio of single-family to multifamily starts. The proportion of single-family gradually increased from June 2015 when the ratio was 1.66 in favor of single units to 2.51 in June 2020.
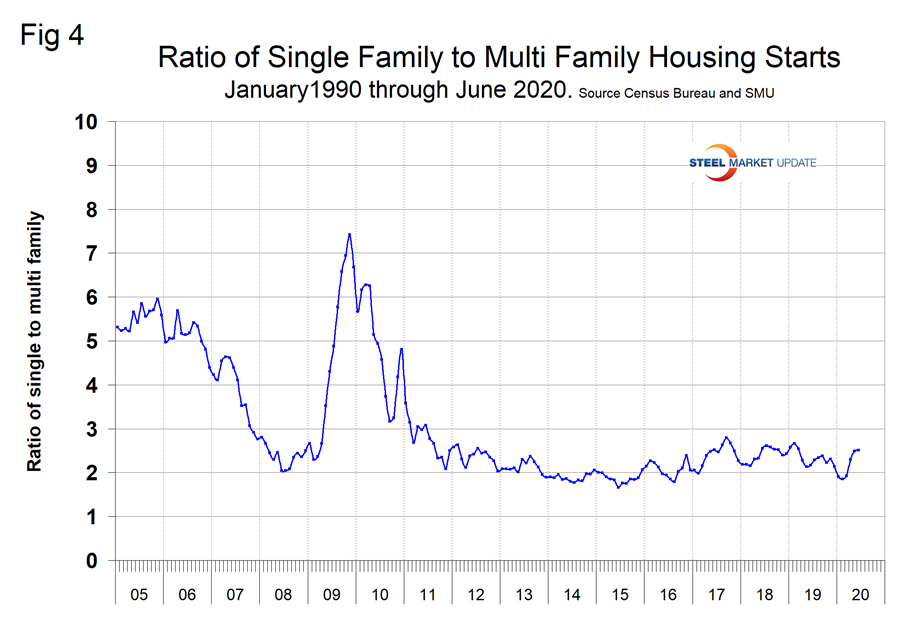
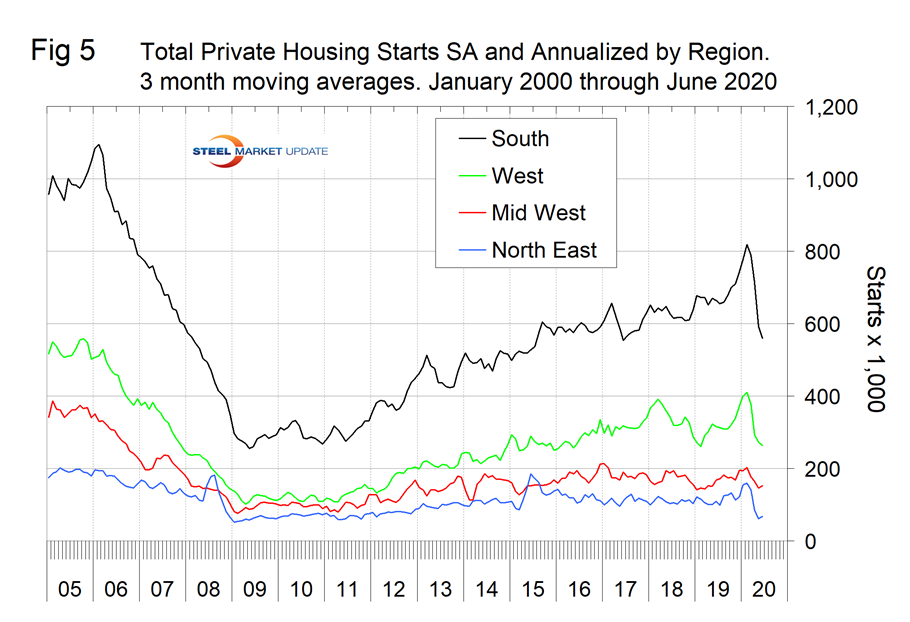
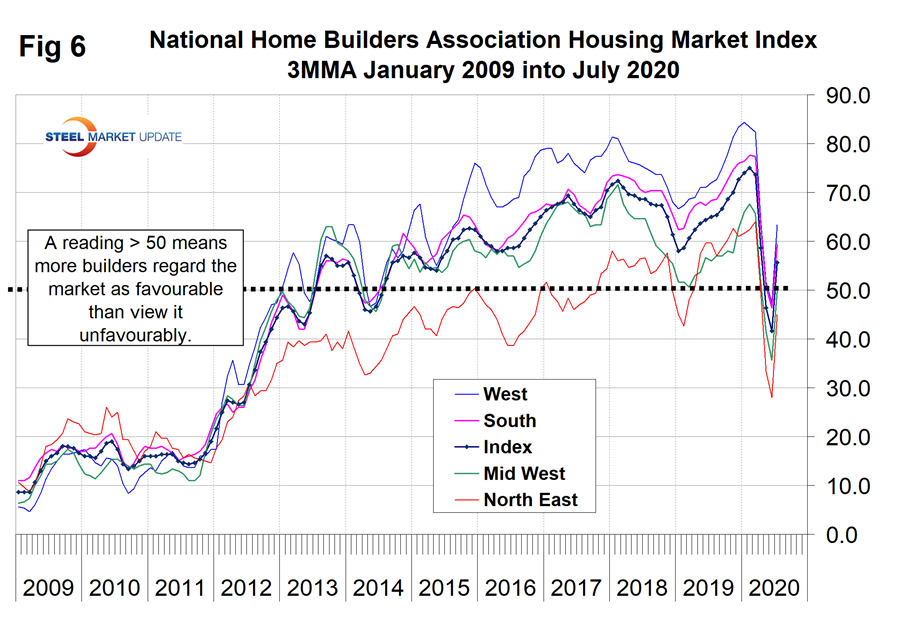
Figure 5 shows total housing starts in four regions with the South being the strongest and the Northeast the weakest. All four regions have suffered major declines this year, but there was a small improvement in the Midwest and Northeast June data. The National Association of Home Builders optimism index crashed in April and partially recovered in May, June and July as shown in Figure 6.
State and Local Construction
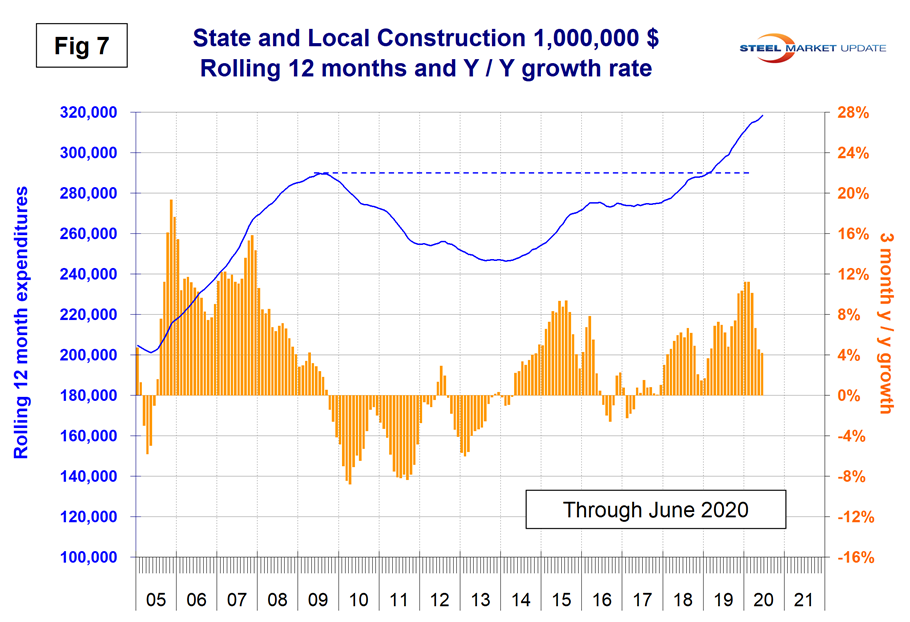
Total S&L expenditures recovered more slowly than private work from the last recession and are again showing a delayed reaction as they are holding up better than private expenditures today. This includes both infrastructure and nonresidential buildings. In three months through June, total S&L construction expanded by 4.2 percent and all building sectors had positive year-over-year growth. In addition, public safety, health care and commercial had positive momentum. (Table 3). Educational is by far the largest subsector of S&L nonresidential buildings at $8.4 billion in June and expanded at a 5.8 percent rate in three months through June with negative momentum. Figure 7 shows the history of total S&L expenditures.
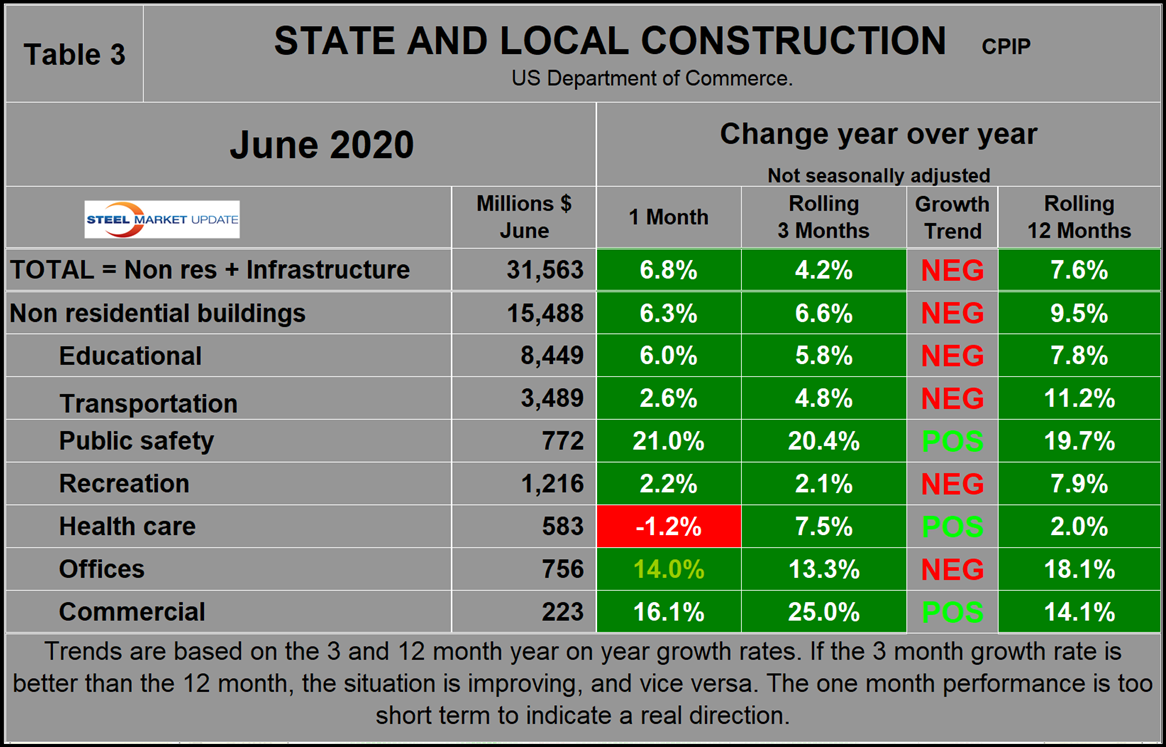
Drilling down into the private and S&L sectors as presented in Tables 2 and 3 shows which project types should be targeted for steel sales and which should be avoided. There are also regional differences to be considered, data for which is not available from the Commerce Department.
Infrastructure
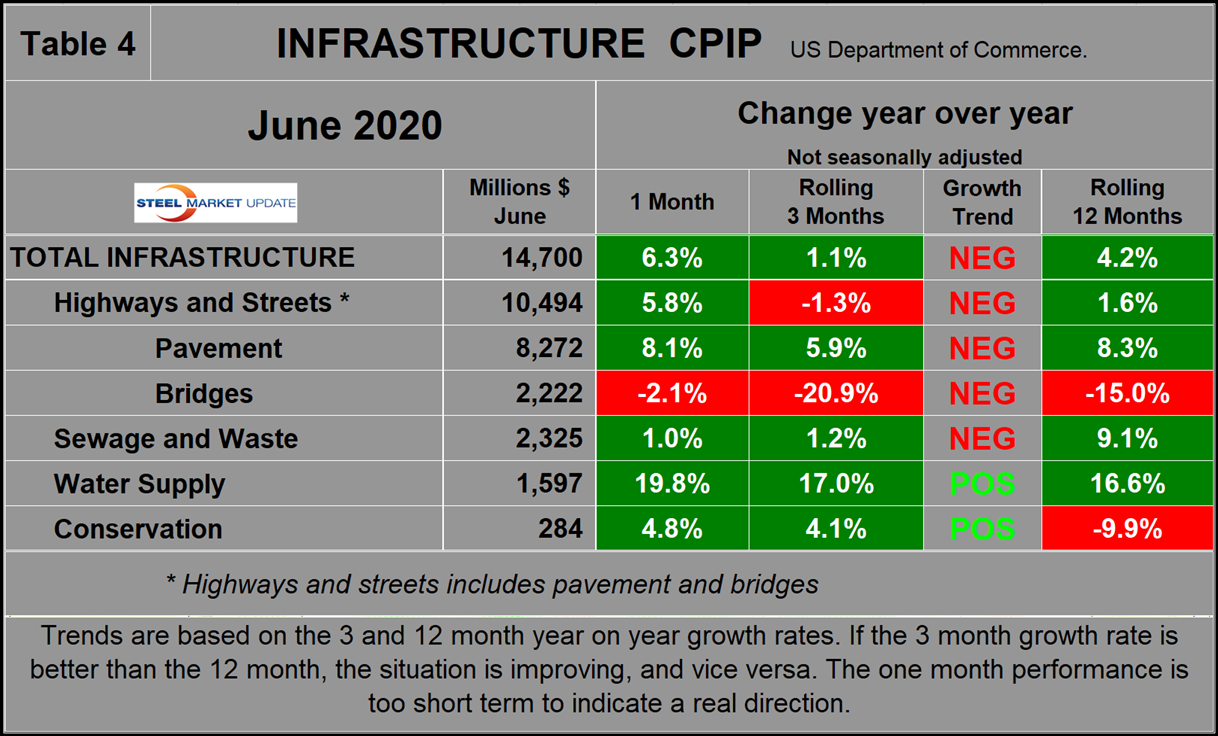
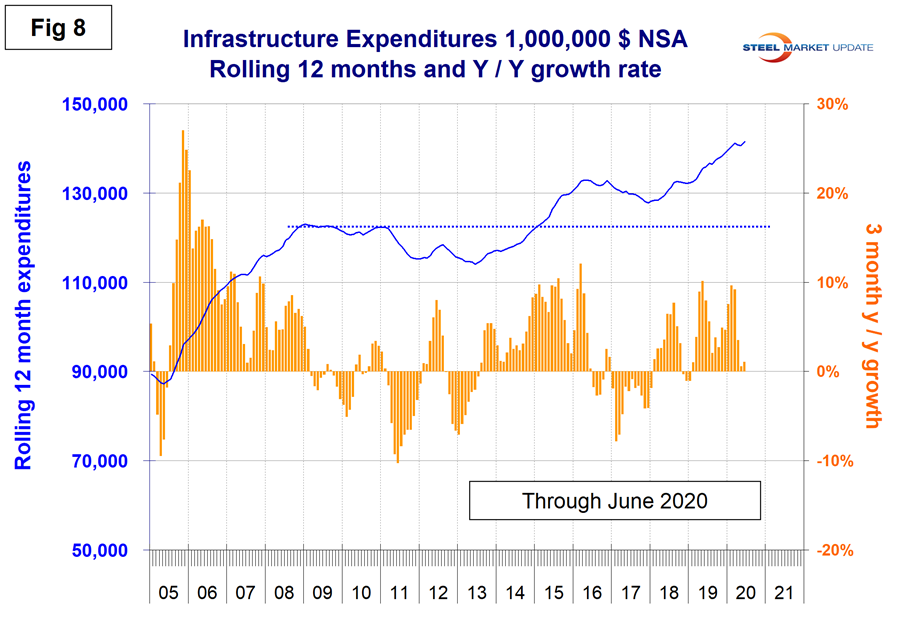
Infrastructure expenditures have had positive growth since January 2019, but growth declined in May and June this year. Year over year the growth of infrastructure expenditures in three months through June was 1.1 percent and on a rolling 12-months basis was 4.2 percent. (Note: There is no seasonality in this report as we are considering year-over-year data.) Highways and streets including pavement and bridges account for almost three quarters of total infrastructure expenditures. Highway pavement is the main subcomponent of highways and streets and had 5.9 percent growth in three months through June. Bridge expenditures have had a double-digit contraction rate every month since September last year. Table 4 shows the breakdown of infrastructure expenditures in three months and 12 months through June and Figure 8 shows the rolling 12-month history of infrastructure expenditures and the year-over-year growth rate.
Total Building Construction Including Residential
Figure 9 compares year-to-date expenditures for the construction of the various building sectors for 2019 and 2020. Single-family residential is dominant and in the first half of 2020 expenditures totaled 268.2 billion annualized. This compares to $274.0 billion in 2019 and $289.6 billion in 2018.
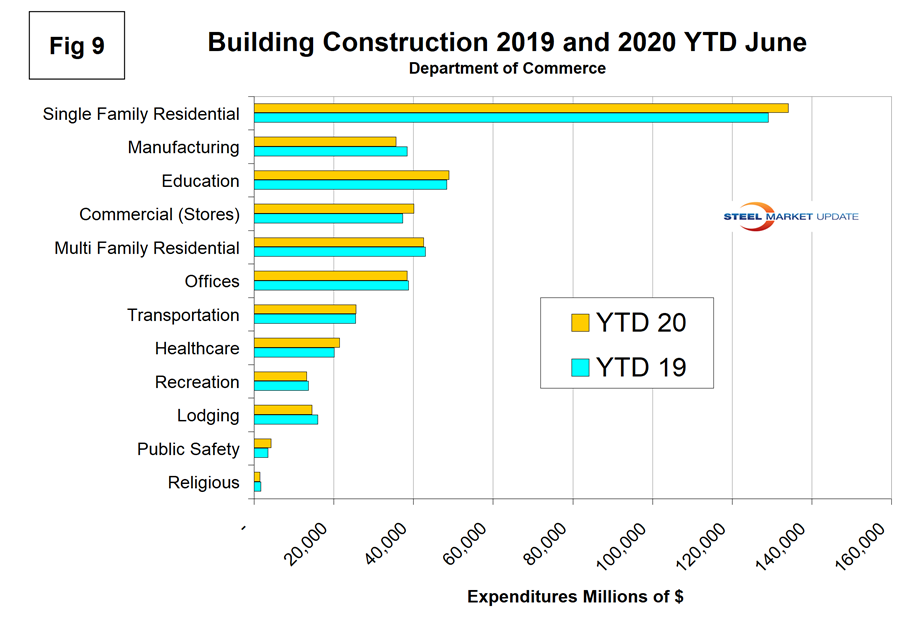
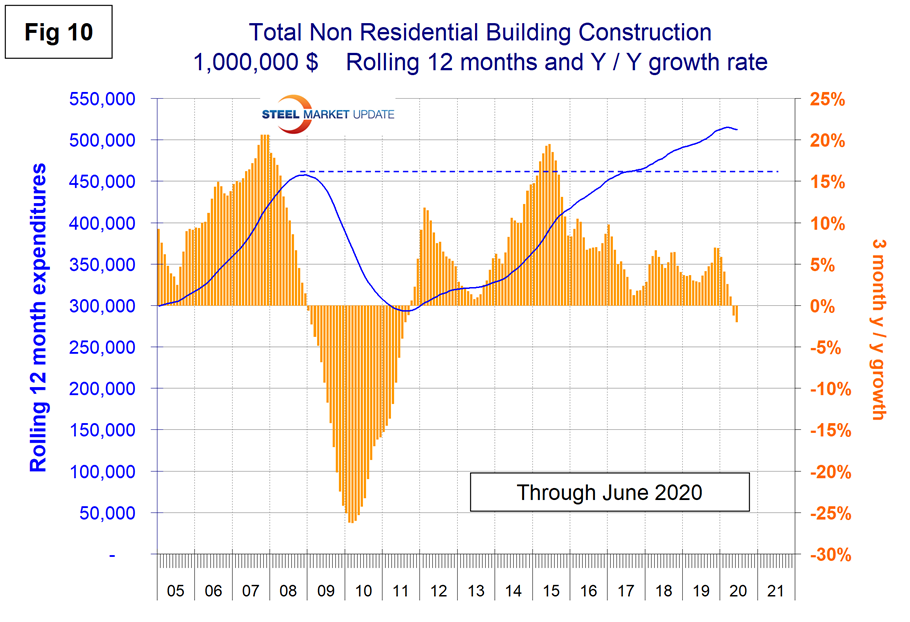
Figure 10 shows total expenditures and growth of nonresidential building construction through June 2020. Growth has slowed every month this year and in June reached negative 2.0 percent. On a rolling 12-months basis, expenditures on nonresidential buildings were at an all-time high in March 2020.
Explanation: Each month, the Commerce Department issues its Construction Put In Place (CPIP) data, usually on the first working day covering activity one month and one day earlier. There are three major categories based on funding source: private, state and local, and federal. Within these three groups are about 120 subcategories of construction projects. At SMU, we slice and dice the expenditures from the three funding categories to provide as concise a summary as possible of steel-consuming sectors. For example, we combine all three to reach a total of nonresidential building expenditures. CPIP is based on spending work as it occurs and is estimated each month from a sample of projects. In effect, the value of a project is spread out from the project’s start to its completion. This is different from the starts data published by the Census Bureau for residential construction, by Dodge Data & Analytics and by Reed Construction for nonresidential, and by Industrial Information Resources for industrial construction. In the case of starts data, the whole project is entered into the database when ground is broken. The result is that the starts data can be very spiky, which is not the case with CPIP.
The official CPIP press release gives no appreciation of trends on a historical basis and merely compares the current month with the previous one on a seasonally adjusted basis. The background data is provided as both seasonally adjusted and non-adjusted. The detail is hidden in the published tables, which SMU tracks and dissects to provide a long-term perspective. Our intent is to provide a route map for those subscribers who are dependent on this industry to “follow the money.” This is a very broad and complex subject, therefore, to make this monthly write-up more comprehensible, we are keeping the information format as consistent as possible. In our opinion, the absolute value of the dollar expenditures presented are of little interest. What we are after is the magnitude of growth or contraction of the various sectors. In the SMU analysis, we consider only the non-seasonally adjusted data. We eliminate seasonal effects by comparing rolling three-month expenditures year over year. CPIP data also includes the category of residential improvements, which we have removed from our analysis because such expenditures are minor consumers of steel.
In the four tables included in this analysis, we present the non-seasonally adjusted expenditures for the most recent data release. Growth rates presented are all year over year and are the rate for the single month’s result, the rolling three months and the rolling 12 months. We ignore the single month year-over-year result in our write-ups because these numbers are preliminary and can contain too much noise. The growth trend columns indicate momentum. If the rolling three-month growth rate is stronger than the rolling 12 months, we define that as positive momentum, and vice versa. In the text, when we refer to growth rate, we are describing the rolling three-month year-over-year rate. In Figures 1, 2, 6, 7 and 9 the blue lines represent the rolling 12-month expenditures and the brown bars represent the rolling three-month year-over-year growth rates.


