

Market Data
August 12, 2020
Employment by Industry in July
Written by Peter Wright
The primary metals sector is looking much worse than manufacturing as a whole in the employment picture.
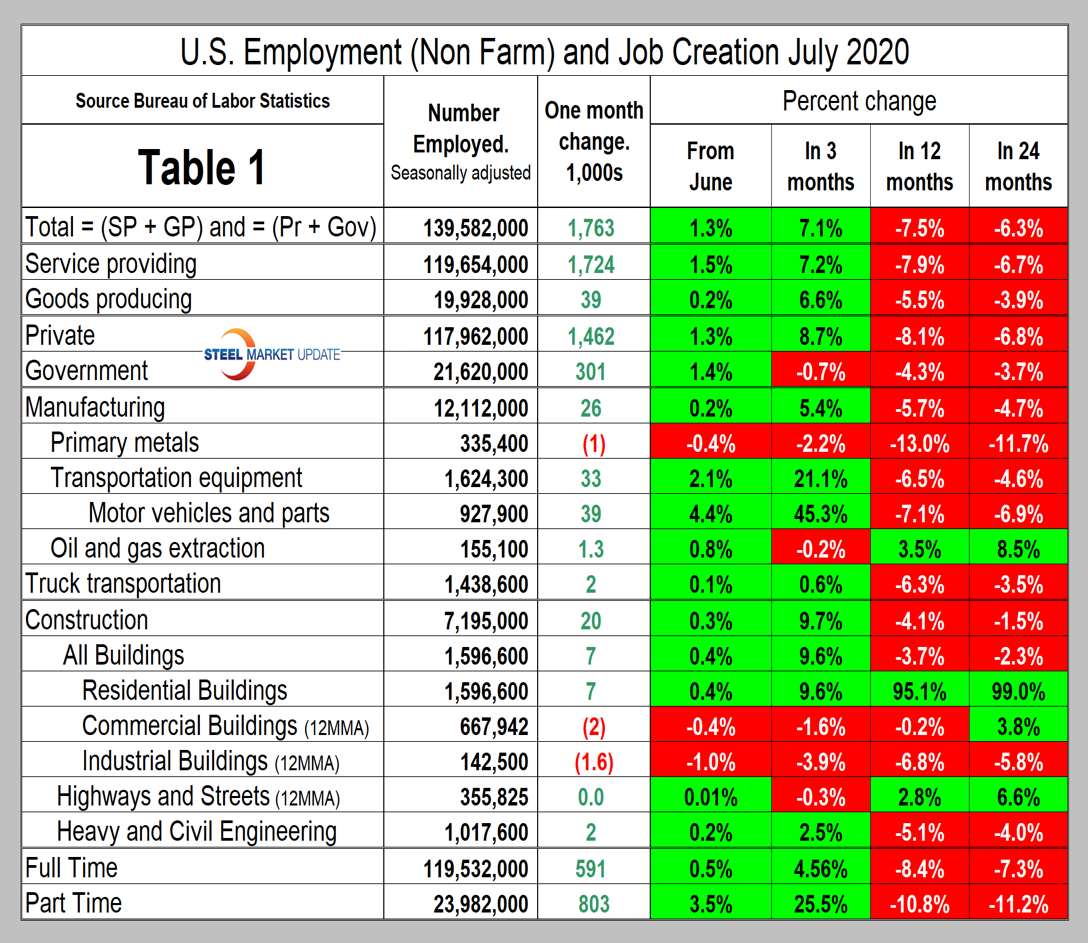
The net change in employed persons was negative 20.8 million in April, positive 2.7 million in May, positive 4.8 million in June and positive 1.8 million in July. Table 1 breaks total employment down into service and goods-producing industries and then into private and government employees. Most of the goods-producing employees work in manufacturing and construction and the components of these two sectors of most relevance to steel people are broken out in Table 1. Note, the subcomponents of both manufacturing and construction shown in Table 1 don’t add up to the total because we have only included those with the most relevance to the steel industry.
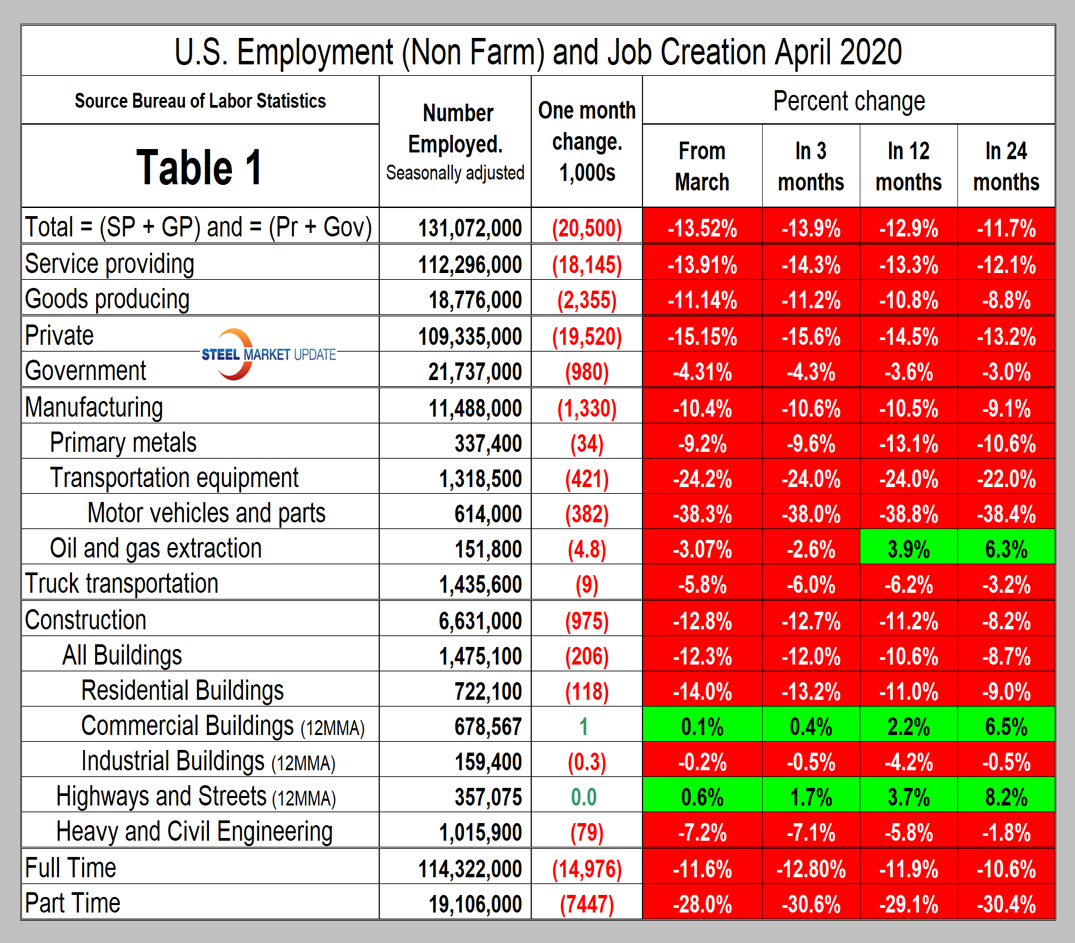
For comparison we include here the April version of Table 1.
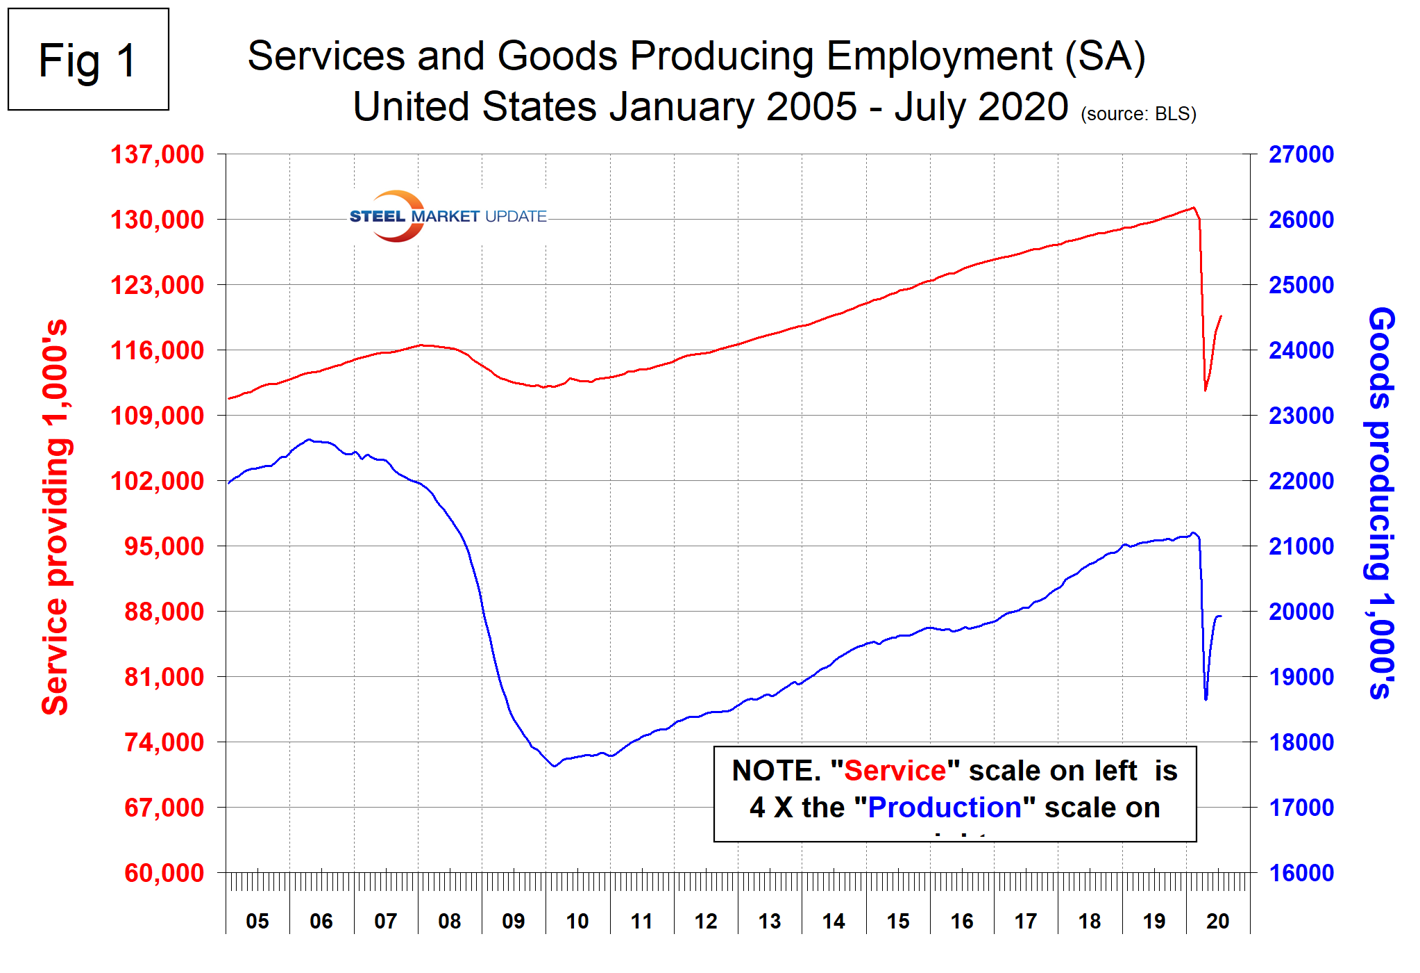
Comparing service industries to goods-producing in July versus June’s result shows services to be up by 1.5 percent and goods-producing up by 0.2 percent (Figure 1). In the longer term, goods-producing has been hit less than services in each of the 12- and 24-month periods.
The goods-producing section of this data is comprised mainly of manufacturing and construction employment. Comparing July to June, manufacturing was up 0.2 percent and construction by 0.3 percent. The BLS had this to say about manufacturing and construction employment in their July 2 report: “Manufacturing employment increased by 26,000 in July. An employment gain in motor vehicles and parts (+39,000) was partially offset by losses in fabricated metal products (-11,000) machinery (-7,000), and computer and electronic products (-6,000). Although manufacturing has added 623,000 jobs over the past three months, employment is 740,000 lower than in February. Construction employment changed little in July (+20,000), following job gains of 619,000 in May and June combined.”
In May through July, manufacturing employment rose by 623,000, but is down by 740,000 since February. In July, motor vehicles and parts accounted for all of the manufacturing gain and negated losses in other manufacturing sectors. Primary metals lost 1,000 jobs.
Construction added 639,000 jobs in May through July, but is down by 444,000 since February. In July, residential building gained 7,000 positions, but jobs in commercial and industrial building declined. There were small gains in infrastructure employment.
Figure 2 shows the level of employment in these two sectors since January 2005.
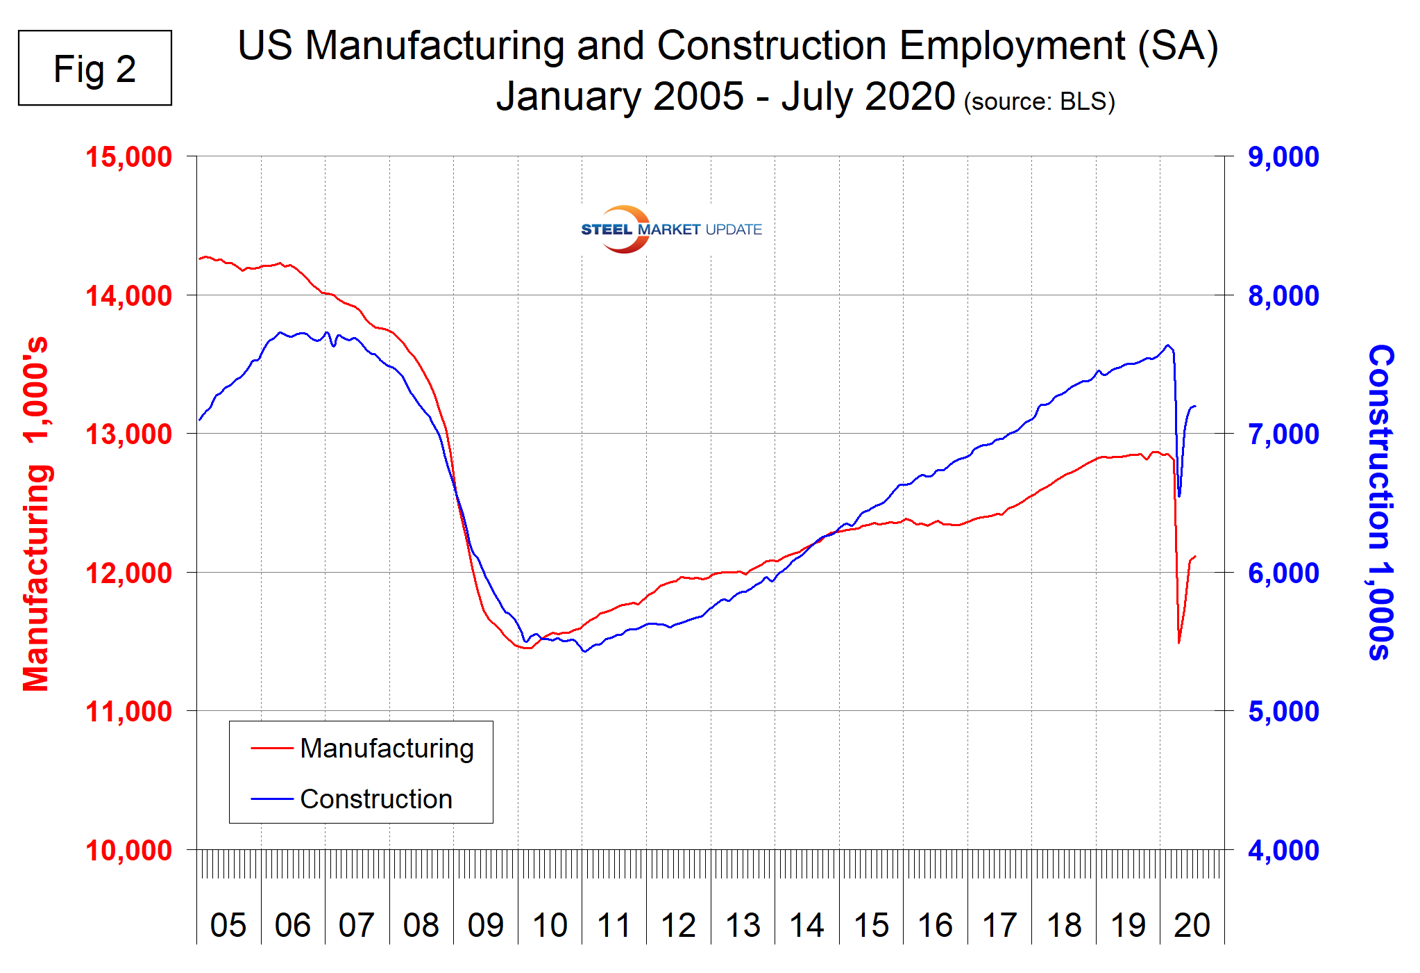
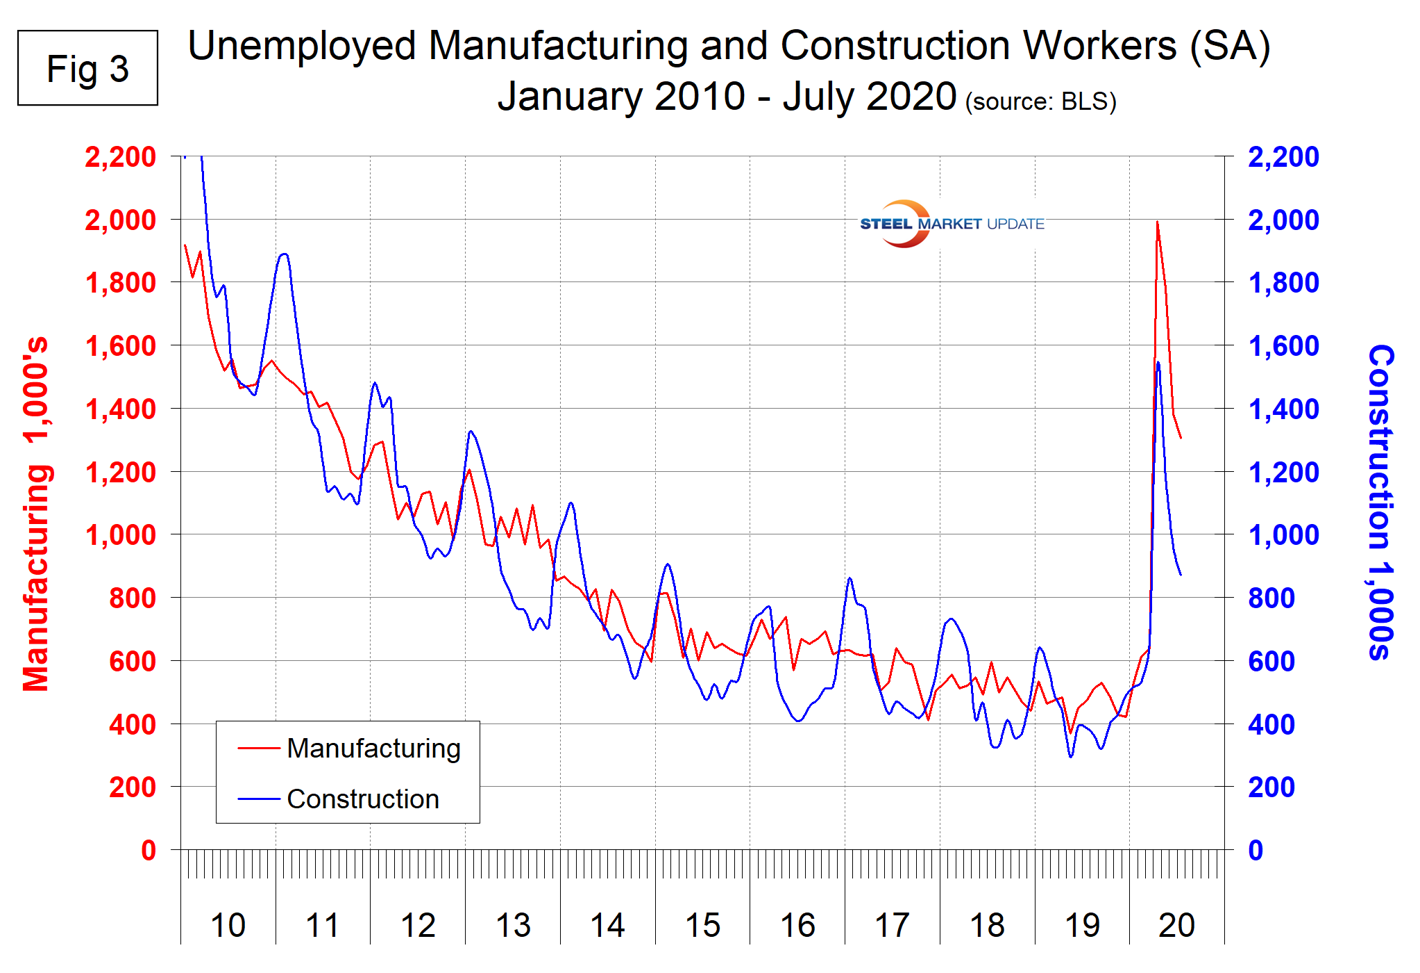
Figure 3 shows the reported number of unemployed manufacturing and construction workers. These were 1.306 million and 870,000, respectively, at the end of July.
SMU Comment: Year over year, manufacturing and construction employment were down by 5.7 percent and 4.1 percent, respectively. These sectors encompass most of the steel consumed in the U.S. and are not expected show much further improvement in the balance of 2020. Residential construction is still healthy and is propping up the overall construction sector, but doesn’t consume much steel compared to nonresidential and infrastructure. Primary metals has performed much worse than overall manufacturing in all four time periods considered in Table 1.
Explanation: On the first or second Friday of each month, the Bureau of Labor Statistics releases the employment data for the previous month. Data is available at www.bls.gov. The BLS employment database is a reality check for other economic data streams such as manufacturing and construction. It is easy to drill down into the BLS database to obtain employment data for many subsectors of the economy. The important point about all these data streams is the direction in which they are headed.


