

Market Data

August 12, 2020
Net Job Creation Through July 2020
Written by Peter Wright
Nonfarm employment rose by 1.7 million in July, but from May through July has made back less than half the losses of March and April.
The July jobs report was released by the Bureau of Labor Statistics on Friday and slightly exceeded analyst’s expectations by adding 1.8 million jobs. May’s job gain was revised up by 26,000 and June by 17,000.
![]()
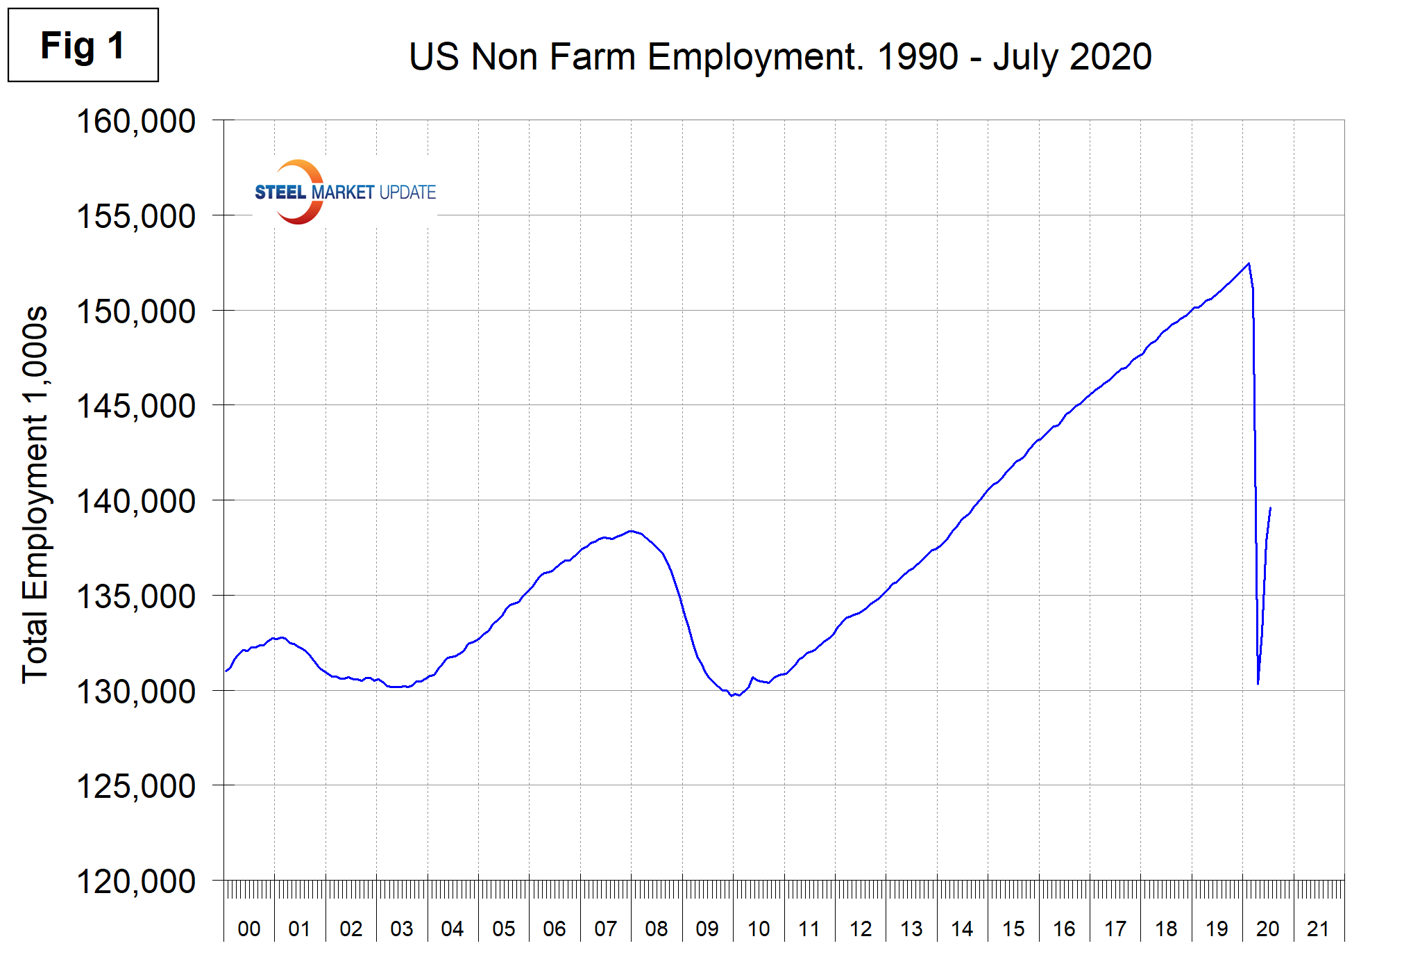
Figure 1 shows the total number of nonfarm employed people in the U.S. since 2000. The net loss since February’s all-time high result stands at 12,881,000. This resulted from a loss of 22,160,000 in March and April and a recovery of 9,279,000 in May through July. Steel consumption is related to GDP, which is driven largely by personal consumption.
On Aug. 5, investment research specialist Michael Gayed wrote: “As of July 2020, data collected from the employment claims filed weekly and from the monthly employment report indicate that 33 million Americans are currently unemployed. As of July 2020, there were 5.4 million job openings. The current employable workforce, not including the self-employed, is roughly 175 million (206.37 million less the 31.7 million self-employed), of which roughly 33 million people are unemployed. The current scenario is bleak. A high rate of unemployment indicates spending on discretionary items will decline. It also can impact other sectors such as housing, business and consumer services, etc. If the situation stagnates or worsens, it can impact productivity, personal income, and the general mood of the nation.”
According to the latest BLS economic news release of Aug. 7, “Total nonfarm payroll employment rose by 1.8 million in July, and the unemployment rate fell to 10.2 percent. These improvements in the labor market reflected the continued resumption of economic activity that had been curtailed due to the coronavirus (COVID-19) pandemic and efforts to contain it. In July, notable job gains occurred in leisure and hospitality, government, retail trade, professional and business services, other services, and health care.”
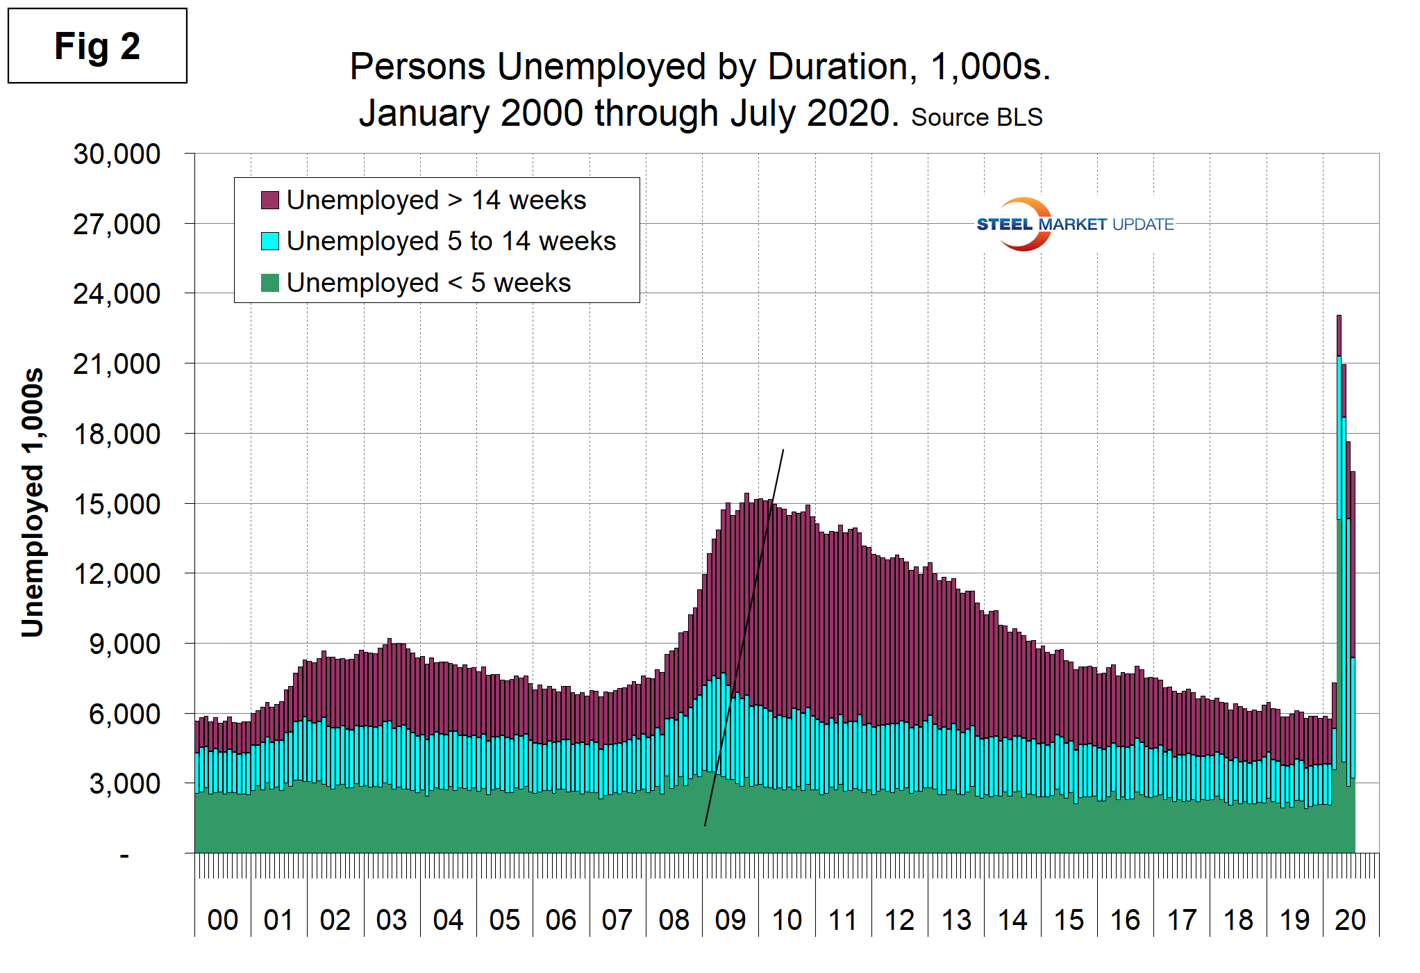
Figure 2 shows the historical picture for the duration of unemployment since January 2000 broken down into < 5 weeks, 5 to 14 weeks and > 14 weeks. The total number unemployed was 16,357,000 at the end of July, down from 23,059,000 at the end of April.
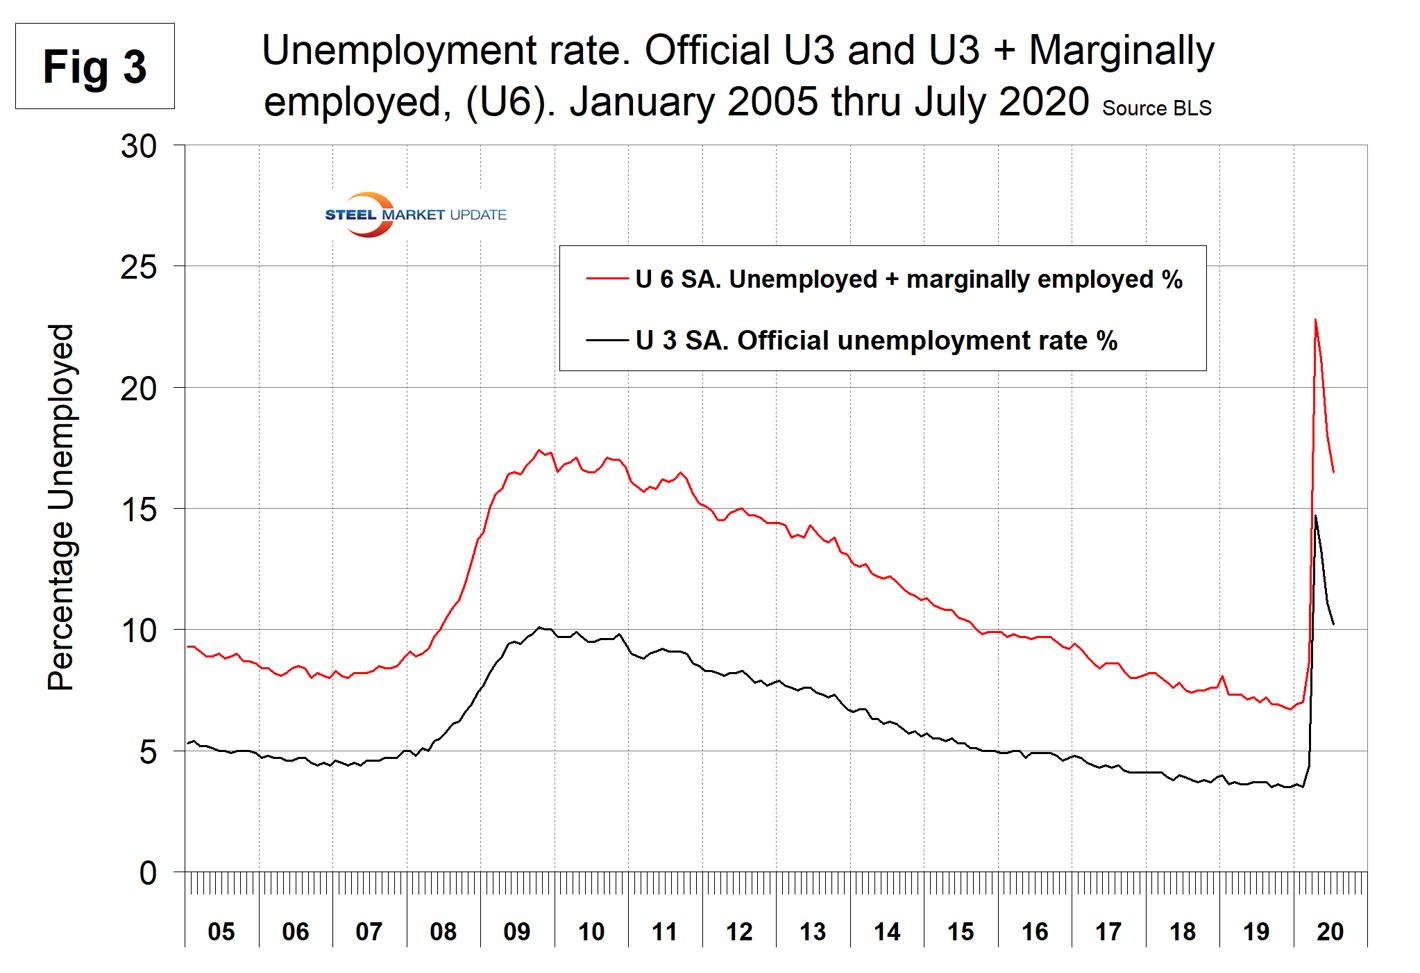
The official unemployment rate, U3, reported in the BLS Household survey (see explanation below) increased from 3.5 percent in February to 14.7 percent in April and declined to 10.2 percent in July. This is not a very representative number. The more comprehensive U6 unemployment rate at 16.5 percent in July improved from 22.8 percent in April (Figure 3). U6 includes individuals working part time who desire full-time work and those who want to work but are so discouraged they have stopped looking.
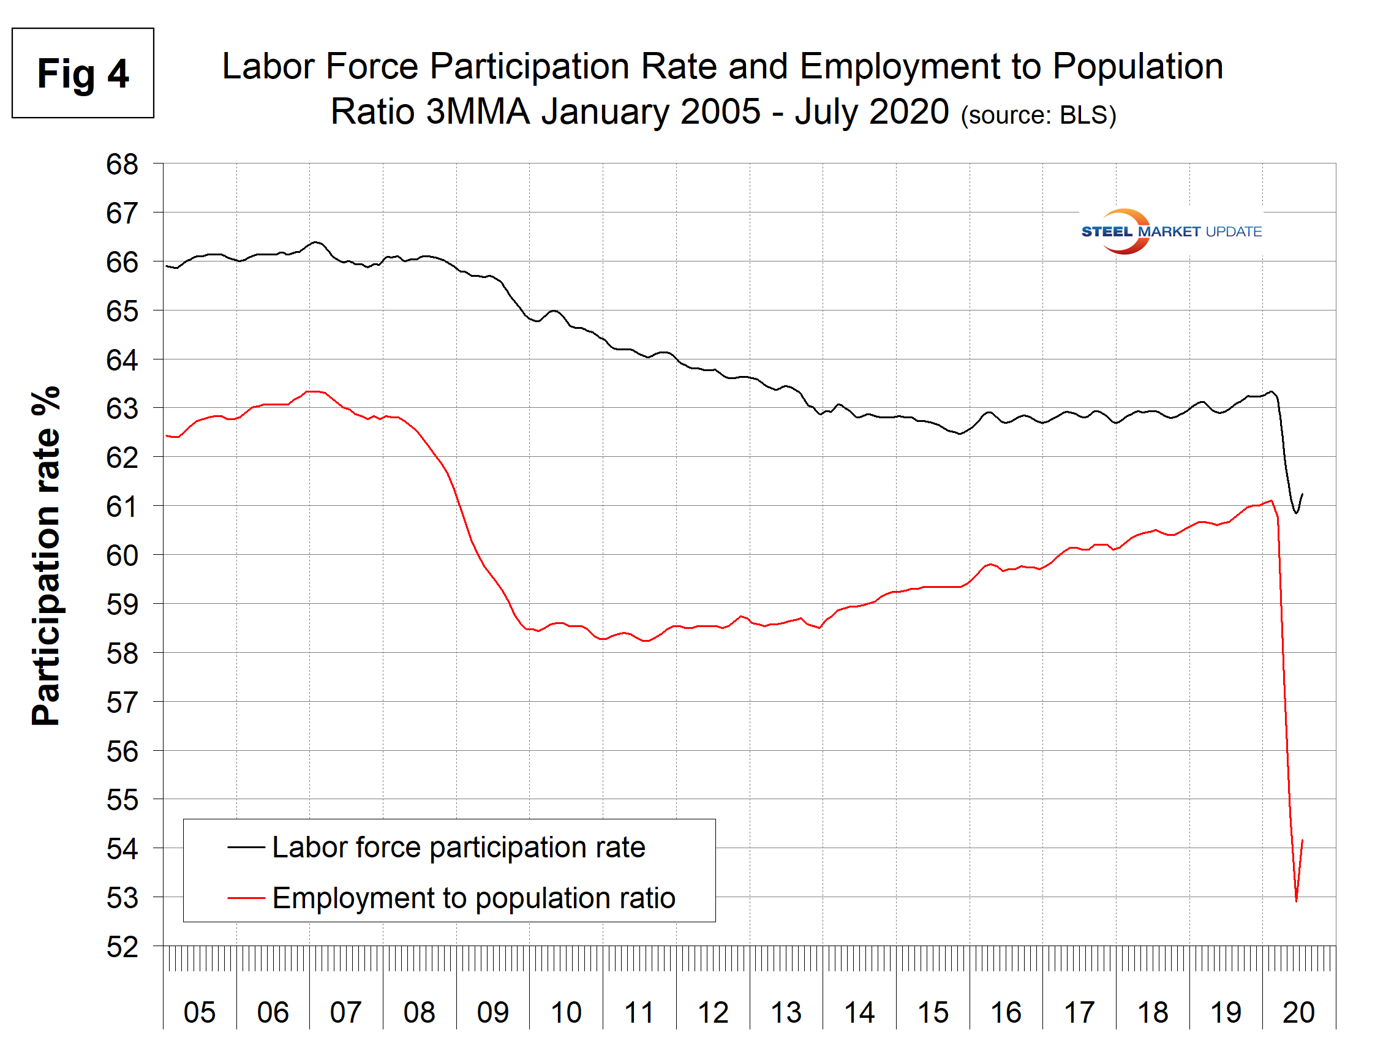
The labor force participation rate is calculated by dividing the number of people actively participating in the labor force by the total number of people eligible to participate. This measure was 61.4 percent in July, up from 60.2 percent in April but down from 63.4 percent in January and February. Another gauge is the number employed as a percentage of the population, which we think is more definitive. In July, the employment-to-population ratio was 55.1 percent, up from the low point of 51.3 percent in April. Figure 4 shows both measures on one graph.
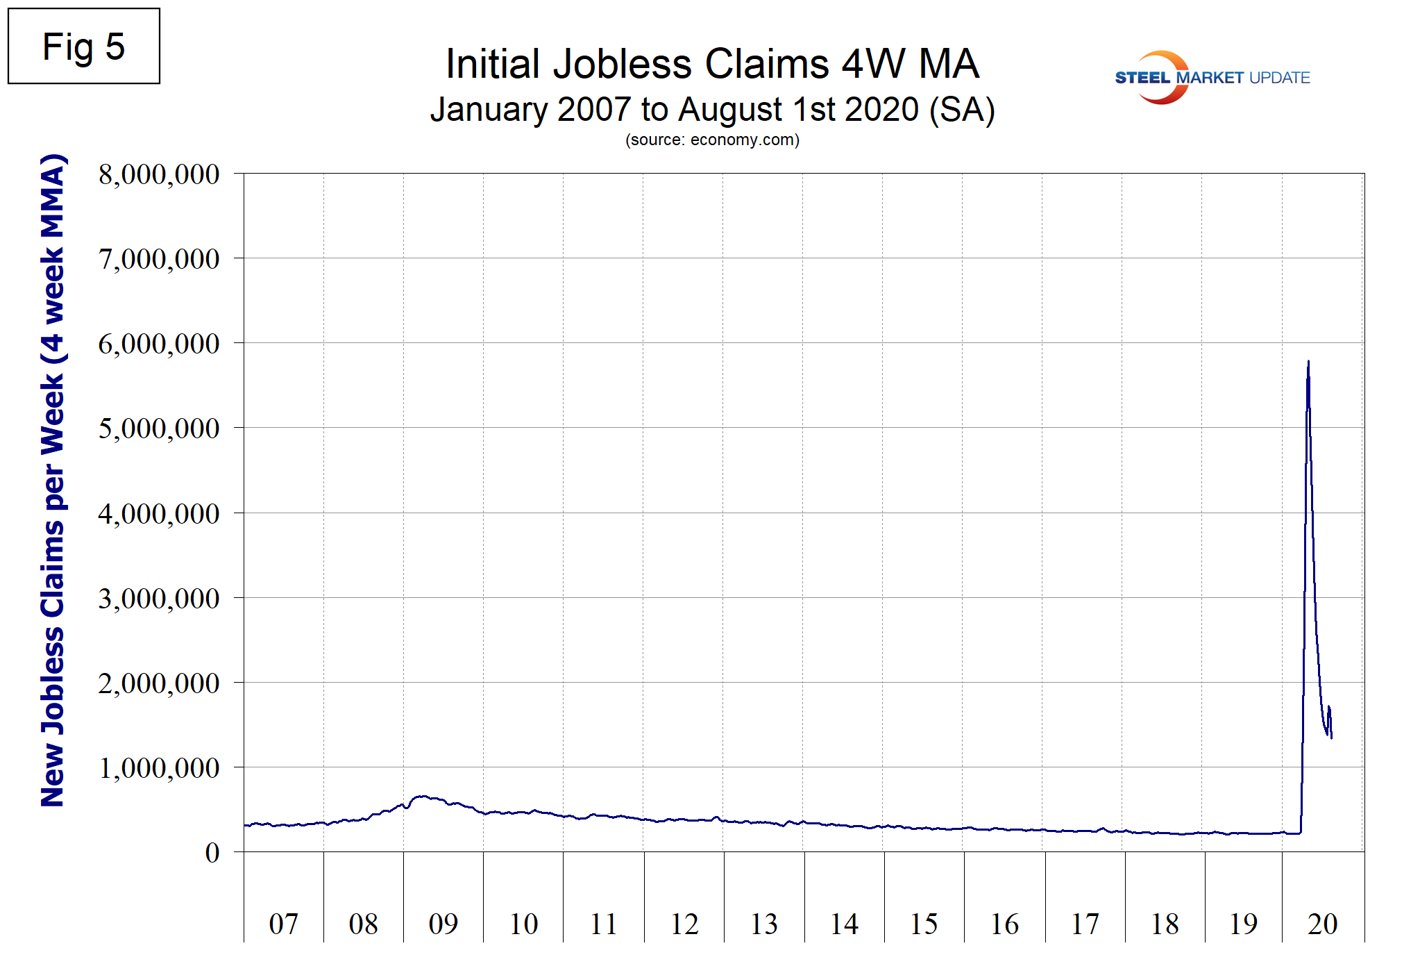
Initial claims for unemployment insurance, reported weekly by the Department of Labor, exploded in the two weeks ending March 21 and March 28 by a total of 6.6 million. Since then in the week ending Aug. 1, new claims have declined to 1.338 million. This number is still twice as high as for any week since 1967. Figure 5 shows the four-week moving average of new claims since January 2007.
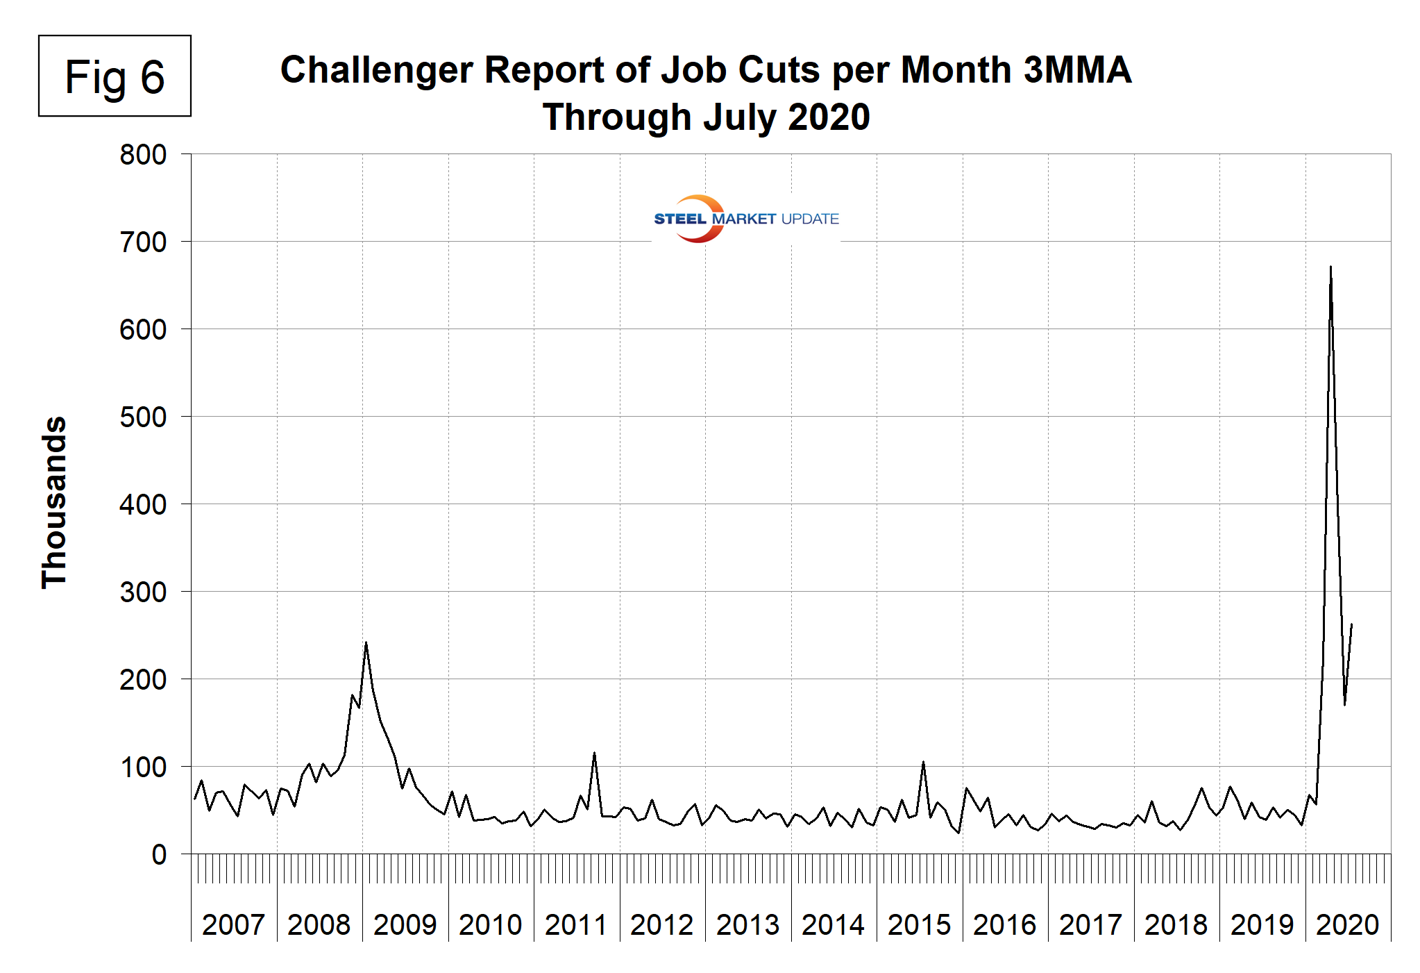
Challenger Gray & Christmas Inc., which produces a monthly employment update for the U.S., reported that job cuts increased from 56,700 in February to 671,000 in April, declined to 397,000 in May, down to 170,000 in June, before increasing again to 263,000 in July. “Job cuts announced by U.S.-based employers jumped in July to 262,649, the third-largest monthly total ever. Last month’s cuts bring the yearly total so far to 1,847,696, up 212 percent from the 592,556 cuts at this time last year. The majority of cuts continue to come from Entertainment/Leisure companies, including bars, restaurants, hotels, and amusement parks, which announced 109,940 cuts in July, an 18 percent increase over the industry’s 92,954 cuts announced in June, and a 21,976 percent increase over the 498 Entertainment/Leisure cuts tracked in July 2019. So far this year, these companies have announced 781,780 cuts, an 8,309 percent increase over the 9,297 cuts announced in the sector through July 2019. Retailers announced the second-highest number of job cuts this year with 163,112, 196 percent higher than the 55,167 cuts announced through the same period last year,” Challenger reported Aug. 3.
Figure 6 shows the monthly number of job cuts since January 2007.
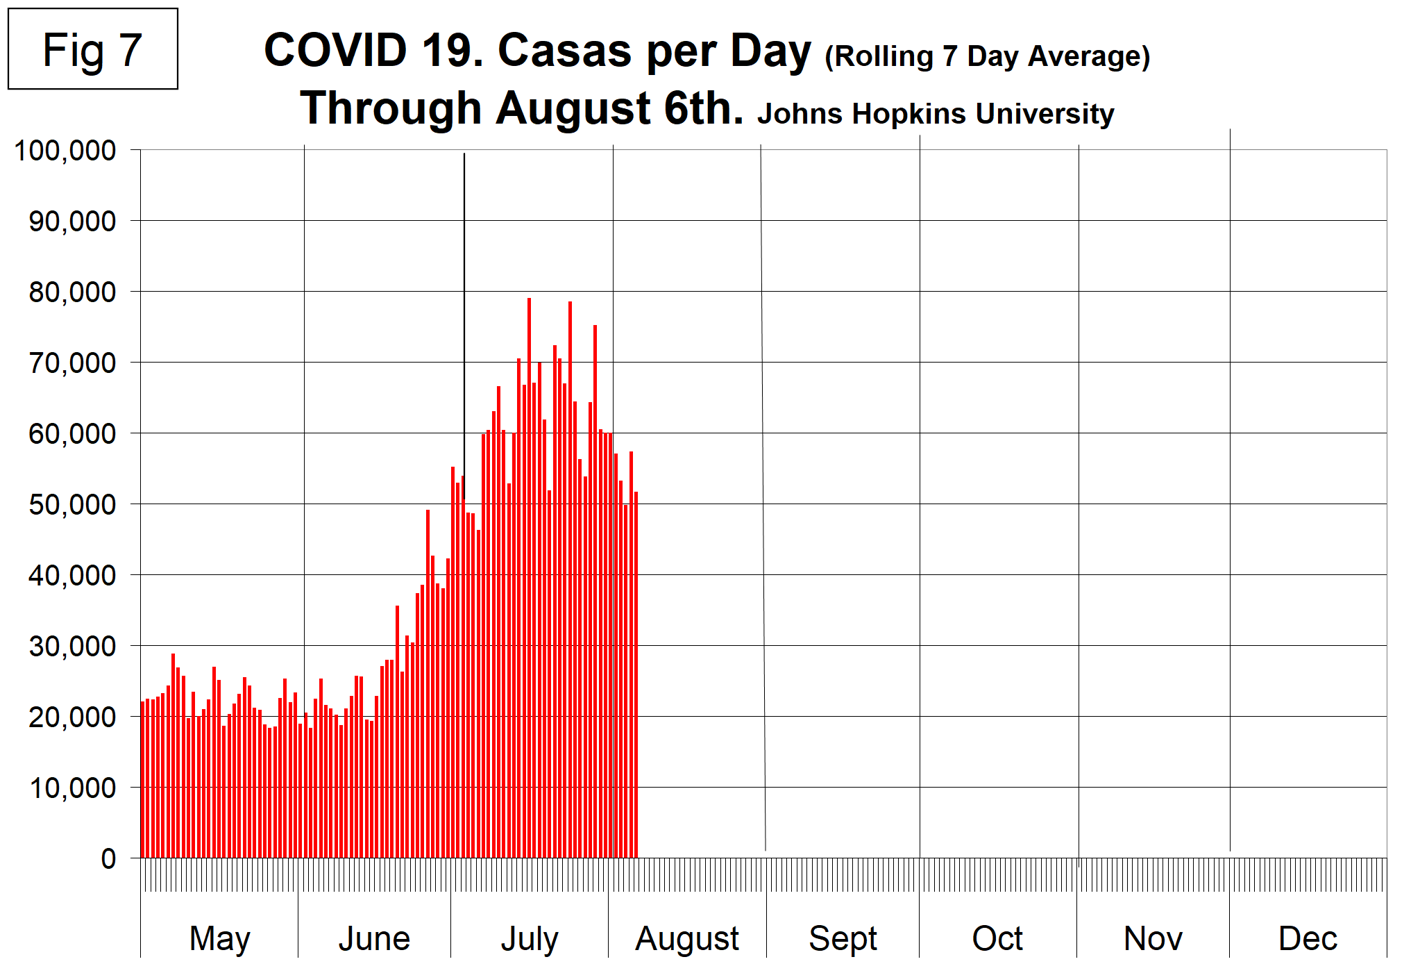
SMU Comment: The net job creation reports of May through July were better than expected but still dismal. Consumer spending will be depressed for at least the rest of 2020 and probably much longer. Steel consumption will follow. New cases of COVID-19 infections surged from mid-June to mid-July. There has been a decline in the last three weeks, but the daily total is still over 50,000. Figure 7 shows the daily new case count since May 1.
Explanation: On the first Friday of each month, the Bureau of Labor Statistics releases the employment data for the previous month. Data is available at www.bls.gov. The BLS reports on the results of two surveys. The Establishment survey reports the actual number employed by industry. The Household survey reports on the unemployment rate, participation rate, earnings, average workweek, the breakout into full-time and part-time workers and lots more details describing the age breakdown of the unemployed, reasons for and duration of unemployment. It’s important to understand that none of these numbers is an actual count of everyone employed across the country. No one keeps comprehensive records, and they’re certainly not processed centrally on a monthly basis. All the reported numbers are based on samples of the population. At Steel Market Update, we track the job creation numbers by many different categories. The BLS database is a reality check for other economic data streams such as manufacturing and construction. We include the net job creation figures for those two sectors in our “Key Indicators” report. It is easy to drill down into the BLS database to obtain employment data for many subsectors of the economy. For example, among hundreds of sub-indexes are truck transportation, auto production and primary metals production. The important point about all these data streams is the direction in which they are headed. Whenever possible, we try to track three separate data sources for a given steel-related sector of the economy. We believe this gives a reasonable picture of market direction. The BLS data is one of the most important sources of fine-grained economic data that we use in our analyses. The states also collect their own employment numbers independently of the BLS. The compiled state data compares well with the federal data. Every three months, SMU examines the state data and provides a regional report, which indicates strength or weakness on a geographic basis. Reports by individual state can be produced on request.


