

Market Data

September 8, 2020
Employment Gains Exceed Expectations in October
Written by Peter Wright
The economy added 638,000 jobs in October, exceeding consensus expectations, reported the Bureau of Labor Statistics. Expectations were for a gain of 600,000.
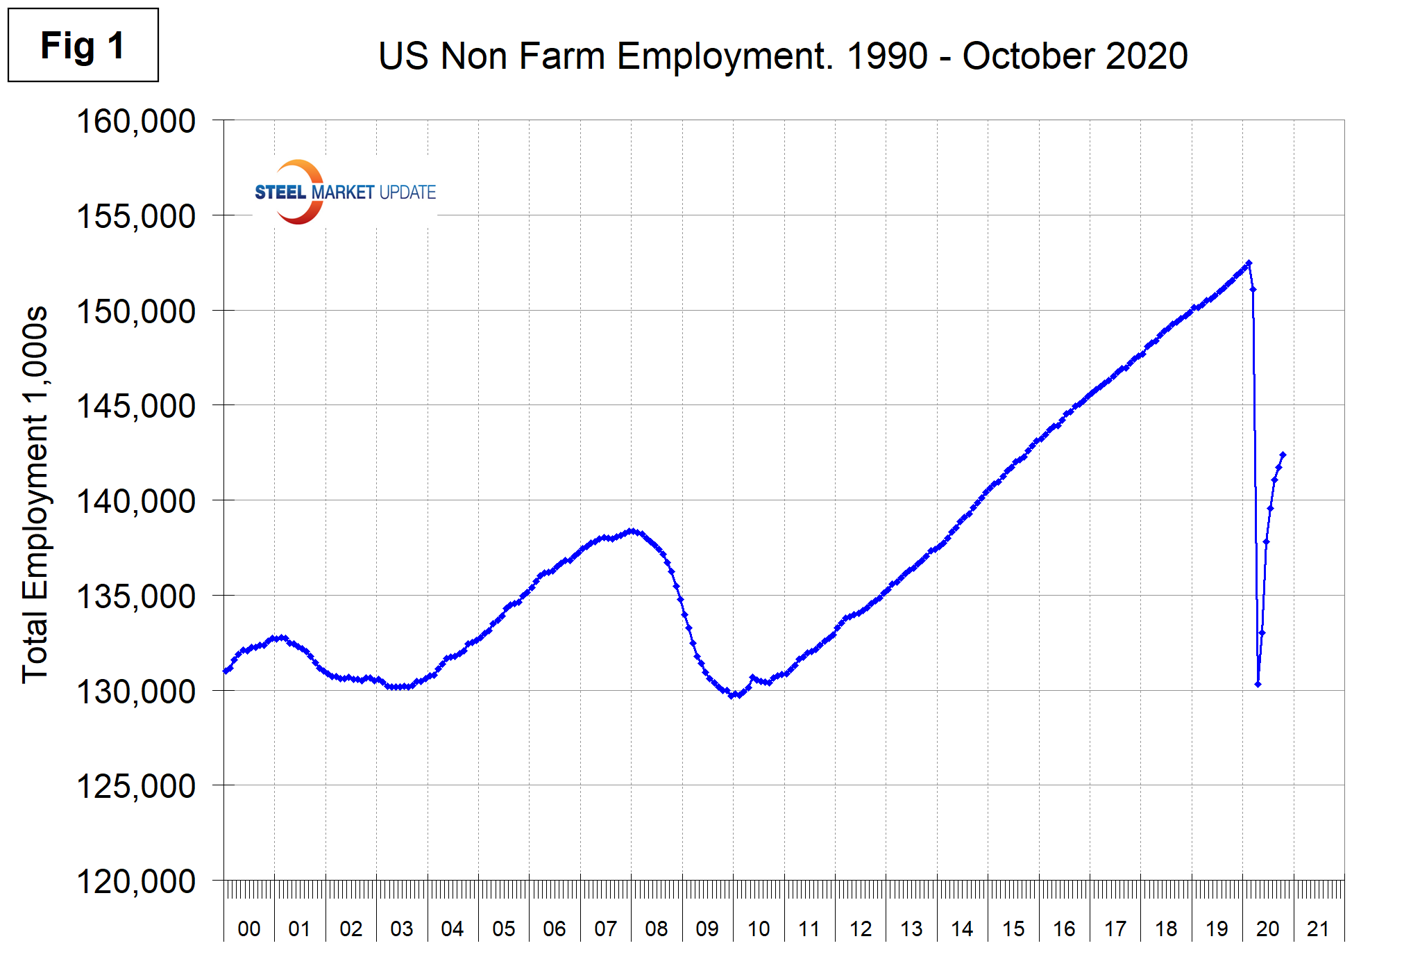
In the October data, the August gain was revised up by 4,000 and September was revised up by 15,000. Of the job losses in March and April, 10,090,000 are still unemployed. Figure 1 shows the total number of nonfarm employed people in the U.S. since 2000.
The BLS stated Nov. 6: “Total nonfarm payroll employment rose by 638,000 in October, and the unemployment rate declined to 6.9 percent. These improvements in the labor market reflect the continued resumption of economic activity that had been curtailed due to the coronavirus (COVID-19) pandemic and efforts to containit. In October, notable job gains occurred in leisure and hospitality, professional and business services, retail trade and construction. Employment in government declined. Construction added 84,000 jobs in October. Specialty trade contractors added jobs, both in the nonresidential (+28,000) and residential (+18,000) components. Employment also rose in heavy and civil engineering construction and in construction of buildings (+19,000 each). Construction hasadded 789,000 jobs in the last six months, but employment is down by 294,000 since February. Manufacturing employment rose by 38,000 in October, but is 621,000 lower than in February. Gains occurred in fabricated metal products (+7,000), primary metals (+6,000), and wood products (+4,000). Employment continued to trend up in food manufacturing (+6,000) and in plastics and rubber products (+4,000).”
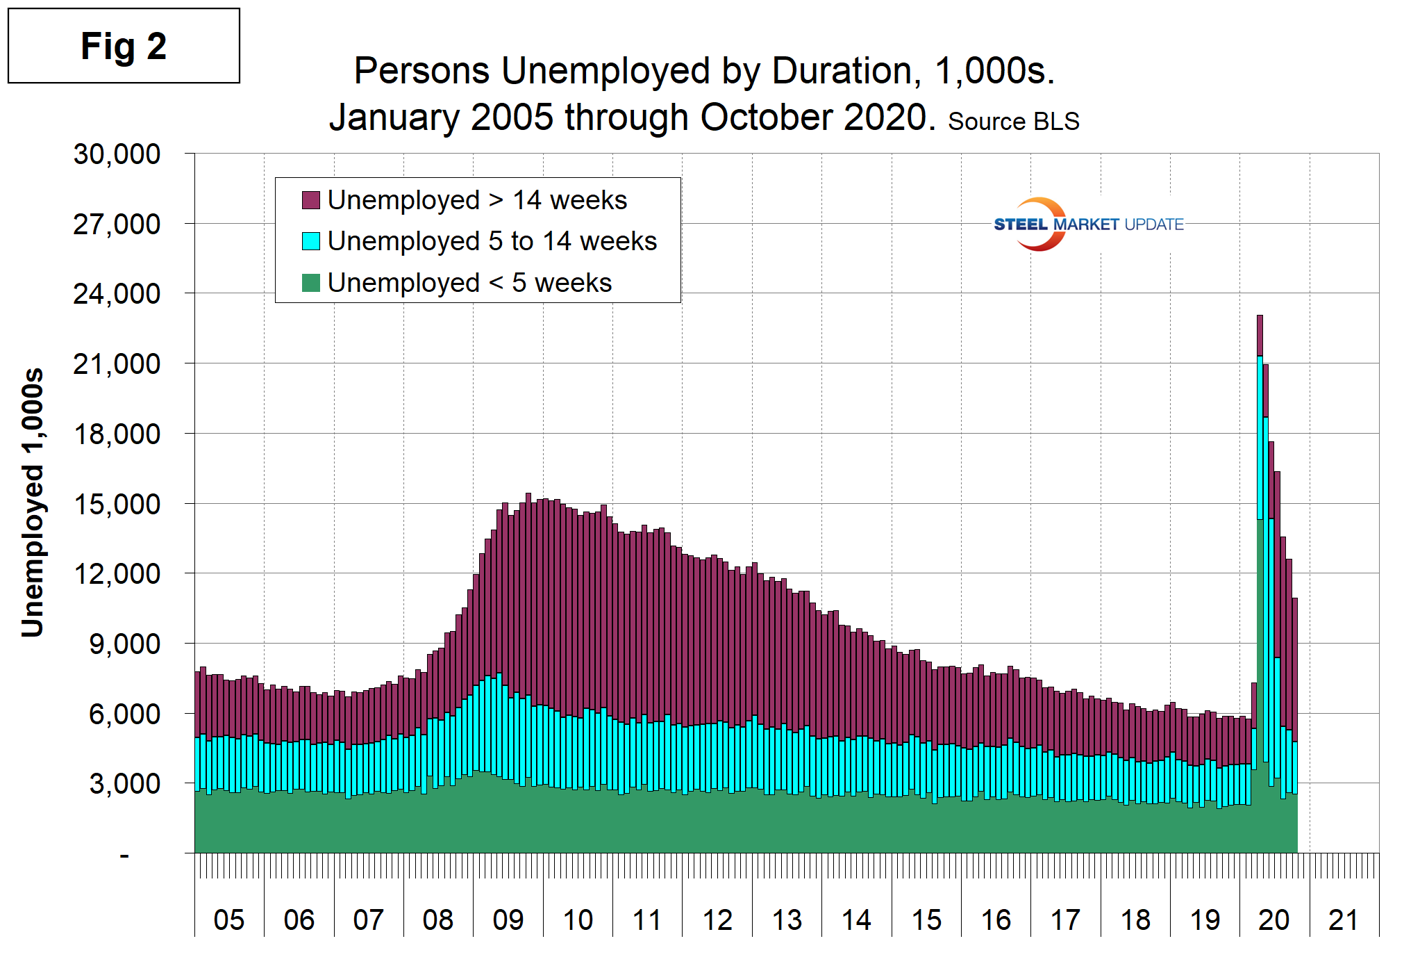
Figure 2 shows the historical picture for the duration of unemployment since January 2005 broken down into < 5 weeks, 5 to 14 weeks and > 14 weeks. The total number unemployed was 10,948,000 at the end of October, down from 23,059,000 at the end of April. As of Oct. 30, 56 percent had been unemployed for more than 14 weeks, 21 percent for 5 to 14 weeks and 23 percent for less than 5 weeks. The biggest change in the month of October was in the number unemployed for more than 14 weeks, which declined by 1.15 million.
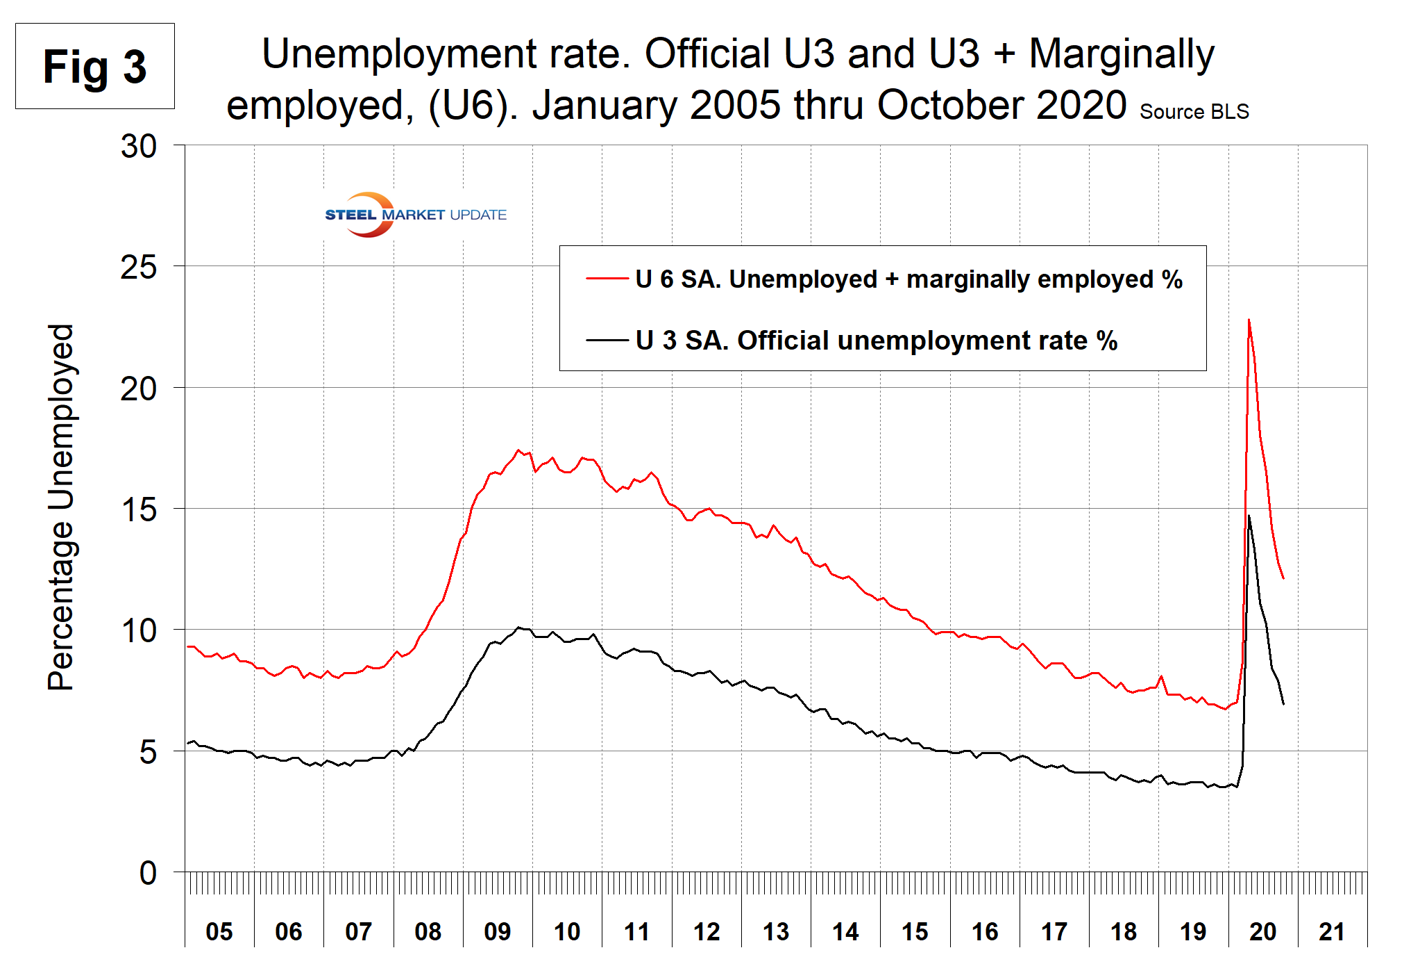
The official unemployment rate, U3, reported in the BLS Household survey (see explanation below) increased from 3.5 percent in February to 14.7 percent in April and declined to 6.9 percent in October. The more comprehensive U6 unemployment rate, at 12.1 percent in October, improved from 22.8 percent in April (Figure 3). U6 includes individuals working part time who desire full-time work and those who want to work but are so discouraged they have stopped looking.
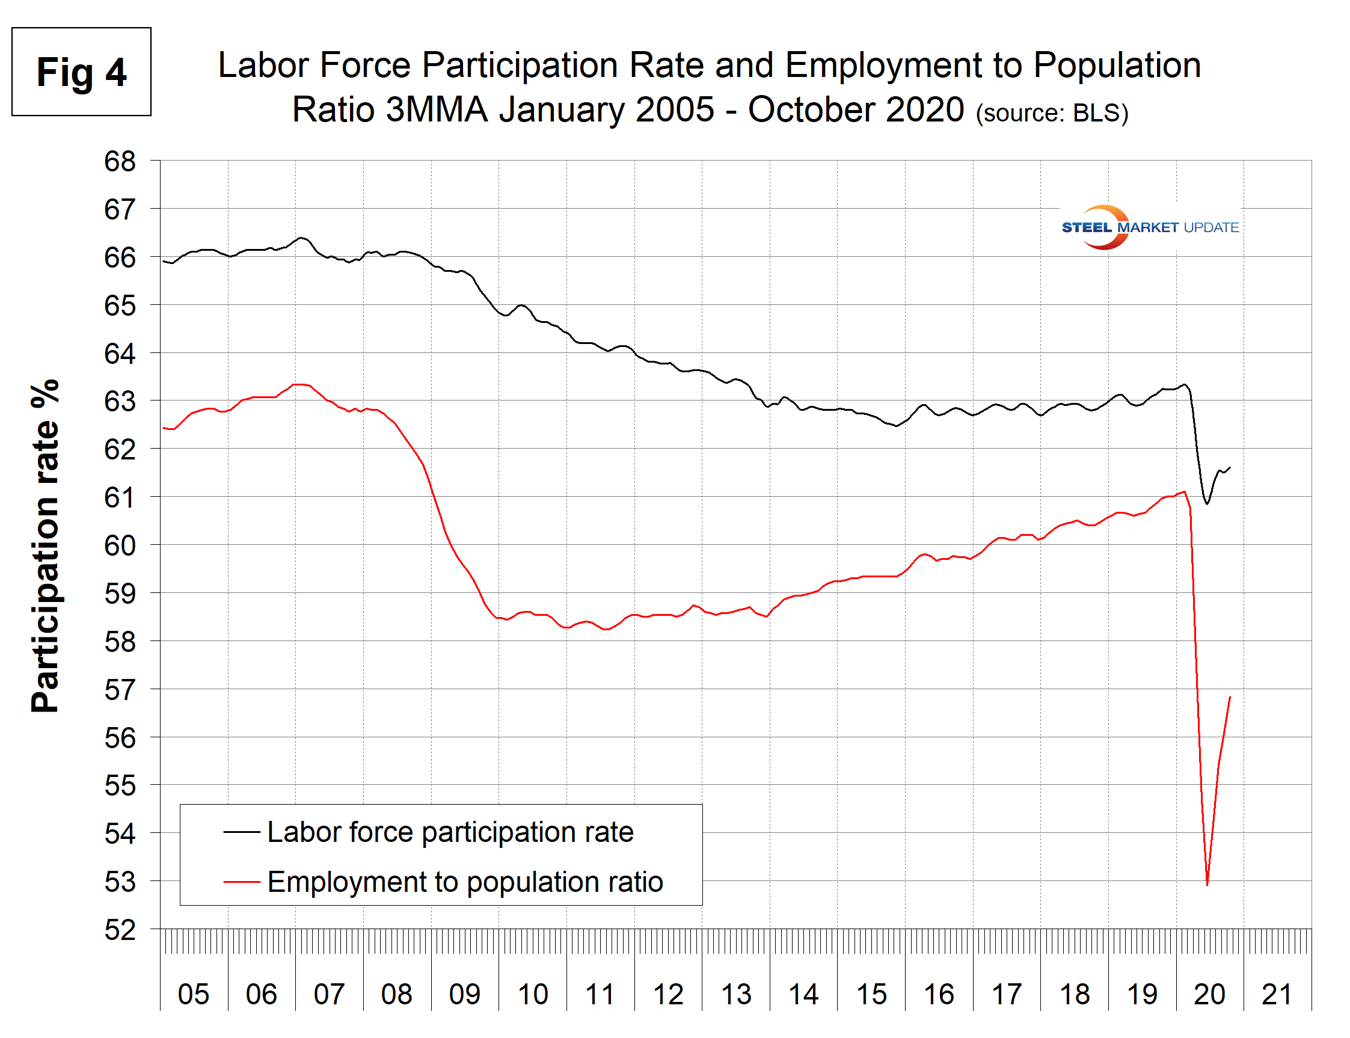
The labor force participation rate is calculated by dividing the number of people actively participating in the labor force by the total number of people eligible to participate. This measure was 61.7 percent in October, up from 60.2 percent in April but down from 63.4 percent in January and February. Another gauge is the number employed as a percentage of the population, which we think is more definitive. In October, the employment-to-population ratio was 57.4 percent, up from the low point of 51.3 percent in April. Figure 4 shows both measures on one graph.
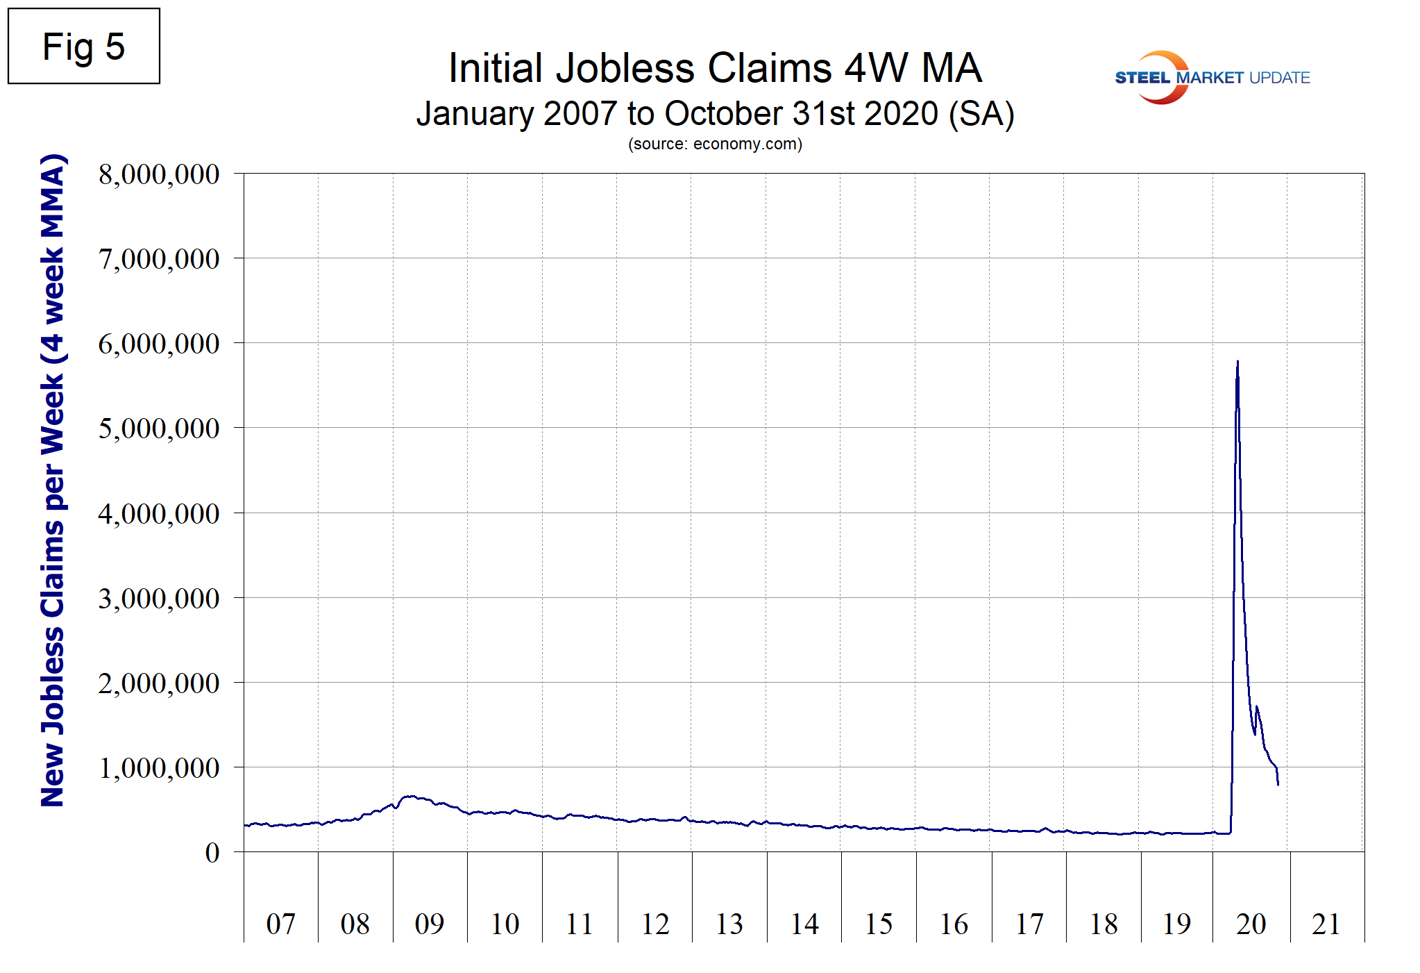
Initial claims for unemployment insurance are reported weekly by the Department of Labor. The pandemic effect began in the week ending March 21 when new claims shot up from 282,000 in the previous week to 3.3 million. The peak for claims was 6.9 million in the week ending March 28. Since then new claims have fallen steadily to 751,000 in the week ending Oct. 31. New filings are still higher than they were at the peak of the Great Recession. Figure 5 shows the four-week moving average of new claims since January 2007.
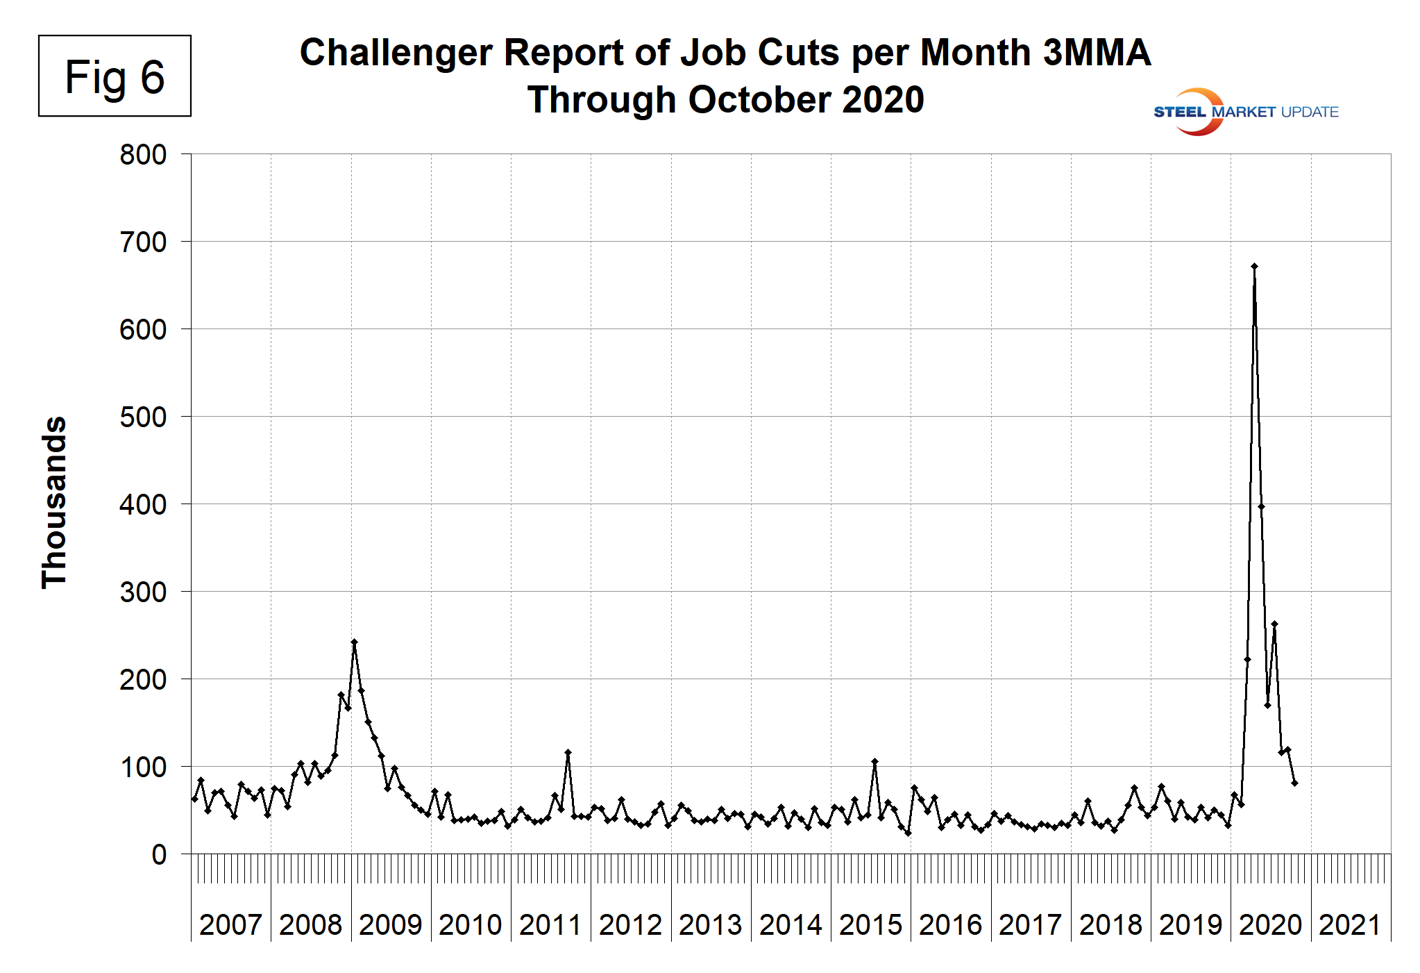
HR firm Challenger, Gray and Christmas Inc. produces a monthly employment update for the U.S. and reported that job cuts in October were 80,700, down from 118,800 in September. The three-month moving average (3MMA) has declined in each of the last five months. “October marked the lowest number of layoffs in seven months, as U.S.-based employers announced plans to cut 80,666 jobs from their payrolls,” Challenger reported. “October’s total is 32% lower than the 118,804 cuts announced in September. It is 60% higher than the 50,275 cuts in the same month last year. October’s total is the lowest since February, when 56,605 cuts were announced. So far this year, 2,162,928 job cuts have been announced, 320% higher than the 515,144 cuts announced through October last year. It is the highest annual total on record.”
“The bulk of the announcements this year are indeed in industries directly impacted by shutdown orders and consumers’ wariness to spend money in such places, like restaurants, hotels, bars, and brick-and-mortar retail. We’ve now seen tens of thousands of cuts in industries outside Entertainment and Retail, indicating the impact is spreading,” said Senior Vice President Andrew Challenger. “The lower numbers certainly indicate some companies impacted by shutdown orders were able to reopen and stave off cutting jobs. However, as case counts rise and more jurisdictions impose stricter enforcement, and stimulus money dries up with no coming legislation, uncertainty is likely guiding many company decisions on retaining workers,” he added.
Figure 6 shows the monthly job cuts reported by Challenger on a 3MMA basis since January 2007.
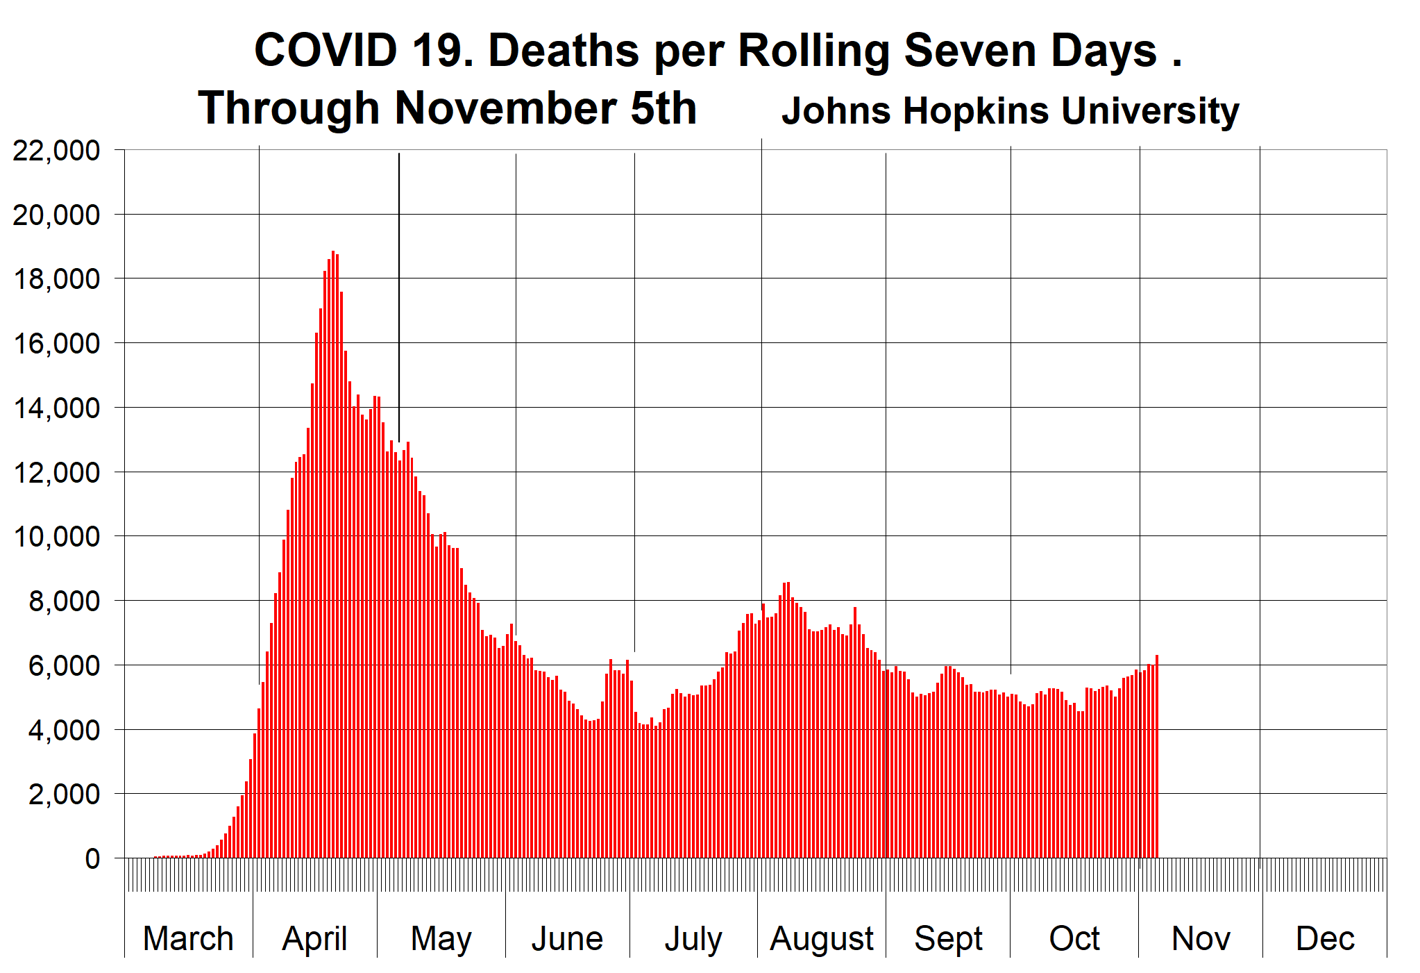
SMU Comment: February 2020 was the all-time high for nonfarm employment in the U.S. Since then the pandemic has wreaked havoc in the job market and we may now be entering a third wave of deaths. If this necessitates more draconian business curtailment as is happening in Europe, then we can expect deterioration in the employment statistics. Employment drives consumer spending, GDP and ultimately steel demand. The figure below shows the rolling seven-day death count attributed to COVID-19 and reported by the Johns Hopkins Center for Systems Science and Engineering, There has been a steady increase in deaths since mid-October, but the rate of increase is not as great as occurred in April and July. It is evident that the lethality of the disease is declining, probably as a result of better treatment and a lower average age of the infected.
Explanation: On the first Friday of each month, the Bureau of Labor Statistics releases the employment data for the previous month. Data is available at www.bls.gov. The BLS reports on the results of two surveys. The Establishment survey reports the actual number employed by industry. The Household survey reports on the unemployment rate, participation rate, earnings, average workweek, the breakout into full-time and part-time workers and lots more details describing the age breakdown of the unemployed, reasons for and duration of unemployment. It’s important to understand that none of these numbers is an actual count of everyone employed across the country. No one keeps comprehensive records, and they’re certainly not processed centrally on a monthly basis. All the reported numbers are based on samples of the population.
At Steel Market Update, we track the job creation numbers by many different categories. The BLS database is a reality check for other economic data streams such as manufacturing and construction. We include the net job creation figures for those two sectors in our “Key Indicators” report. It is easy to drill down into the BLS database to obtain employment data for many subsectors of the economy. For example, among hundreds of sub-indexes are truck transportation, auto production and primary metals production. The important point about all these data streams is the direction in which they are headed. Whenever possible, we try to track three separate data sources for a given steel-related sector of the economy. We believe this gives a reasonable picture of market direction. The BLS data is one of the most important sources of fine-grained economic data that we use in our analyses. The states also collect their own employment numbers independently of the BLS. The compiled state data compares well with the federal data. Every three months, SMU examines the state data and provides a regional report, which indicates strength or weakness on a geographic basis. Reports by individual state can be produced on request.


