

Market Data

September 8, 2020
Net Job Creation: Employment Gains Slow in September
Written by Peter Wright
The September jobs report was released by the Bureau of Labor Statistics (BLS) on Friday and failed to meet the consensus expectation. September’s net gain was 661,000. The average monthly gain in the four months May through August was 2.7 million. In the September data, the July gain was revised up by 27,000 and August was revised up by 118,000. Of the job losses in March and April, 52 percent have now been recovered.
![]()
Figure 1 shows the total number of nonfarm employed people in the U.S. since 2000. The net loss since February’s all-time high result stands at 10.7 million.
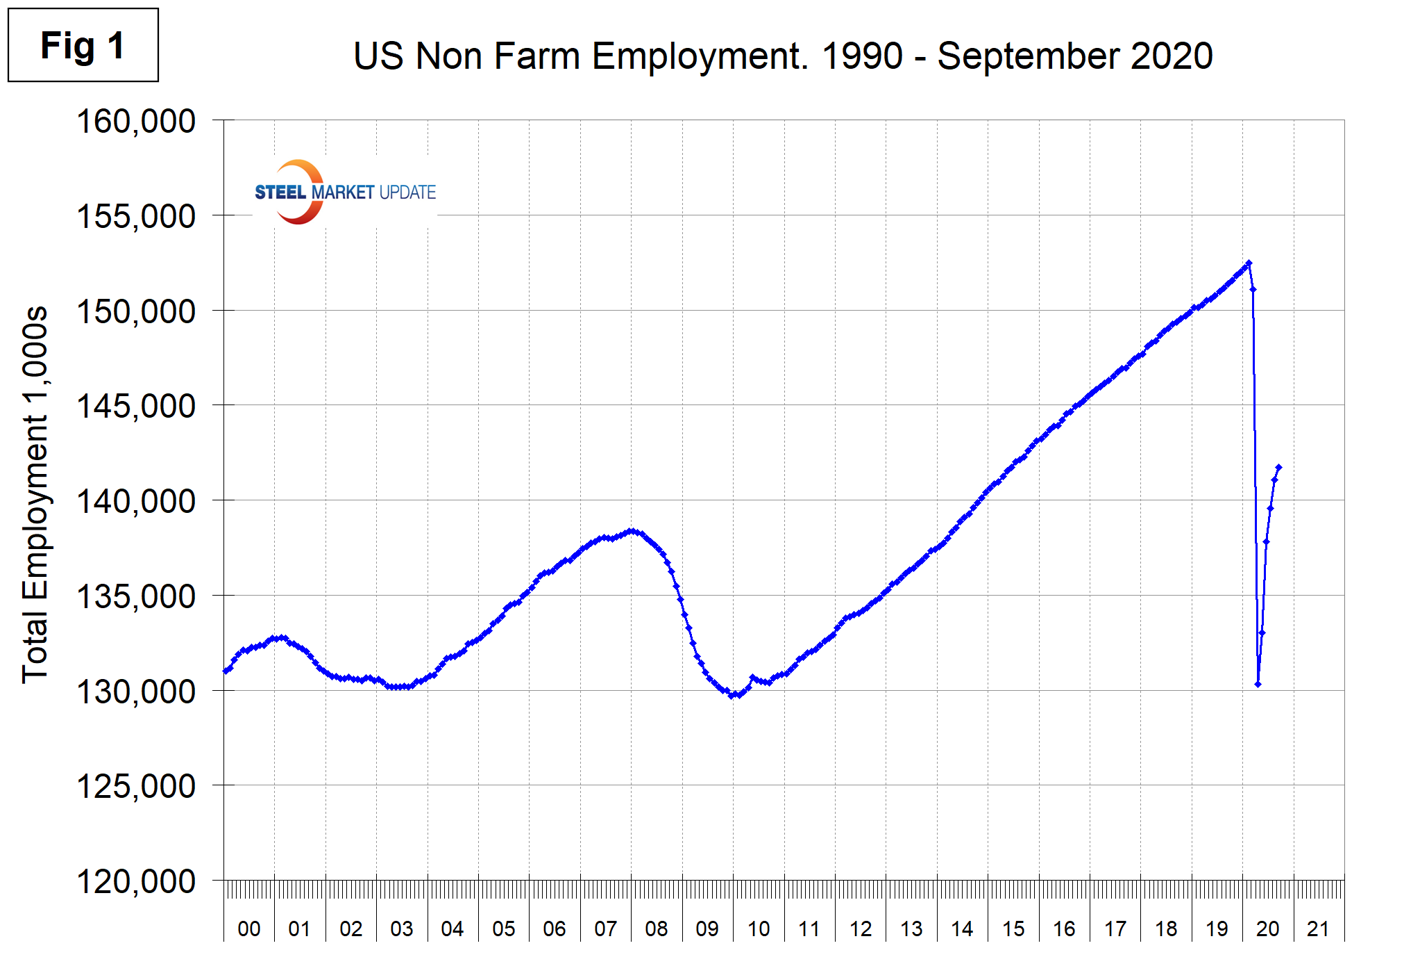
As the BLS reported Oct. 2: “Total nonfarm payroll employment rose by 661,000 in September, and the unemployment rate declined to 7.9 percent.
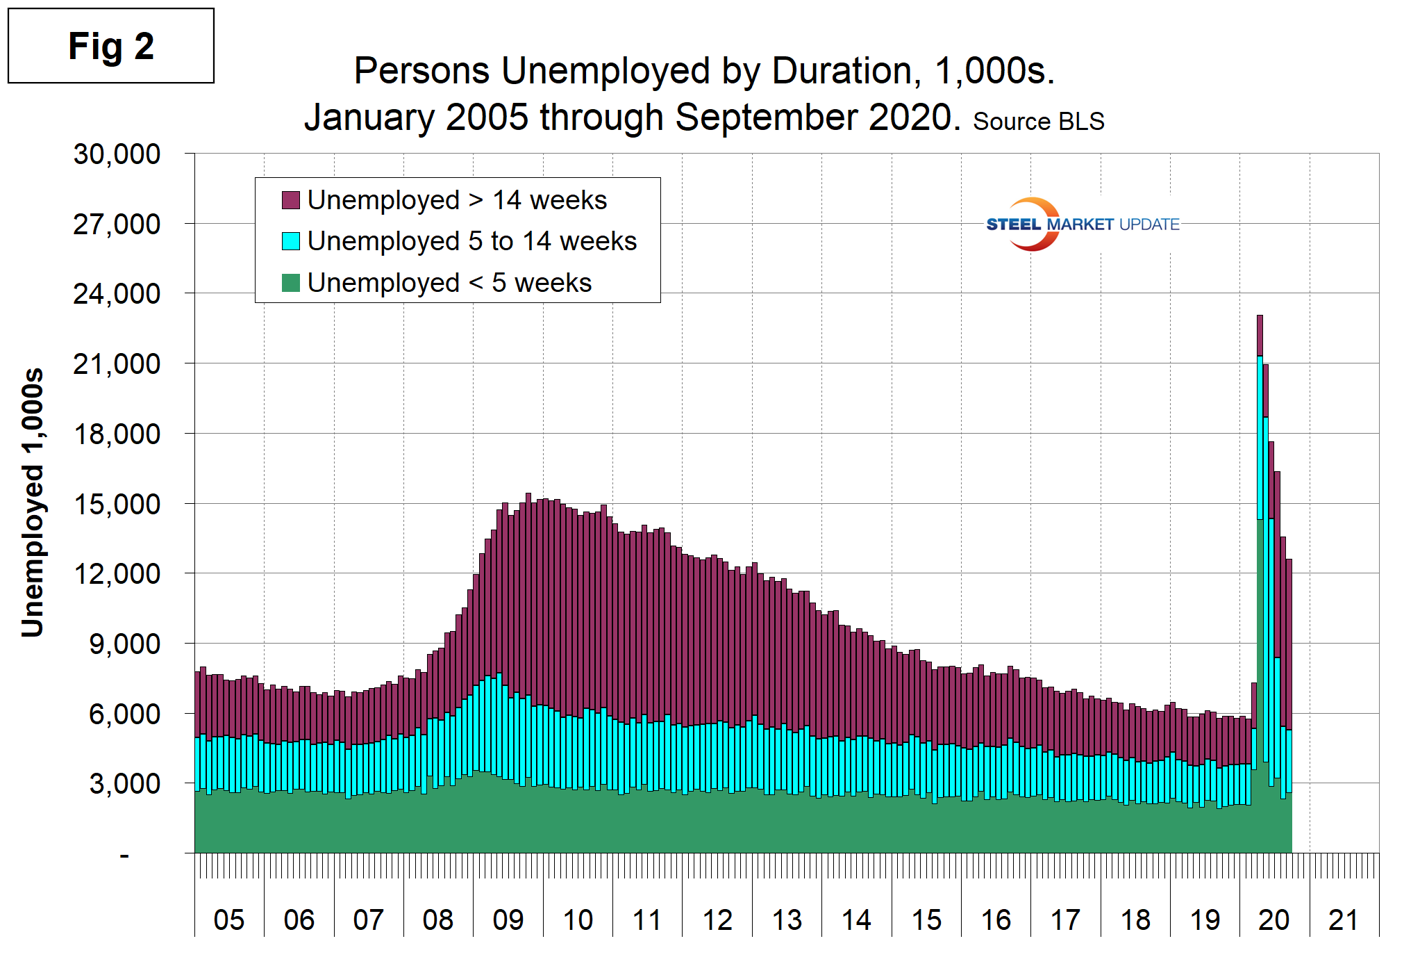
These improvements in the labor market reflect the continued resumption of economic activity that had been curtailed due to the coronavirus (COVID-19) pandemic and efforts to contain it. In September, notable job gains occurred in leisure and hospitality, in retail trade, in health care and social assistance, and in professional and business services. Employment in government declined over the month, mainly in state and local government education.”Figure 2 shows the historical picture for the duration of unemployment since January 2005 broken down into < 5 weeks, 5 to 14 weeks, and > 14 weeks. The total number unemployed was 12.6 million at the end of September, down from 23,059,000 at the end of April. As of Sept. 30, 58 percent had been unemployed for more than 14 weeks, 22 percent for 5-14 weeks and 20 percent for less than 5 weeks.
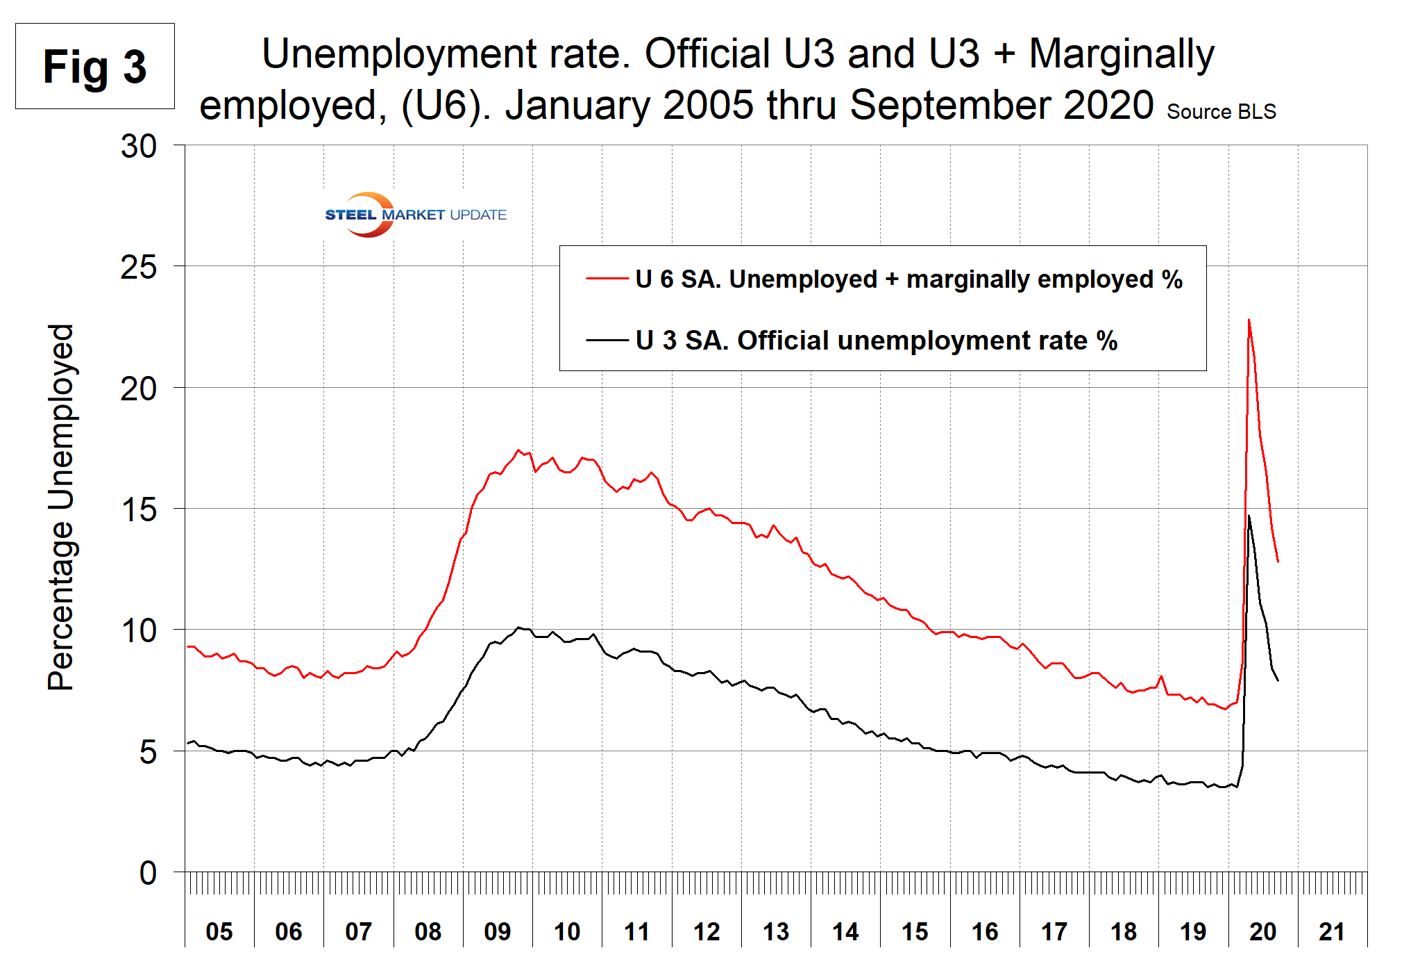
The official unemployment rate, U3, reported in the BLS Household survey (see explanation below) increased from 3.5 percent in February to 14.7 percent in April and declined to 7.9 percent in September. The more comprehensive U6 unemployment rate, at 12.8 percent in September, improved from 22.8 percent in April (Figure 3). U6 includes individuals working part time who desire full-time work and those who want to work but are so discouraged they have stopped looking.
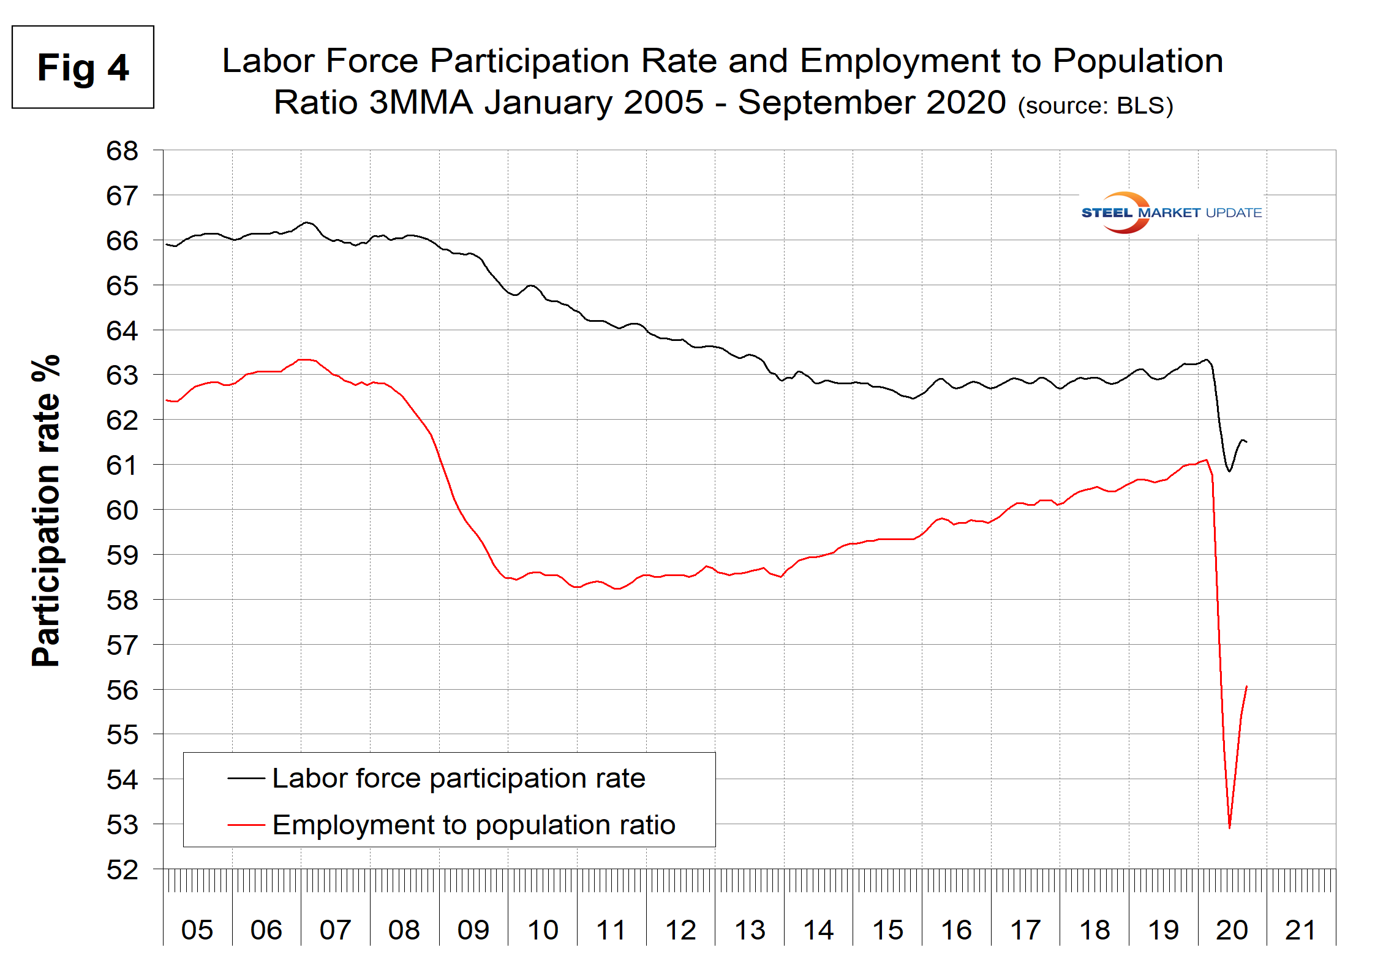
The labor force participation rate is calculated by dividing the number of people actively participating in the labor force by the total number of people eligible to participate. This measure was 61.4 percent in September, up from 60.2 percent in April but down from 63.4 percent in January and February. Another gauge is the number employed as a percentage of the population, which we think is more definitive. In September, the employment-to-population ratio was 56.6 percent, up from the low point of 51.3 percent in April. Figure 4 shows both measures on one graph.
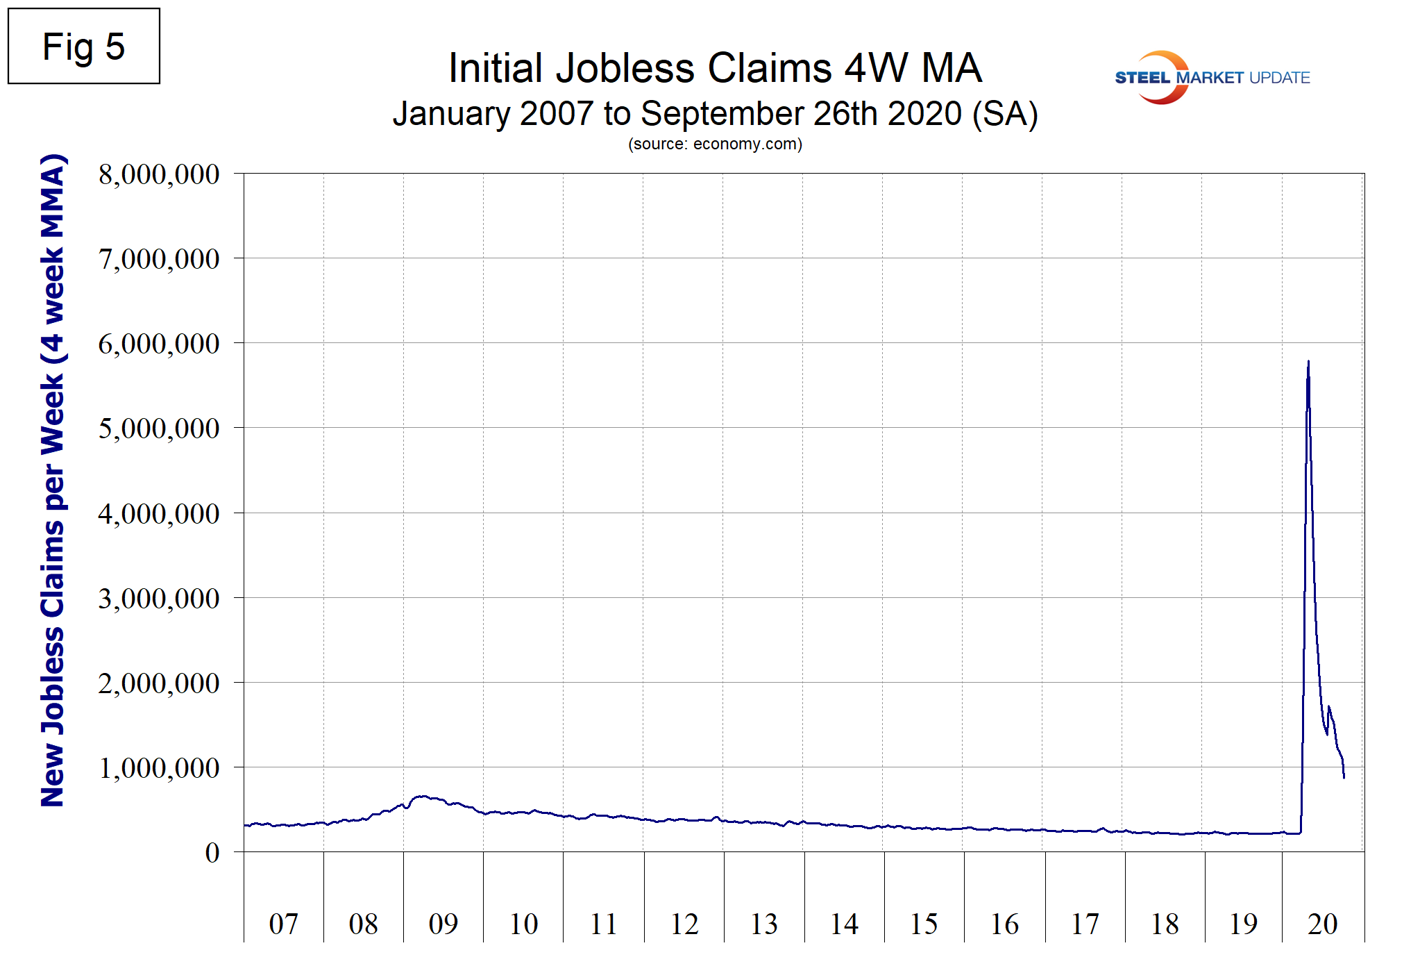
Initial claims for unemployment insurance are reported weekly by the Department of Labor. The pandemic effect began in the week ending March 21 when new claims shot up from 282,000 in the previous week to 3.3 million. The peak was 6.9 million in w/e March 28. Since then new claims have fallen steadily to 837,000 in w/e Sept. 26. New filings are still much higher than they were at the peak of the Great Recession. Figure 5 shows the four-week moving average of new claims since January 2007.
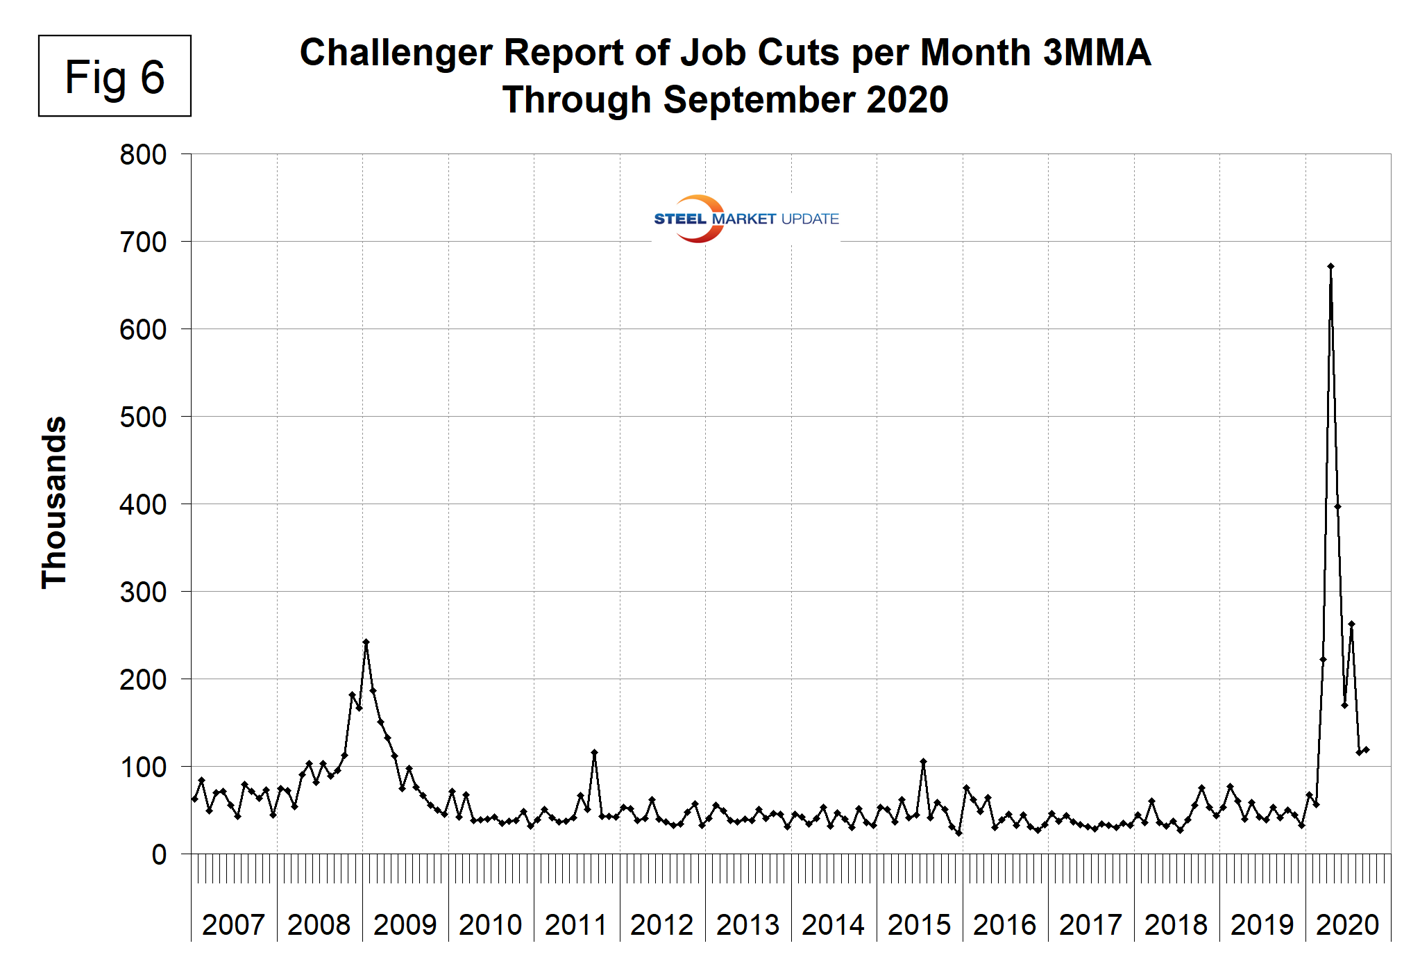
Challenger, Gray and Christmas produces a monthly employment update for the U.S. and reported that the third quarter of 2020 saw 497,215 job cuts, down 59.8 percent from the 1,238,364 cuts announced in the second quarter. That is 271 percent higher than the 133,882 cuts announced in the third quarter of last year. The majority of cuts continue to come from Entertainment/Leisure companies, including bars, restaurants, hotels, and amusement parks, which announced 32,099 cuts in September, an 86 percent increase over the cuts announced in August. Aerospace/Defense announced the second-highest number of job cuts in September, with 18,971, bringing the year-to-date total to 74,867. That is 1,158 percent higher than the 5,953 cuts announced in that sector through the third quarter of last year. The Transportation sector followed with 16,628 cuts for the month, bringing the sector total through September to 148,199, 517 percent higher than the 24,034 announced through the same period in 2019. “We are beginning to see cuts spread to sectors outside Entertainment and Retail. If another relief package fails to pass, employers are going to enter the fourth quarter hesitant to invest or spend,” said Challenger. Figure 6 shows the monthly job cuts reported by Challenger on a three-month moving average (3MMA) basis since January 2007.
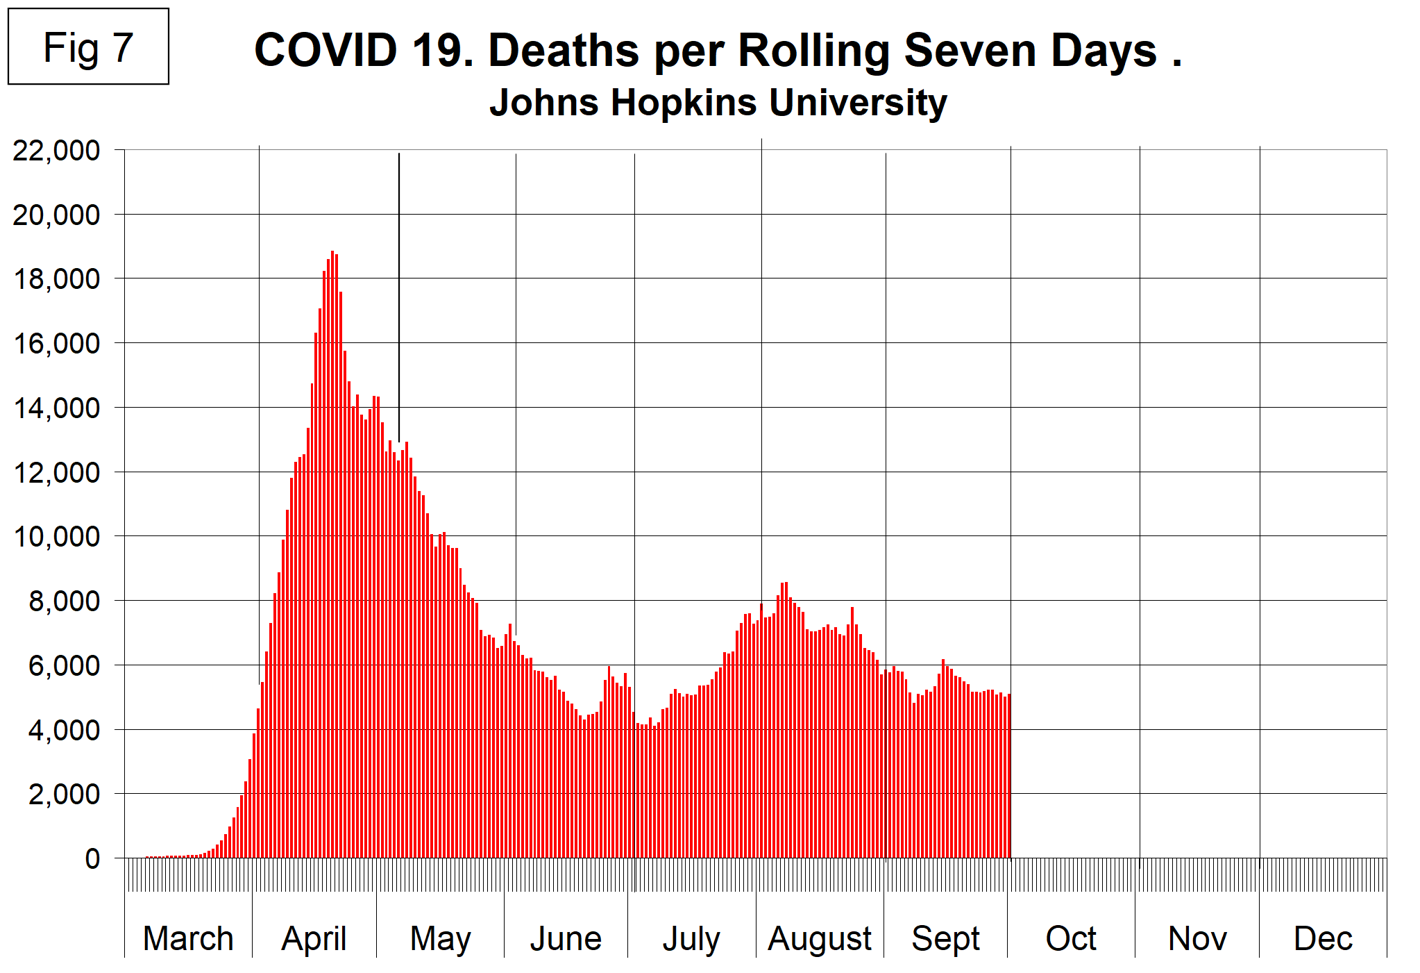
SMU Comment: February 2020 was the all-time high for nonfarm employment in the U.S. The first wave of the pandemic hit in March, followed by a less severe second wave of deaths in August, with a flattening in September. Winter and the flu season are approaching, which makes it impossible to speculate how employment will perform in the fourth quarter. Employment drives consumer spending, GDP and ultimately steel demand. If the pandemic worsens in the winter months, then the recent gains in steel demand could evaporate. Figure 7 shows the rolling seven-day death count attributed to COVID-19 and reported by the Johns Hopkins Center for Systems Science and Engineering.
Explanation: On the first Friday of each month, the Bureau of Labor Statistics releases the employment data for the previous month. Data is available at www.bls.gov. The BLS reports on the results of two surveys. The Establishment survey reports the actual number employed by industry. The Household survey reports on the unemployment rate, participation rate, earnings, average workweek, the breakout into full-time and part-time workers and lots more details describing the age breakdown of the unemployed, reasons for and duration of unemployment. It’s important to understand that none of these numbers is an actual count of everyone employed across the country. No one keeps comprehensive records, and they’re certainly not processed centrally on a monthly basis. All the reported numbers are based on samples of the population. At Steel Market Update, we track the job creation numbers by many different categories. The BLS database is a reality check for other economic data streams such as manufacturing and construction. We include the net job creation figures for those two sectors in our “Key Indicators” report. It is easy to drill down into the BLS database to obtain employment data for many subsectors of the economy. For example, among hundreds of sub-indexes are truck transportation, auto production and primary metals production. The important point about all these data streams is the direction in which they are headed. Whenever possible, we try to track three separate data sources for a given steel-related sector of the economy. We believe this gives a reasonable picture of market direction. The BLS data is one of the most important sources of fine-grained economic data that we use in our analyses. The states also collect their own employment numbers independently of the BLS. The compiled state data compares well with the federal data. Every three months, SMU examines the state data and provides a regional report, which indicates strength or weakness on a geographic basis. Reports by individual state can be produced on request.


