

Market Data
September 11, 2020
Employment by Industry in August
Written by Peter Wright
Employment in manufacturing and construction is recovering much more slowly than in the overall economy. The net change in employed persons was negative 20.8 million in April. Each month since then has had positive growth, but the recovery slowed in July and August.
We have created a new summary chart for August to track the overall economy to a greater degree than in the past. Table 1 breaks total employment down into the major sectors. These account for 71.5 percent of all employed people in the U.S. The baseline against which future comparisons will be made is February 2020, the all-time high for nonfarm employment. As the situation unfolds, we will begin to see green shoots appear in Table 1 and will be able to compare the recovery of manufacturing and construction to other major sectors. The situation through August is that the leisure and hospitality industries have suffered by far the greatest decline and that other sectors are remarkably similar, all having single-digit declines since February. Manufacturing and construction have had almost exactly the same decline.
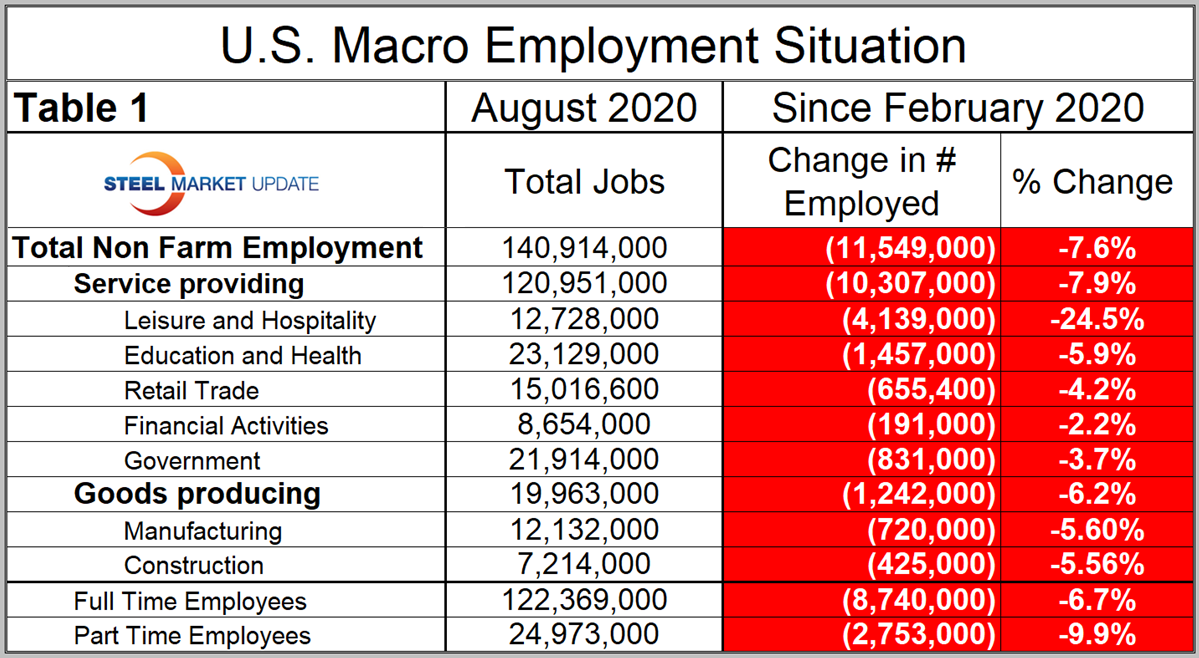
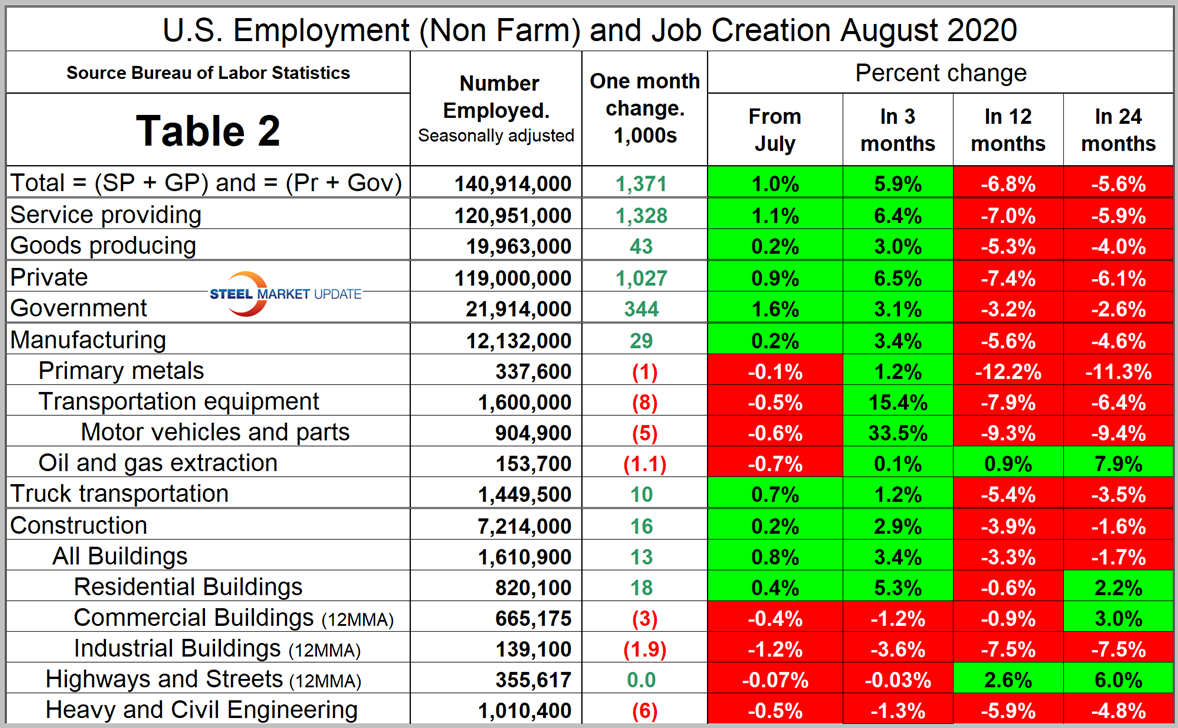
Table 2 is unchanged in format from previous publications and is designed on rolling time periods: 1 month, 3 months, 1 year and 2 years. It breaks total employment into service and goods-producing industries and then into private and government employees. Most of the goods-producing employees work in manufacturing and construction and the components of these two sectors of most relevance to steel people are identified. Note, the subcomponents of both manufacturing and construction shown in Table 1 don’t add up to the total because we have only included those with the most relevance to the steel industry.
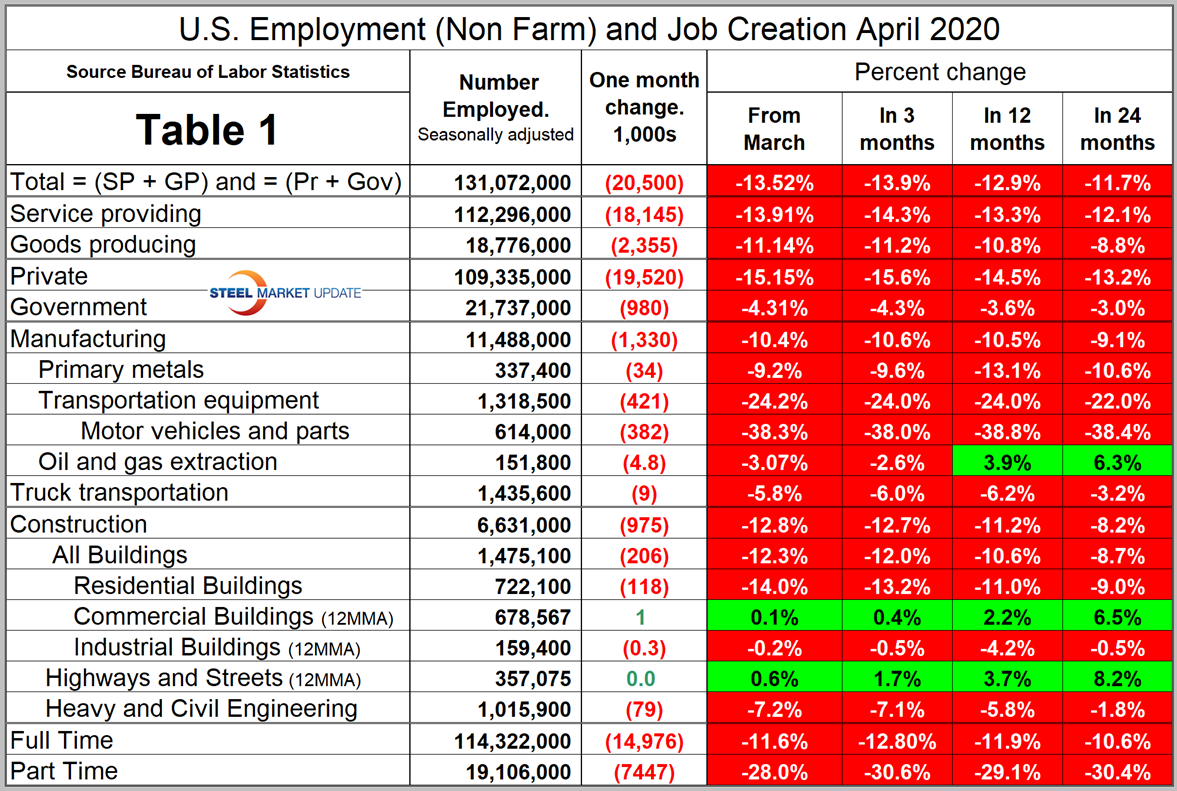
For comparison we include here the April version of Table 2.
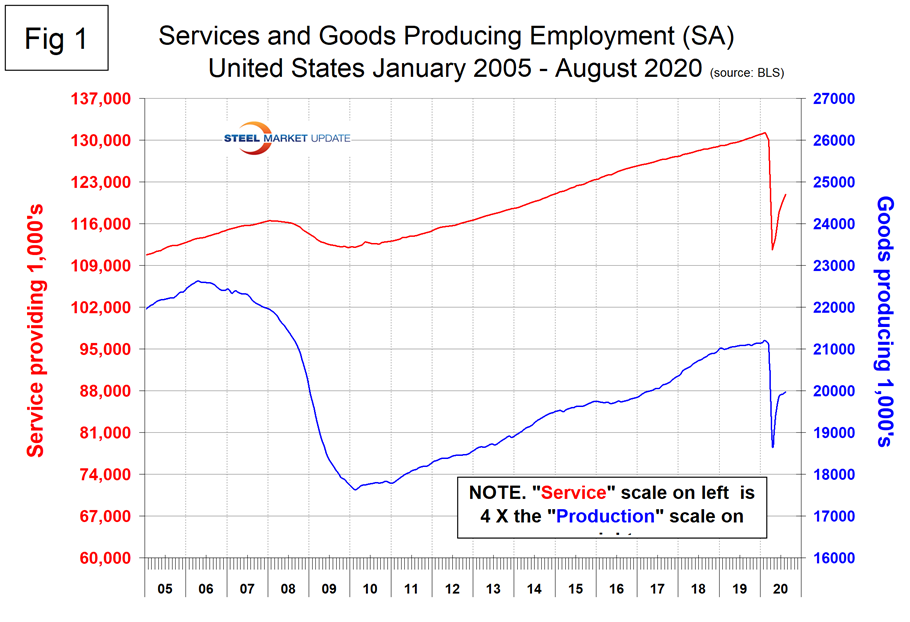
Comparing service industries to goods-producing in August to July’s result shows services to be up by 1.1 percent and goods-producing up by 0.2 percent (Figure 1). In the longer term, goods-producing has been hit less than services in both the 12- and 24-month periods.
The goods-producing section of this data is comprised mainly of manufacturing and construction employment. Comparing August to July, both were up by 0.2 percent. The BLS had this to say about manufacturing employment in their Sept. 4 report: “In August, manufacturing employment rose by 29,000, with gains concentrated in the nondurable goods component (+27,000). Despite gains in recent months, employment in manufacturing is 720,000 below February’s level.”
In May through August, manufacturing employment rose by 643,000, but is down by 720,000 since February. Employment in primary metals, transportation equipment, and oil and gas production were all down in August. Trucking gained 10,000 and has gained 19,000 jobs since April.
In May through August, construction added 658,000 jobs, but is down by 425,000 since February. In August, residential buildings gained 18,000 positions, but commercial, industrial buildings and heavy civil engineering declined.
Figure 2 shows the history of employment in manufacturing and construction since January 2005.
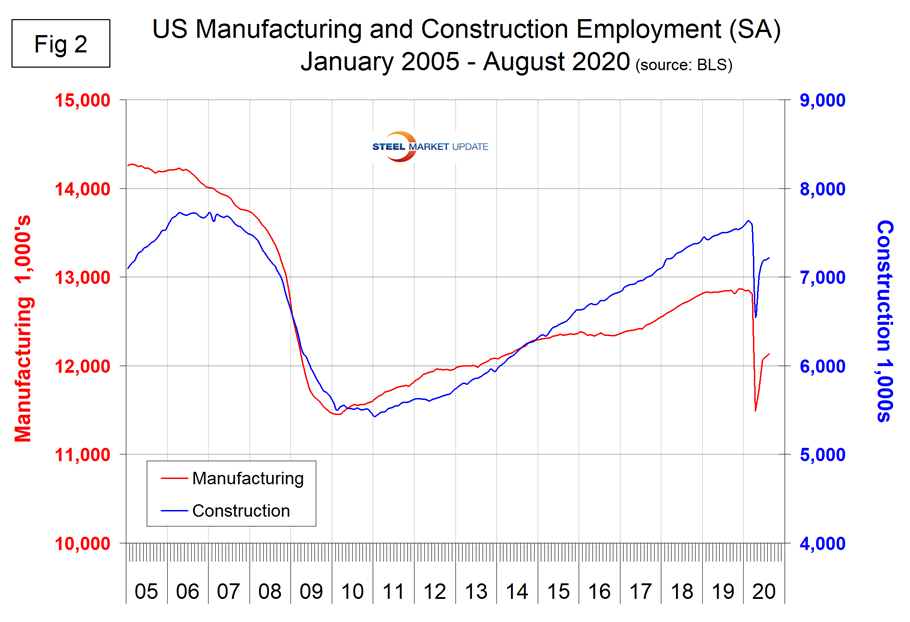
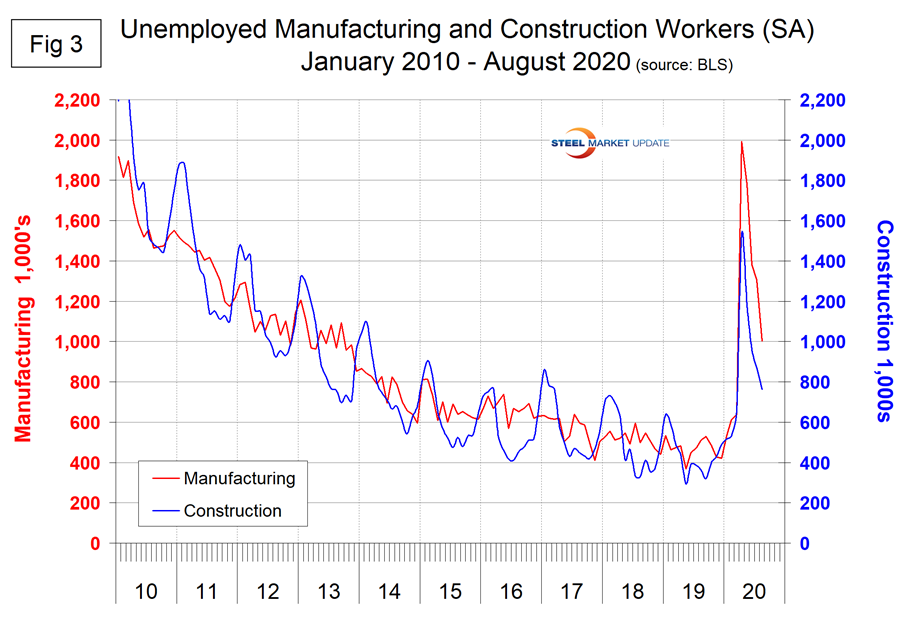
Figure 3 shows the reported number of unemployed manufacturing and construction workers. These were 1.003 million and 762,000, respectively, at the end of August.
SMU Comment: Our sense as far as steel demand is concerned is the same as last month. Year over year in August, manufacturing and construction employment were down by 5.6 percent and 3.9 percent, respectively. These sectors encompass most of the steel consumed in the U.S. and are not expected to show much further improvement in the balance of 2020. Residential construction is still healthy and is propping up the overall construction sector, but doesn’t consume much steel compared to nonresidential and infrastructure. Primary metals has performed much worse than overall manufacturing in all four time periods considered in Table 2.
Explanation: On the first or second Friday of each month, the Bureau of Labor Statistics releases the employment data for the previous month. Data is available at www.bls.gov. The BLS employment database is a reality check for other economic data streams such as manufacturing and construction. It is easy to drill down into the BLS database to obtain employment data for many subsectors of the economy. The important point about all these data streams is the direction in which they are headed.


