

Market Data

September 11, 2020
Employment by Industry in October
Written by Peter Wright
Through October, manufacturing has added 742,000 jobs and construction 789,000 since the pandemic-driven crash in April.
The baseline against which future comparisons are made in this analysis is February 2020, the all-time high for nonfarm employment. Figure 1 shows the total number of people employed in the nonfarm economy.
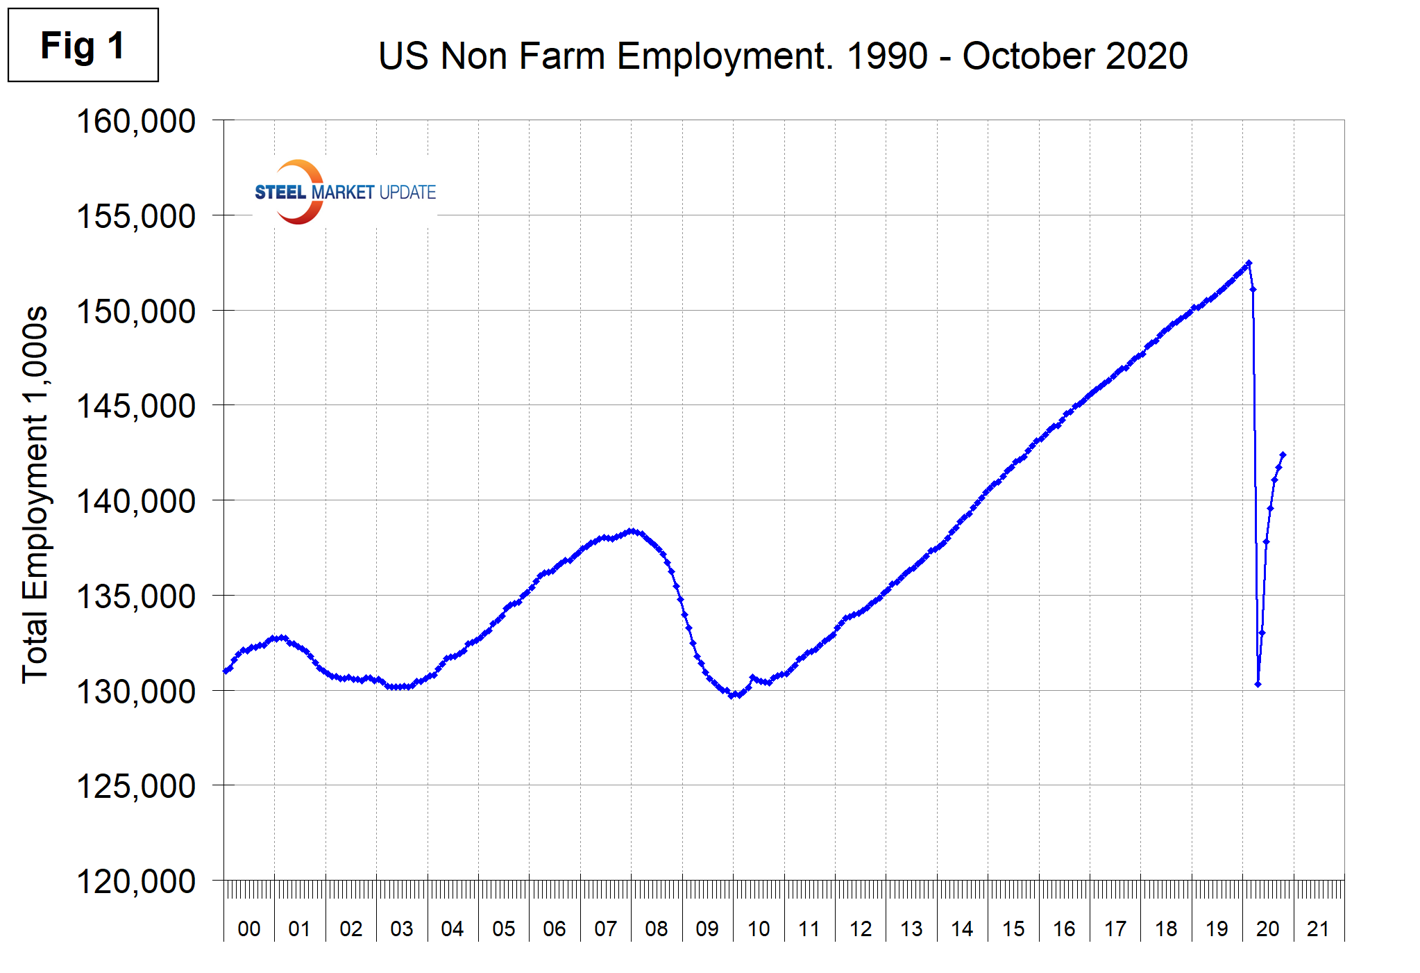
Table 1 is designed on rolling time periods, 1 month, 3 months, 1 year and 2 years. It breaks total employment into service and goods-producing industries and then into private and government employees. Most of the goods-producing employees work in manufacturing and construction and the components of these two sectors of most relevance to steel people are identified. Comparing service and goods-producing industries in October shows service jobs to have risen by 0.4 percent and goods-producing by 0.6 percent from September’s result. Note, the subcomponents of both manufacturing and construction shown in Table 1 don’t add up to the total because we have only included those with the most relevance to the steel industry.
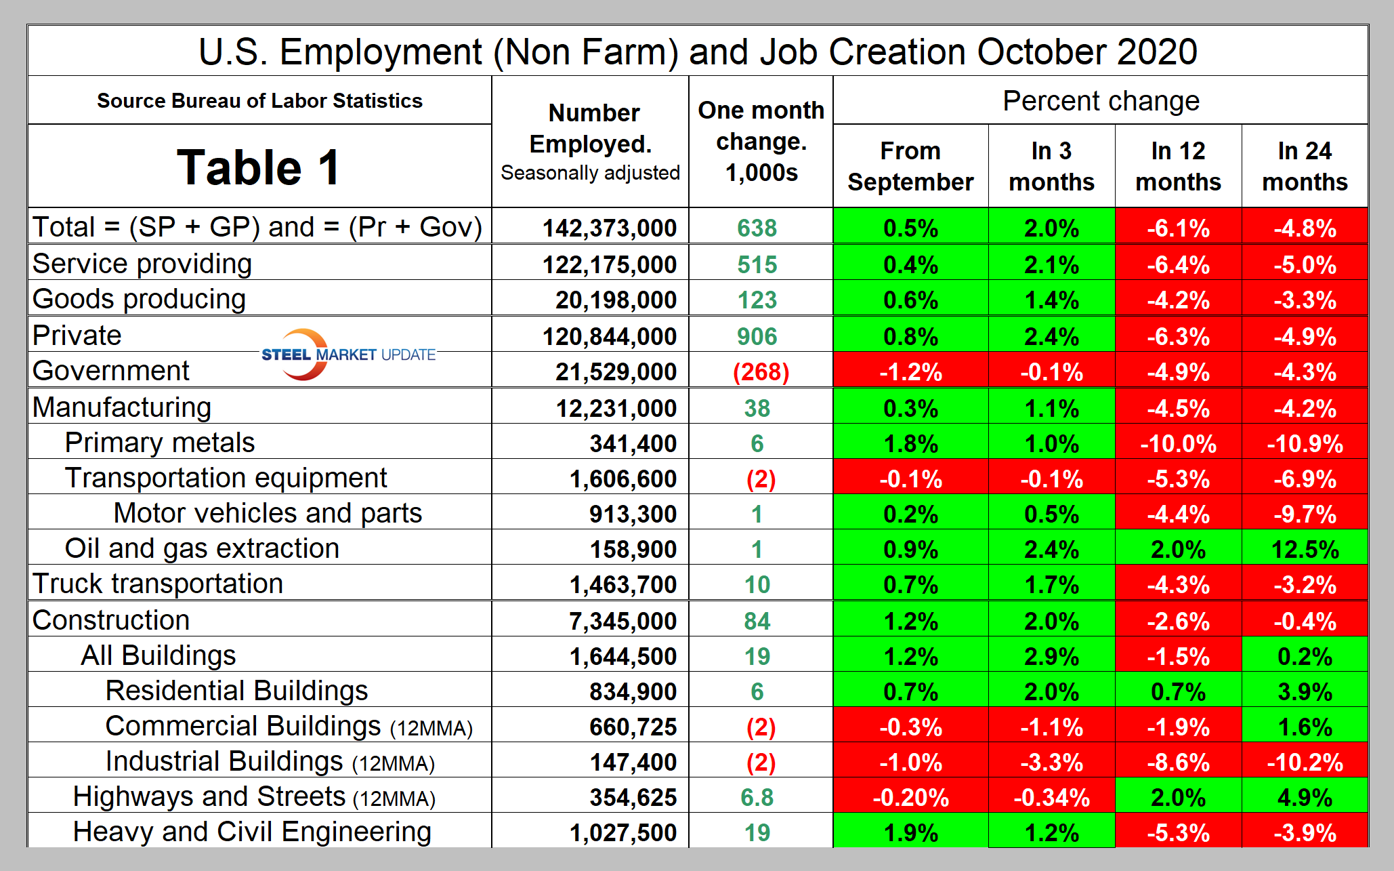
Comparing October to September, manufacturing employment was up by 0.3 percent and construction by 1.2 percent. In the year-over-year comparison, manufacturing has lost 4.5 percent and construction 2.6 percent. Stated the Bureau of Labor Statistics in its Nov. 6 report: “Construction added 84,000 jobs in October. Specialty trade contractors added jobs, both in the nonresidential (+28,000) and residential (+18,000) components. Employment also rose in heavy and civil engineering construction and in construction of buildings (+19,000 each). Construction has added 789,000 jobs in the last 6 months, but employment is down by 294,000 since February. Manufacturing employment rose by 38,000 in October, but is 621,000 lower than in February. Gains occurred in fabricated metal products (+7,000), primary metals (+6,000), and wood products (+4,000). Manufacturing added 38,000 jobs over the month with a surprising contribution from primary metals, which had its best performance since February 2019. Construction employment increased by 84,000 in October. From May 1 through Oct. 31, manufacturing employment rose by 502,000 and construction employment by 333,000.”
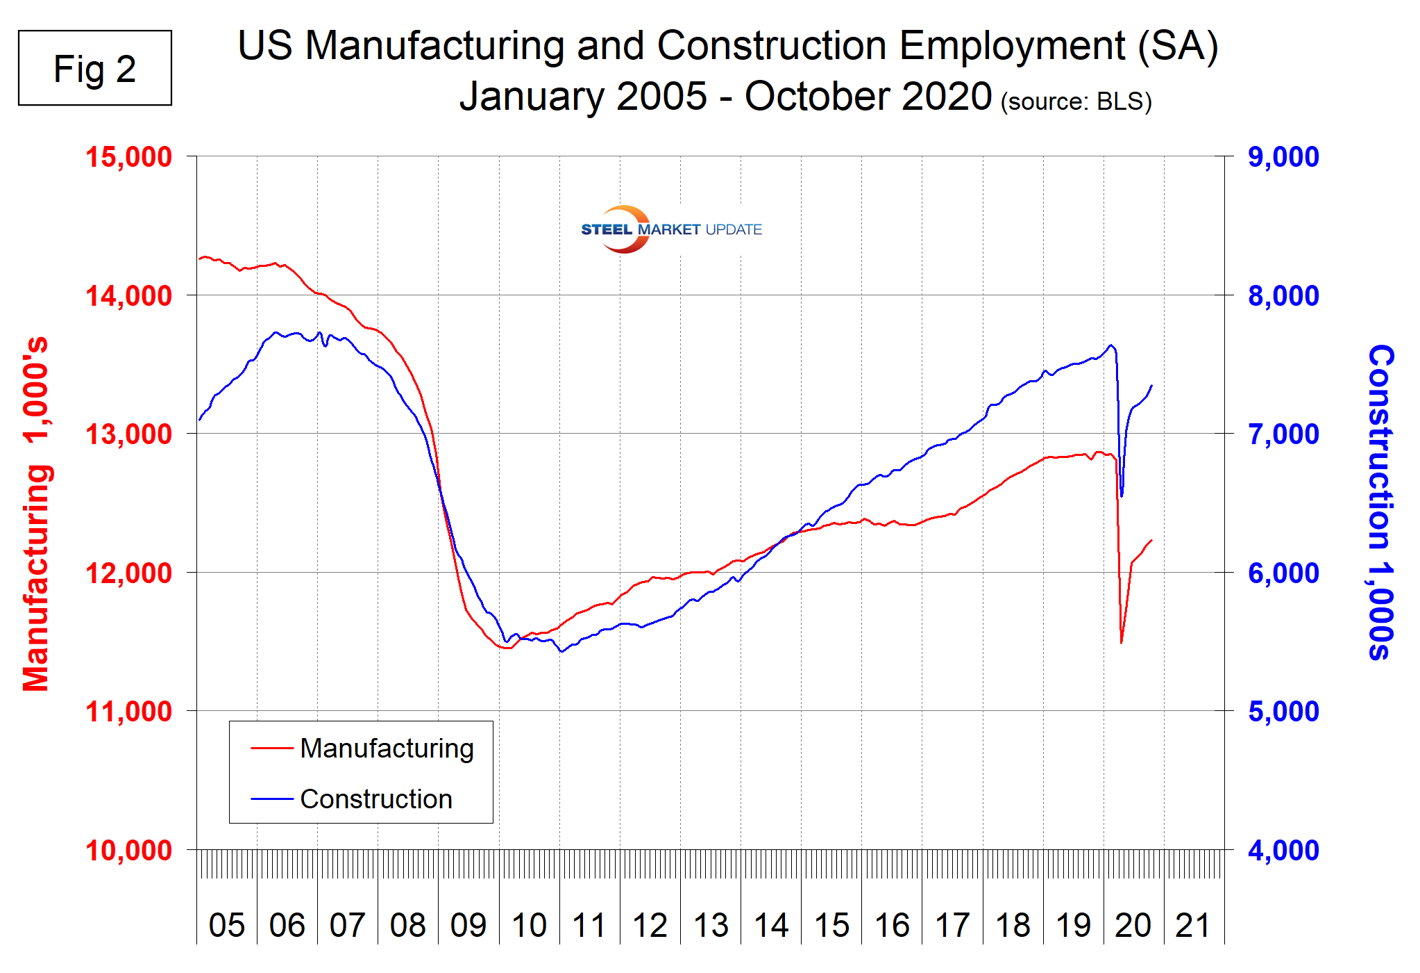
Figure 2 shows the history of employment in manufacturing and construction since January 2005.
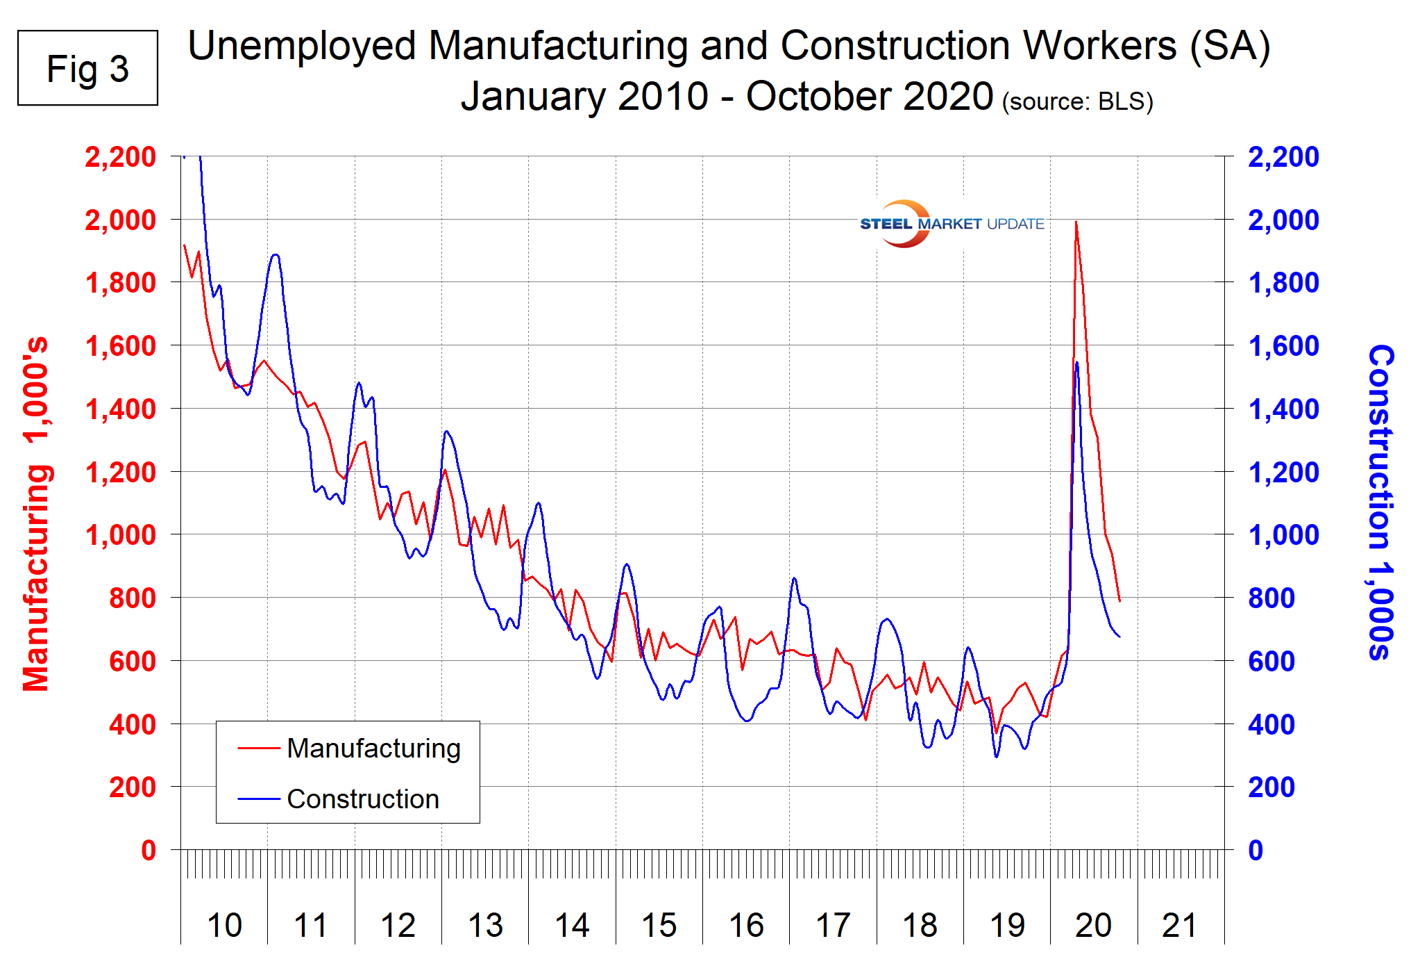
The reported number of unemployed manufacturing and construction workers is shown in Figure 3. These were 787,000 in manufacturing and 674,000 in construction at the end of October.
Goods-producing industries, which are mainly in the manufacturing and construction sectors, continued to perform better than the service sector in October. In the last 12 months, service industries have lost 6.4 percent of their employees as goods-producing industries have lost 4.2 percent. Primary metals had a good month in October, but in the last 12 months is down by more than twice as high a percentage as total manufacturing.
Explanation: On the first or second Friday of each month, the Bureau of Labor Statistics releases the employment data for the previous month. Data is available at www.bls.gov. The BLS employment database is a reality check for other economic data streams such as manufacturing and construction. It is easy to drill down into the BLS database to obtain employment data for many subsectors of the economy. The important point about all these data streams is the direction in which they are headed.


