

Market Data

September 11, 2020
Employment by Industry in September
Written by Peter Wright
The net change in employed persons in September was 661,000. Employment gains have slowed each month since June when 4.8 million jobs were recovered. The baseline against which future comparisons will be made is February 2020, the all-time high for nonfarm employment. Figure 1 shows the total number of people employed in the nonfarm economy.
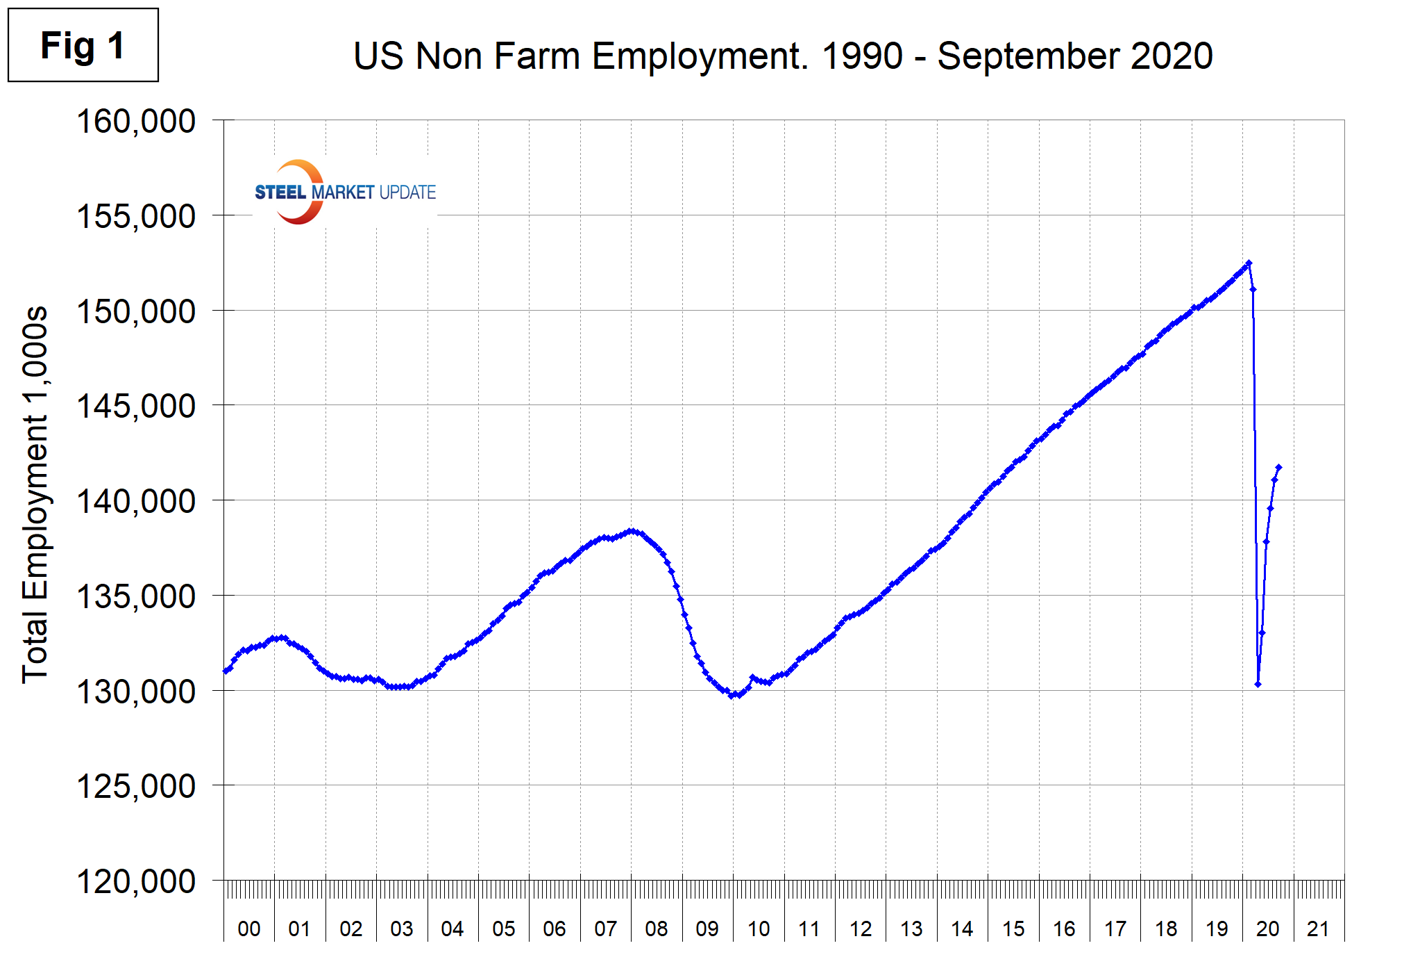
Table 1 is designed on rolling time periods: 1 month, 3 months, 1 year and 2 years. It breaks total employment into service and goods-producing industries and then into private and government employees. Most of the goods-producing employees work in manufacturing and construction and the components of these two sectors of most relevance to steel people are identified. Comparing service industries and goods-producing industries in September vs. August shows both to be up by 0.5 percent. Note, the subcomponents of both manufacturing and construction shown in Table 1 don’t add up to the total because we have only included those with the most relevance to the steel industry.
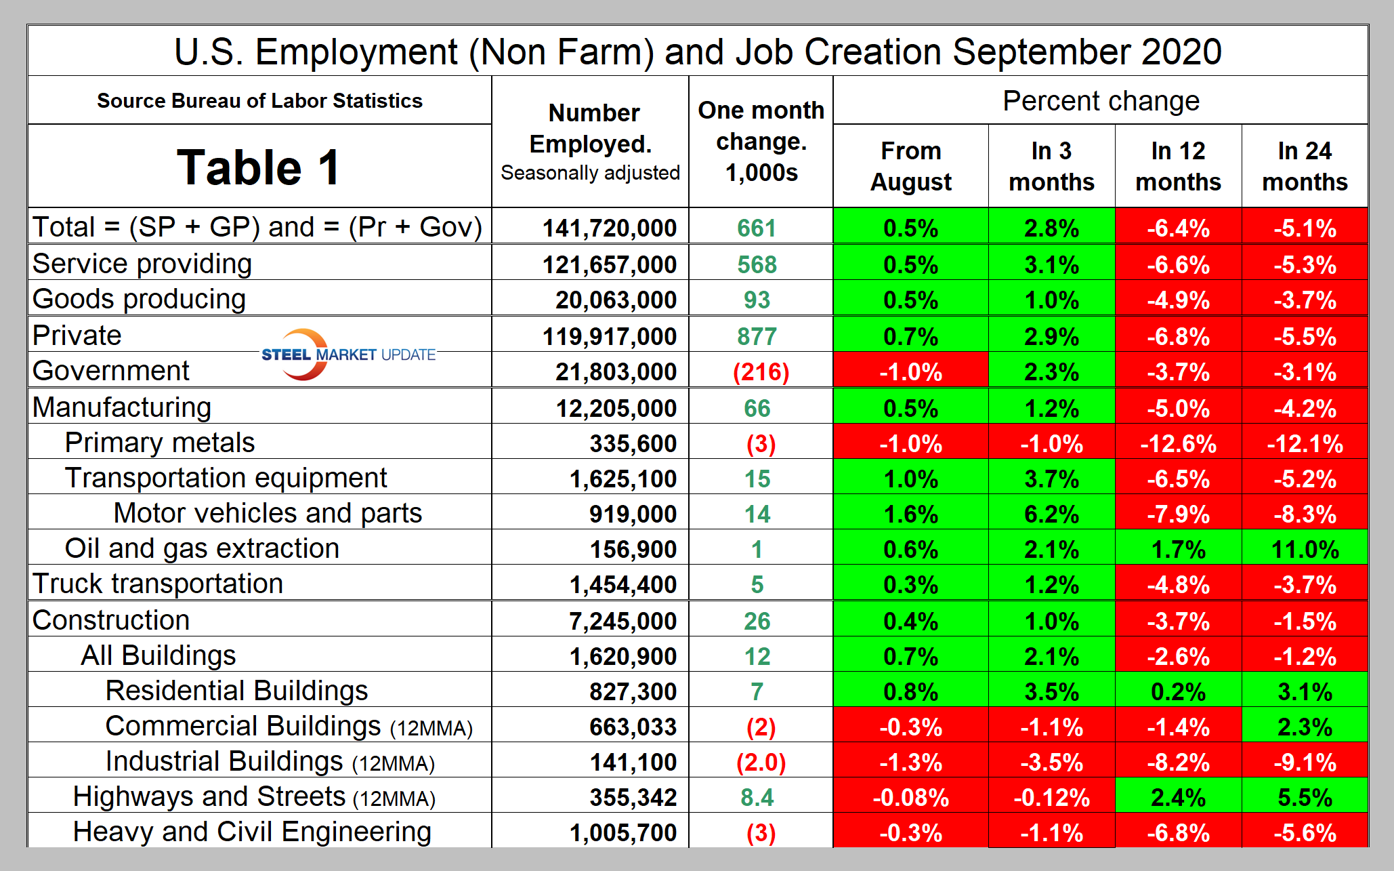
Comparing September to August, manufacturing was up by 0.5 percent and construction was up by 0.4 percent. In the year-over-year comparison, manufacturing has lost 5.0 percent and construction 3.7 percent. As the Bureau of Labor Statistics (BLS) reported Oct. 2: “Manufacturing added 66,000 jobs over the month. Durable goods accounted for about two-thirds of the gain, led by motor vehicles and parts (+14,000) and machinery (+14,000). Despite gains over the past five months, employment in manufacturing is 647,000 below February’s level. Construction employment increased by 26,000 in September, with growth in residential specialty trade contractors (+16,000) and construction of buildings (+12,000). Construction employment is below its February level by 394,000.”
In May through September, manufacturing employment rose by 716,000, but is down by 647,000 since February. Employment in transportation equipment and oil and gas production rose in September, but declined in primary metals manufacture. Trucking gained 5,000 in September and has gained 24,000 jobs since April.
In May through September, construction added 689,000 jobs, but is down by 394,000 since February. In September, residential buildings gained 7,000 positions and highway construction gained 8,400 positions. Commercial construction, industrial buildings and heavy civil engineering declined.
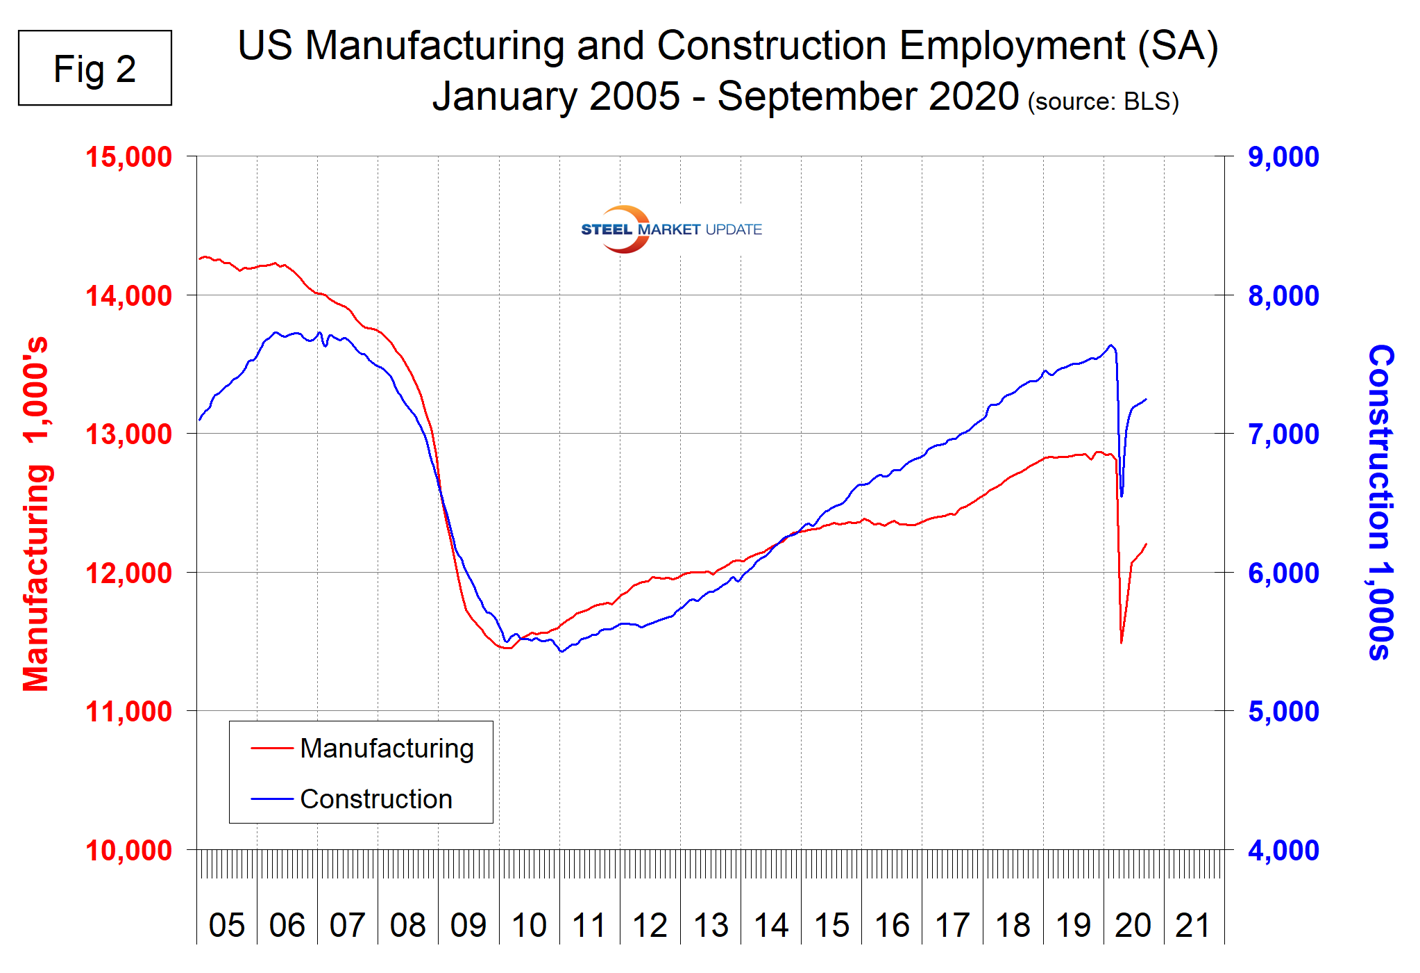
Figure 2 shows the history of employment in manufacturing and construction since January 2005.
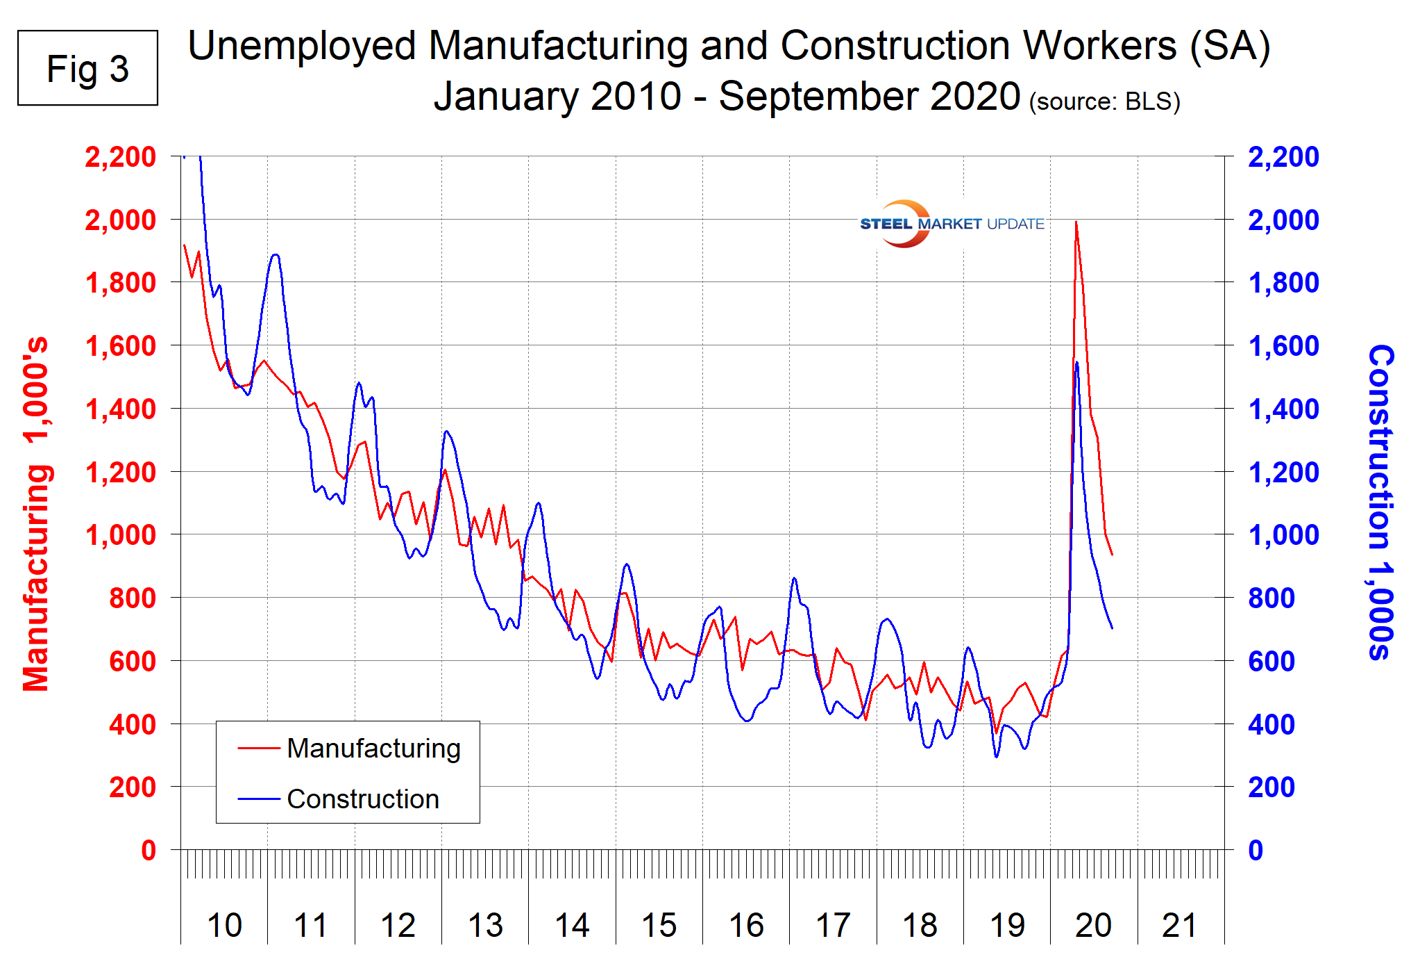
The reported number of unemployed manufacturing and construction workers is shown in Figure 3. These totaled 935,000 and 700,000, respectively, at the end of September.
SMU Comment: Year over year in September, manufacturing and construction employment were down by 5.0 percent and 3.7 percent, respectively. These sectors encompass most of the steel consumed in the U.S. Residential construction is still healthy and is propping up the overall construction sector, but doesn’t consume much steel compared to nonresidential and infrastructure. Primary metals has performed much worse than overall manufacturing in all four time periods considered in Table 1.
Explanation: On the first or second Friday of each month, the Bureau of Labor Statistics releases the employment data for the previous month. Data is available at www.bls.gov. The BLS employment database is a reality check for other economic data streams such as manufacturing and construction. It is easy to drill down into the BLS database to obtain employment data for many subsectors of the economy. The important point about all these data streams is the direction in which they are headed.


