Analysis

September 11, 2020
North American Auto Assemblies Continued to Recover
Written by Peter Wright
Auto assemblies in North America have recovered rapidly since April. This report is based on data from LMC Automotive for automotive assemblies in the U.S., Canada and Mexico. The breakdown of assemblies is “Personal” (cars for personal use) and “Commercial” (light vehicles less than 6.0 metric tons gross vehicle weight rating. Heavy trucks and buses are not included). In this report we will briefly describe light vehicle sales in the U.S. before reporting in detail on assemblies in the three regions of North America.
U.S. Vehicle Sales
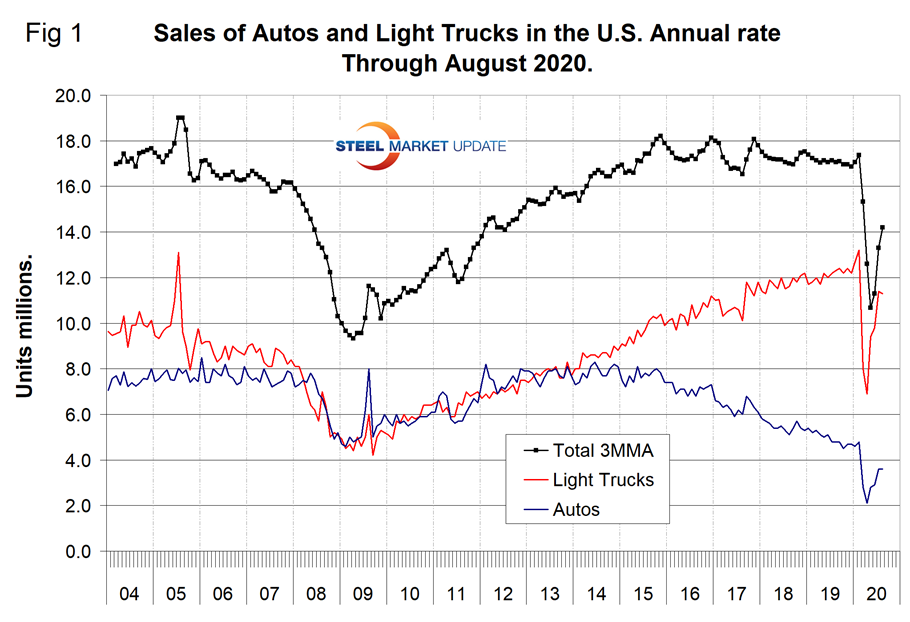
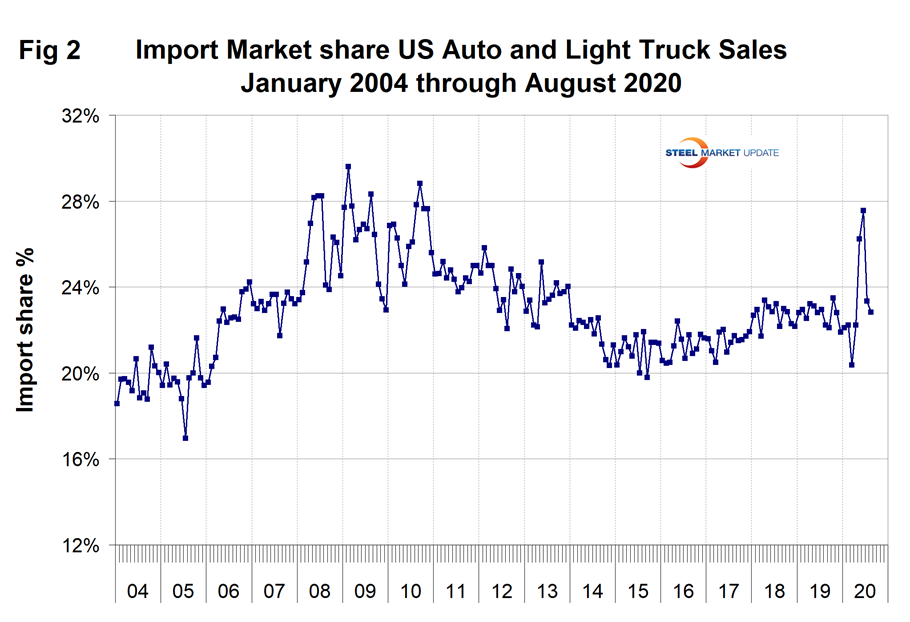
Figure 1 shows auto and light truck sales since January 2004. In August 2020, total sales were down by 16.8 percent on a three-month moving average (3MMA) basis year over year. June, July and August each improved from the previous month and from the 37.7 percent decline experienced in May. In the single month of August, sales of autos held steady at 3.6 million units as light trucks declined slightly from 11.4 to 11.3 million units. Autos were down by 60.7 percent and light trucks that include pickups, SUVs and crossovers were down by 57.5 percent, both month over month. In June, the mix was 75.8 percent light trucks and 24.2 percent autos. Import market share spiked to 27.6 percent in June before falling back to a recent normal of 22.8 percent in August (Figure 2).
North American Assemblies
The latest data available for assemblies is June when total light vehicle (LV) production in North America dipped to an annual rate of 12.6 million units. In April, the auto industry virtually shut down and produced only 7,800 vehicles in the whole of North America. Auto workers went back to work in late May and in June production was only 11.3 percent below June 2019. Note that production numbers are not seasonally adjusted; the sales data reported above are seasonally adjusted.
Figure 3 shows the production in North America on a rolling 12-month basis as the blue line and the year-over-year growth as the brown bars.
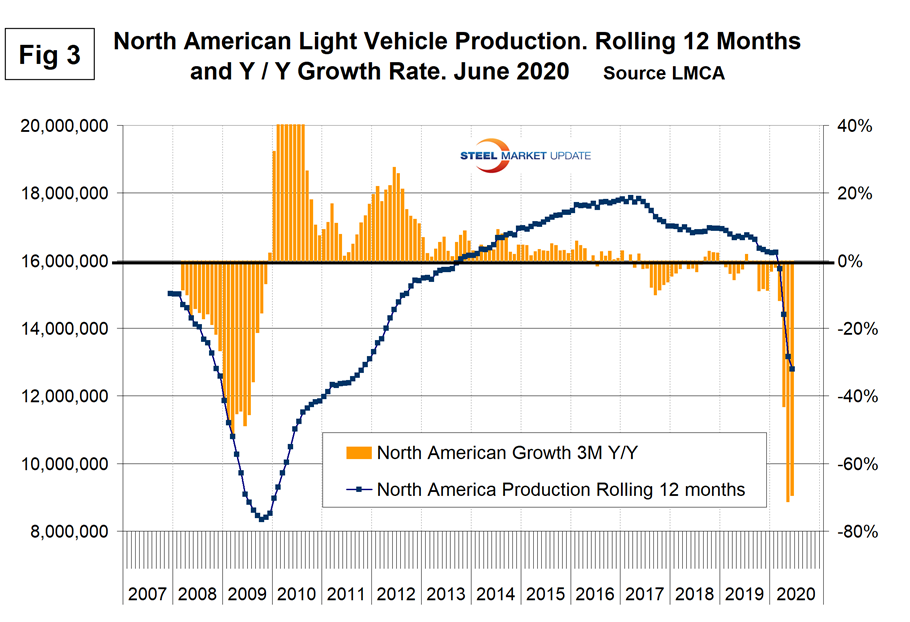
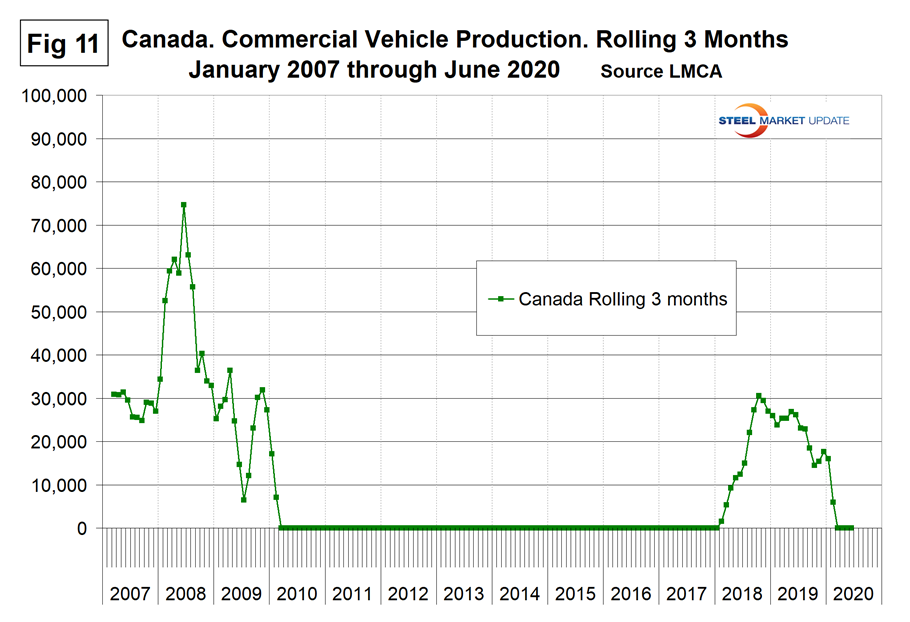
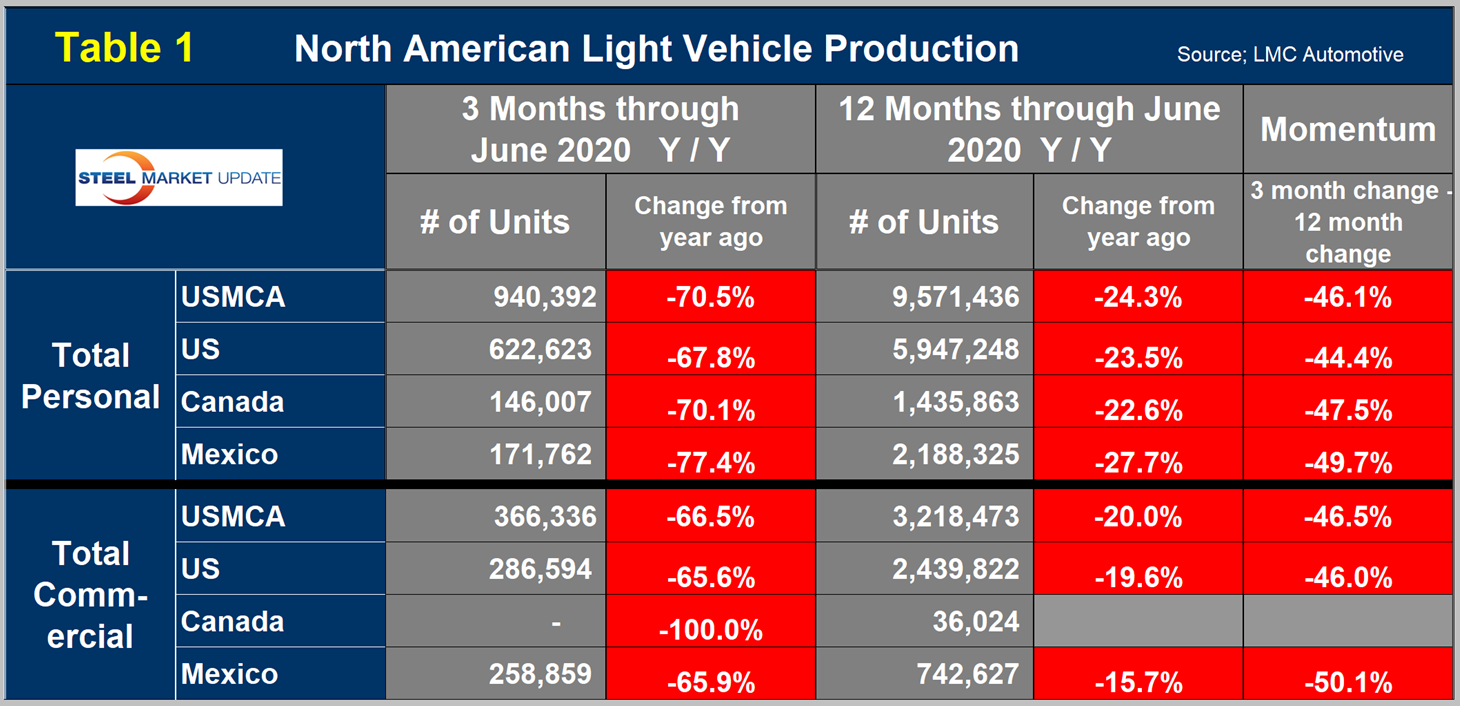
Table 1 is a short-term snapshot of assembly by nation and vehicle type. It breaks down total North American personal and commercial vehicle production into the U.S, Canadian and Mexican components and the three- and 12-month growth rate for each. At the far right it shows the momentum for the total and for each of the three nations. In three months through June, total personal vehicle assemblies in the USMCA were down by 70.5 percent year over year, while commercial light vehicles were down by 66.5 percent. There has been zero commercial vehicle production in Canada this year.
The longer-term picture is shown in the following charts by vehicle type and nation. Figure 4 shows the total personal vehicle production for North America and the total for each nation.
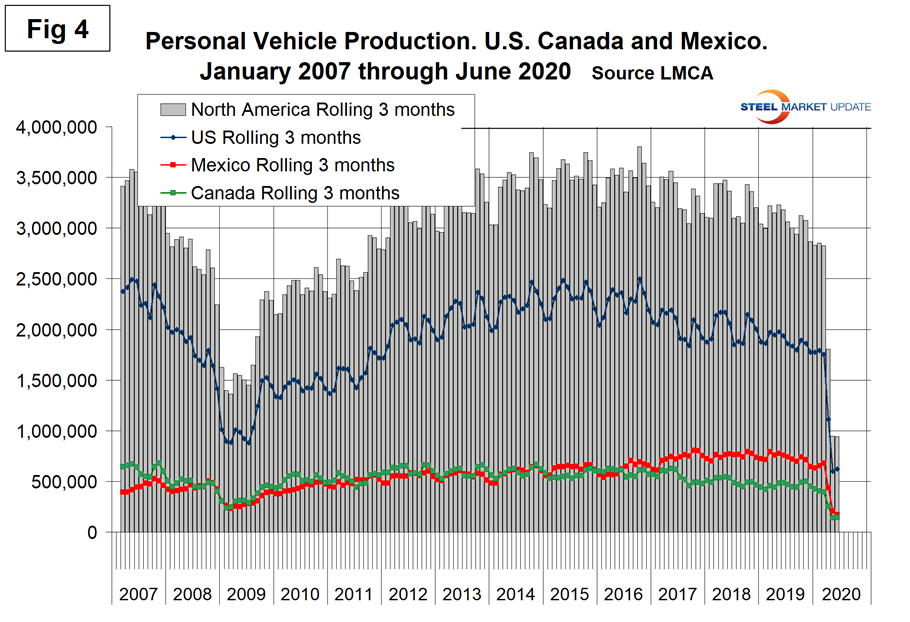
Figures 5, 6 and 7 show the production of personal vehicles by nation and the year-over-year growth rate for each. Figure 8 shows the production share for each nation. The U.S. share increased in two months from 61.6 percent in April to 66.2 percent in June. On the same basis, Canada’s share increased from 14.1 percent to 15.5 percent, while Mexico declined from 24.3 percent to 18.3 percent.
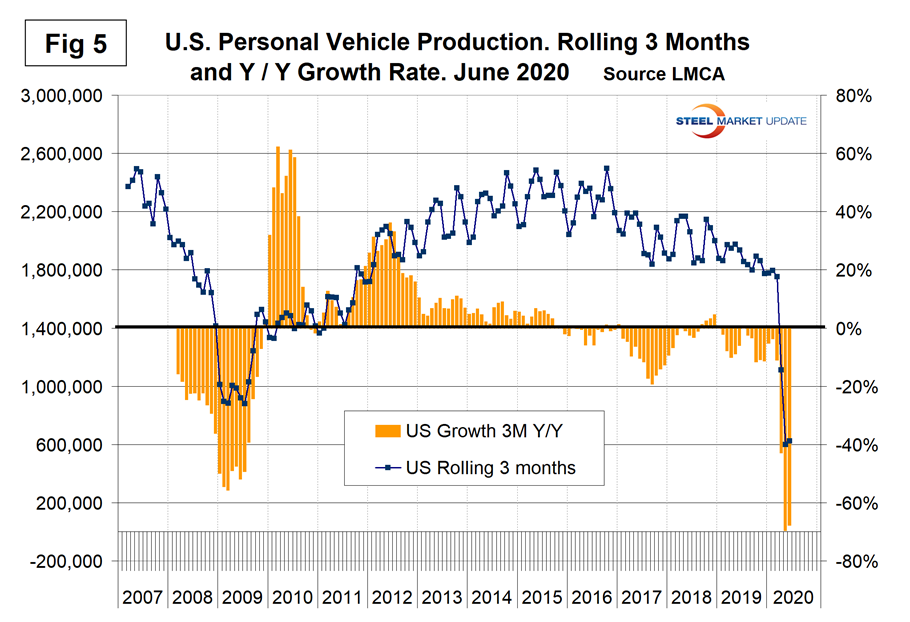
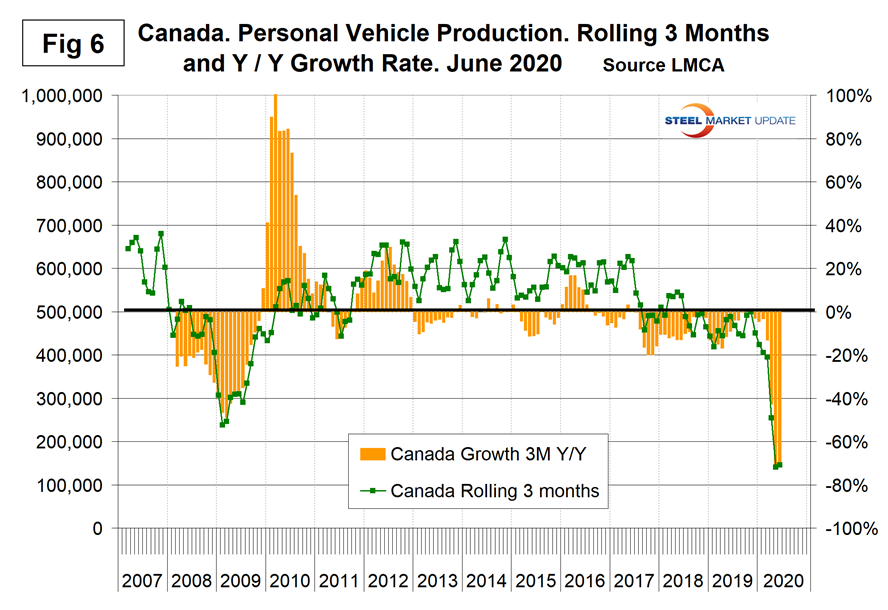
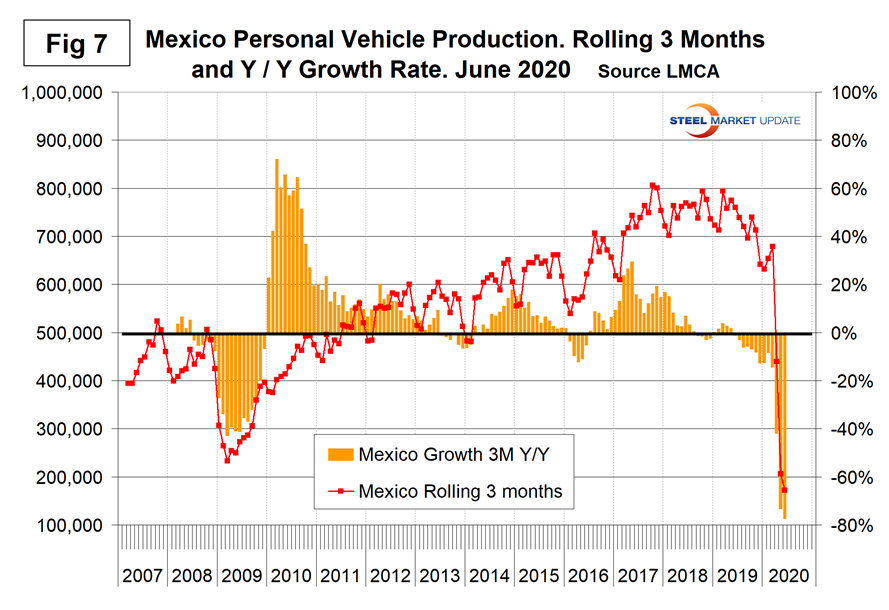
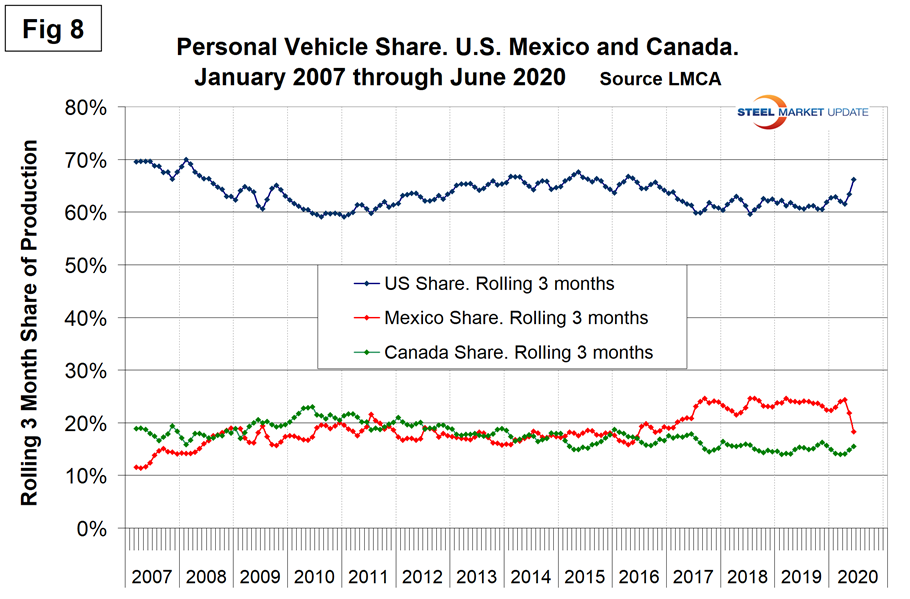
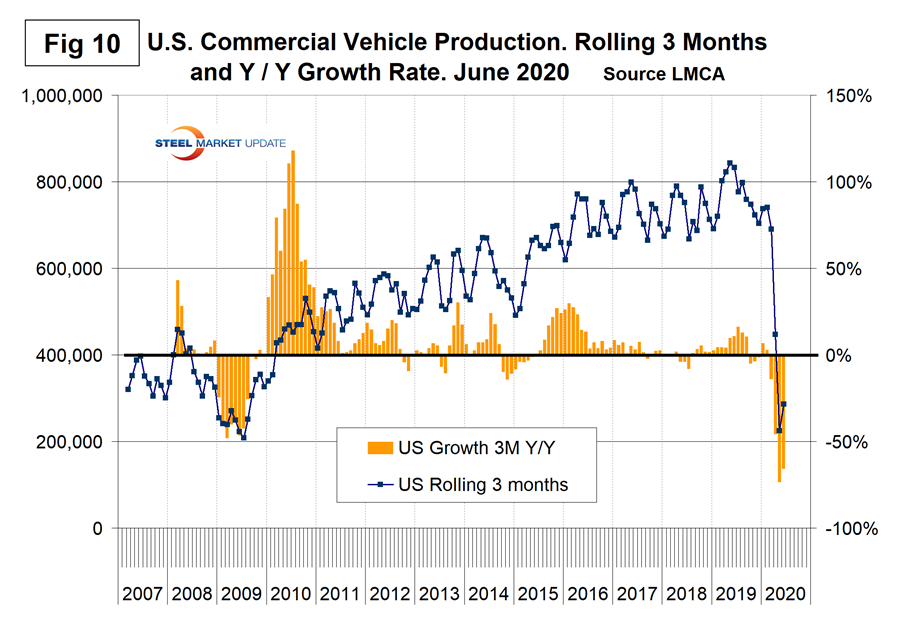
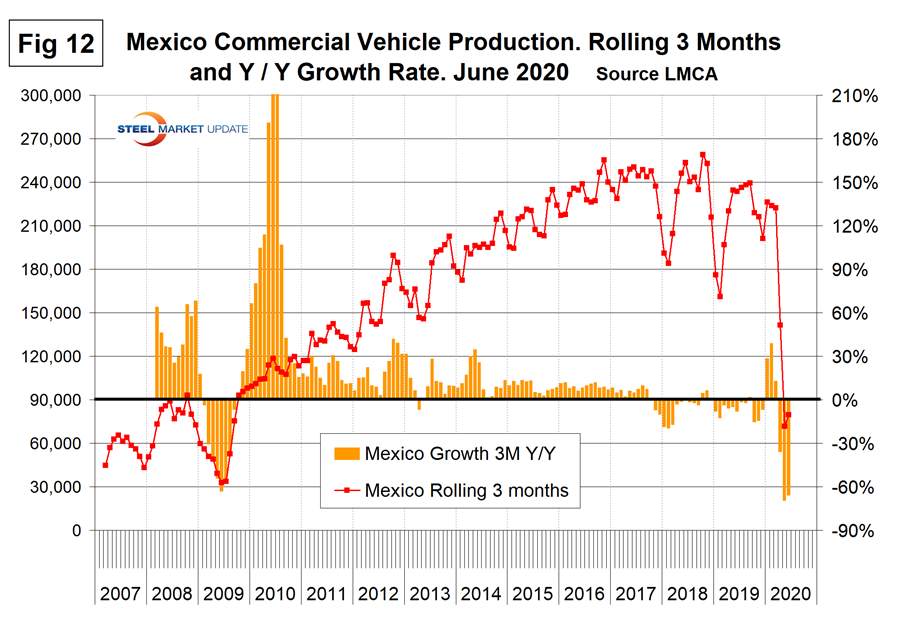
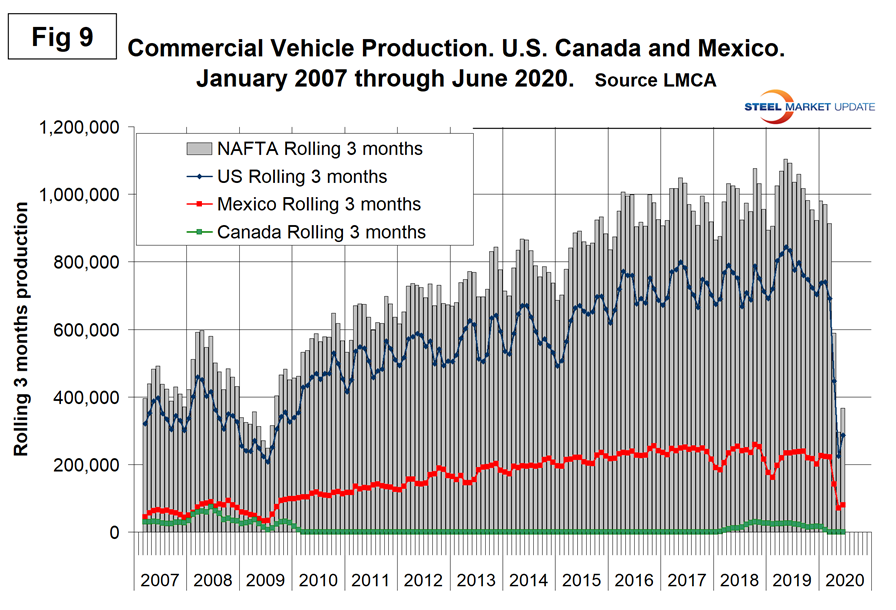
Figure 9 shows the total commercial vehicle production for North America and the total for each nation.
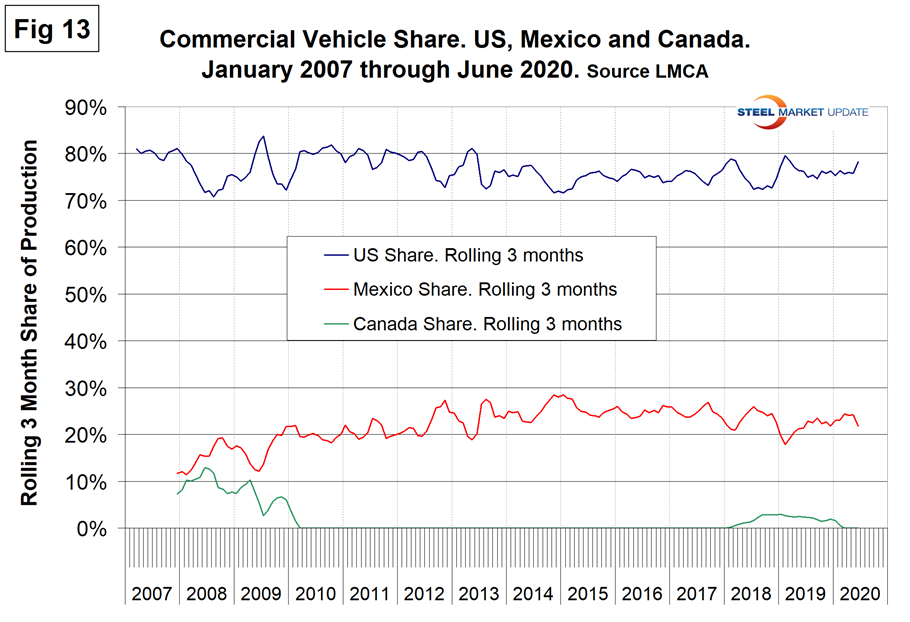
Figures 10, 11 and 12 show the production of commercial vehicles by nation and the year-over-year growth rate for each, and Figure 13 shows the production share for each nation. The U.S. share has increased from 75.6 percent in March to 78.2 percent in June. Mexico’s share has declined from 24.4 percent to 21.8 percent in the same period.
Mexico currently exports about 80 percent of its light vehicle production. The U.S and Canada are the highest volume destinations for Mexican exports.