

Market Data

December 7, 2020
Employment by Industry in November
Written by Peter Wright
Employment gains have slowed each month since June, with a disappointing result in November, according to Steel Market Update’s latest analysis of Bureau of Labor Statistics data.
The net change in employed persons in November was 245,000. Employment gains have slowed each month since June when 4.8 million jobs were recovered. The base line against which future comparisons will be made is February 2020, the all-time high for nonfarm employment. Figure 1 shows the total number of people employed in the nonfarm economy.
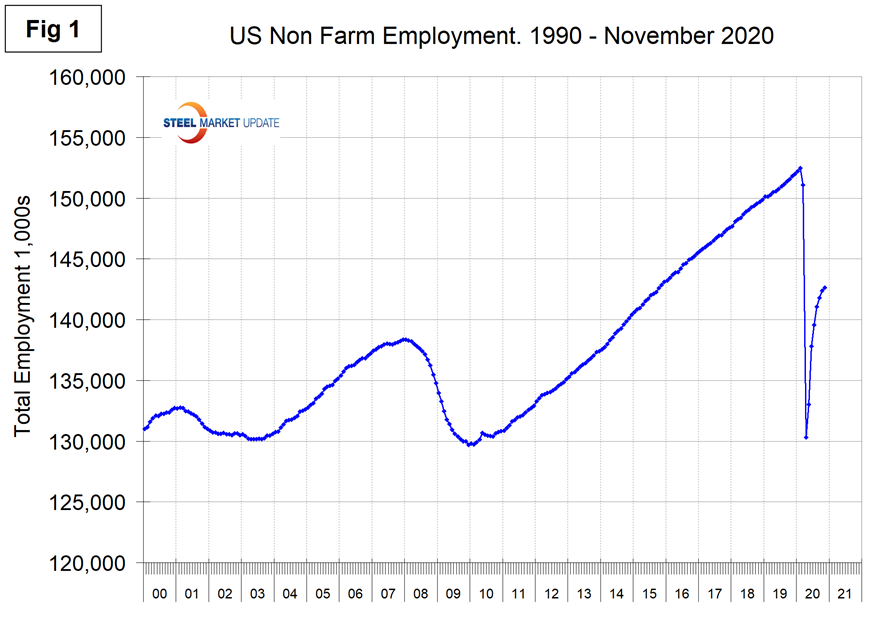
Table 1 is designed on rolling time periods, 1 month, 3 months, 1 year and 2 years. It breaks total employment into service and goods-producing industries and then into private and government employees. Most of the goods-producing employees work in manufacturing and construction and the components of these two sectors of most relevance to steel people are identified. Comparing service industries and goods-producing in November shows service jobs to have risen by 0.2 percent and goods-producing by 0.3 percent from October’s result. Goods-producing has outperformed services in each of the four time periods shown in Table 1 on a percentage basis. Note, the subcomponents of both manufacturing and construction shown in Table 1 don’t add up to the total because we have only included those with the most relevance to the steel industry.
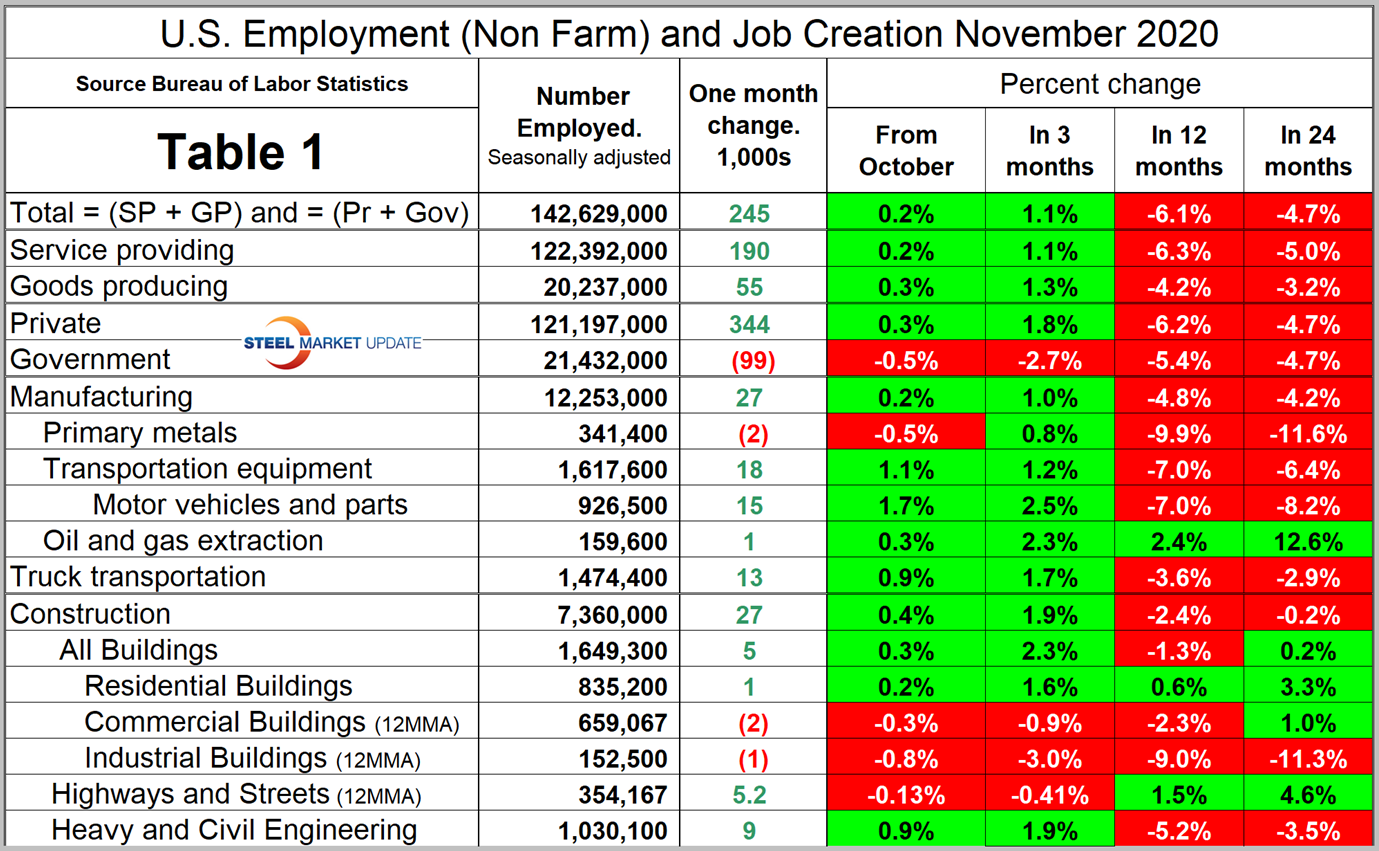
Comparing November to October, manufacturing employment was up by 0.2 percent and construction by 0.4 percent. In the year-over-year comparison, manufacturing has lost 4.8 percent and construction 2.4 percent.
“Construction gained 27,000 jobs in November; residential specialty trade contractors led the increase followed by gains in heavy and civil engineering construction,” the BLS reported Dec. 4. “In November, manufacturing employment increased by 27,000. Job gains occurred in motor vehicles and parts and in plastics and rubber products.”
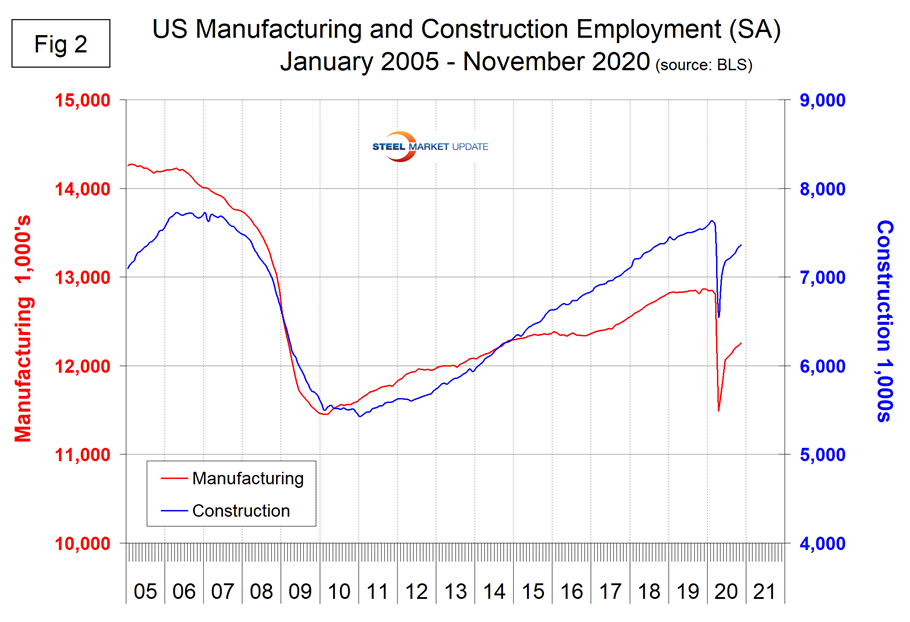
Figure 2 shows the history of employment in manufacturing and construction since January 2005.
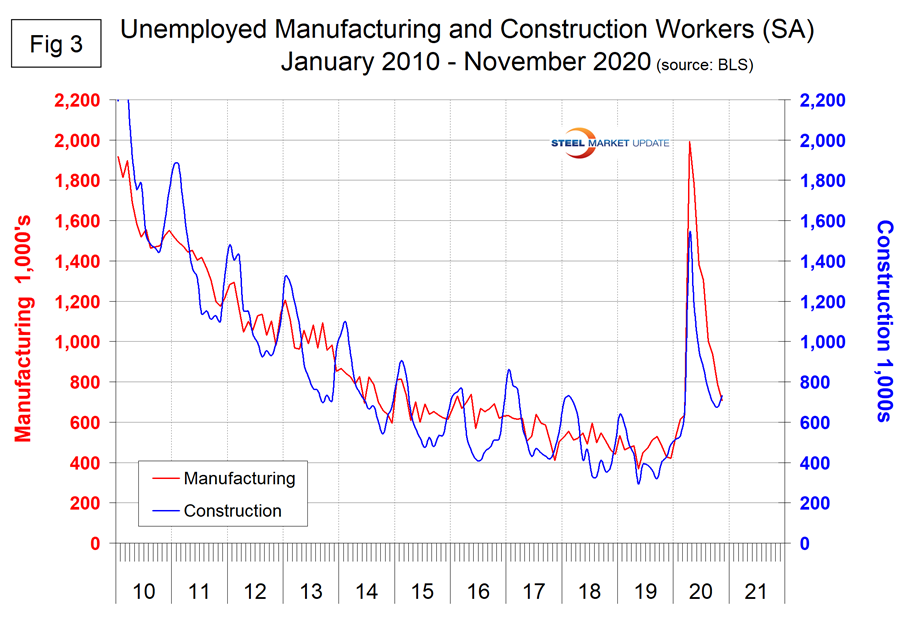
The reported number of unemployed manufacturing and construction workers is shown in Figure 3. These were 708,000 and 732,000, respectively, at the end of November.
SMU Comment: Primary metals underperformed total manufacturing in November losing 200 jobs. Transportation equipment, including motor vehicles and parts, had the best month since June. Goods-producing industries, which are mainly in the manufacturing and construction sectors, continued to perform better than the service sector in November. The pandemic is worsening and that trend is projected to accelerate through the winter months. The vaccine-driven improvement won’t affect the employment situation until early spring. The pace of economic recovery could slow this winter, with a similar effect on steel consumption.
Explanation: On the first or second Friday of each month, the Bureau of Labor Statistics releases the employment data for the previous month. Data is available at www.bls.gov. The BLS employment database is a reality check for other economic data streams such as manufacturing and construction. It is easy to drill down into the BLS database to obtain employment data for many subsectors of the economy. The important point about all these data streams is the direction in which they are headed.


