

Market Data

December 7, 2020
Employment Gains Fail to Meet Expectations in November
Written by Peter Wright
The November employment report released Friday by the Bureau of Labor Statistics showed a net gain of 245,000 jobs, a positive move but only half of economists’ consensus expectations. The gain was down from October’s 610,000 new jobs.
In the November data, September was revised up by 39,000 and October was revised down by 28,000. Of the job losses in March and April, 9,834,000 are still unemployed. Figure 1 shows the total number of nonfarm workers in the U.S. since 2000.
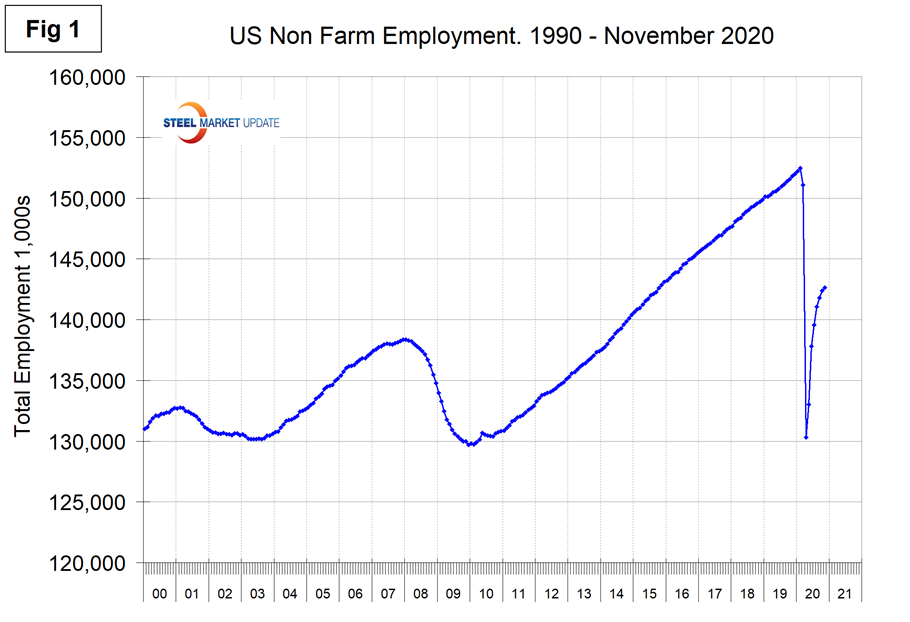
“Total nonfarm payroll employment rose by 245,000 in November, and the unemployment rate edged down to 6.7 percent,” reported the BLS on Dec. 4. “These improvements in the labor market reflect the continued resumption of economic activity that had been curtailed due to the coronavirus (COVID-19) pandemic and efforts to contain it. However, the pace of improvement in the labor market has moderated in recent months. In November, notable job gains occurred in transportation and warehousing, professional and business services, and health care. Employment declined in government and retail trade. “Construction gained 27,000 jobs in November, but building-related employment is still 279,000 below its February level. In November, employment rose among residential specialty trade contractors (+14,000) and in heavy and civil engineering construction (+10,000). “In November, manufacturing employment increased by 27,000. Job gains occurred in motor vehicles and parts (+15,000) and in plastics and rubber products (+5,000). Employmentin manufacturing was still 599,000 lower than in February,” the BLS said.
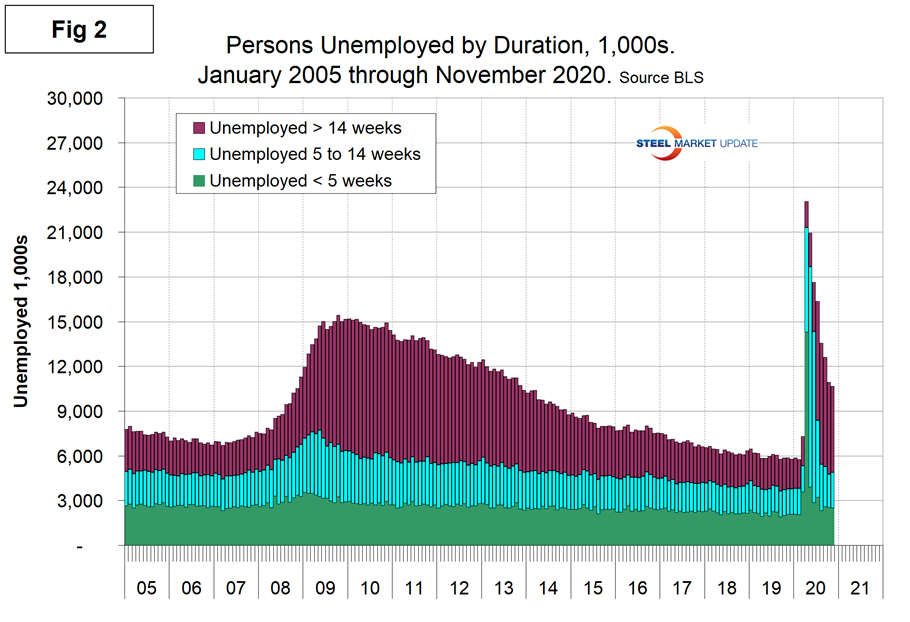
Figure 2 shows the historical picture for the duration of unemployment since January 2005 broken down into <5 weeks, 5 to 14 weeks and > 14 weeks. The total number unemployed was 10,678,000 at the end of November, down from 23,059,000 at the end of April. As of Nov. 30, 54 percent had been unemployed for more than 14 weeks, 23 percent for 5 to 14 weeks and 23 percent for less than 5 weeks. The biggest change in the month of November was in the number unemployed for more than 14 weeks, which declined by 375,000.
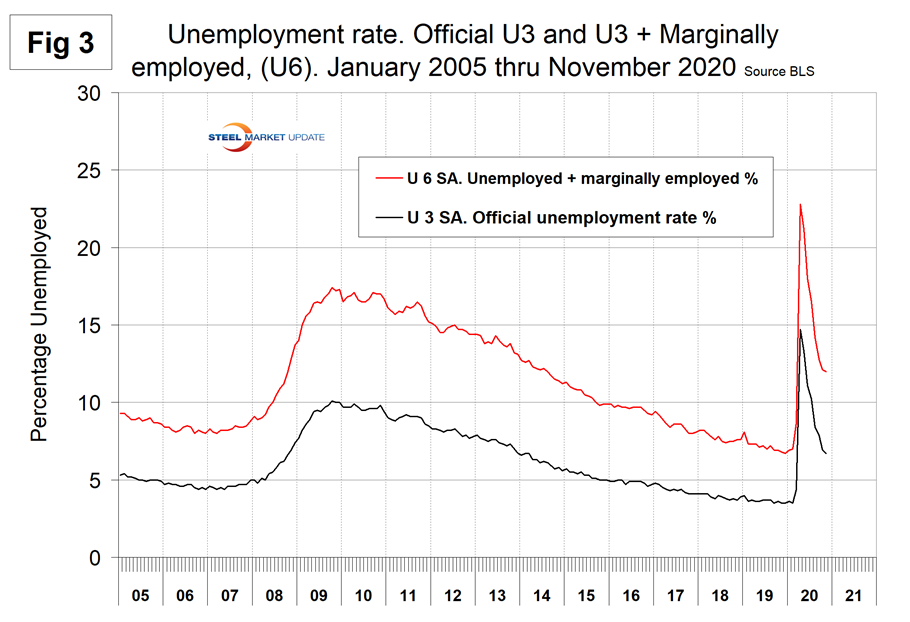
The official unemployment rate, U3, reported in the BLS Household survey (see explanation below) increased from 3.5 percent in February to 14.7 percent in April, then recovered to 6.7 percent in November. The more comprehensive U6 unemployment rate, at 12.0 percent in November, improved from 22.8 percent in April (Figure 3). U6 includes individuals working part time who desire full-time work and those who want to work but are so discouraged they have stopped looking.
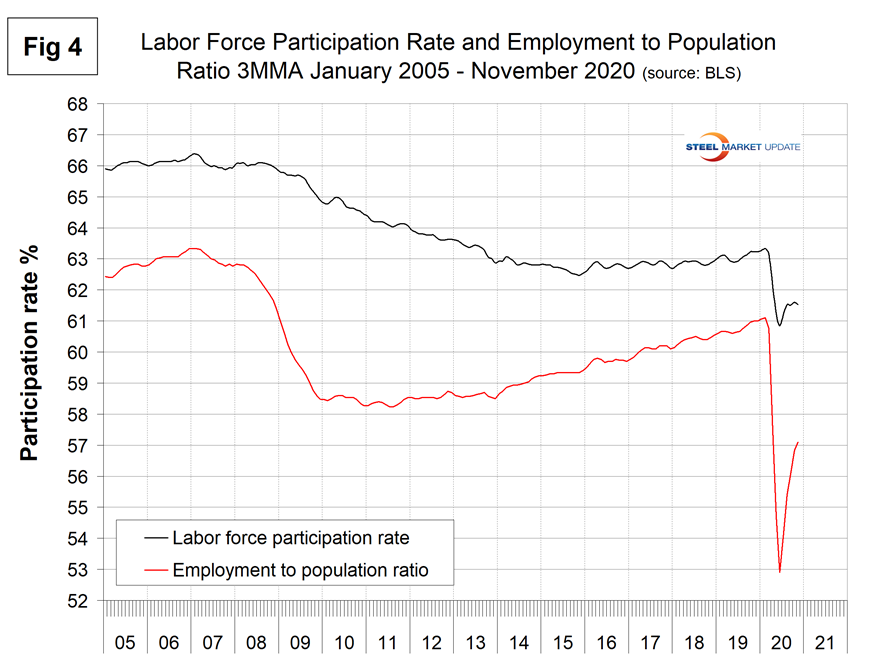
The labor force participation rate is calculated by dividing the number of people actively participating in the labor force by the total number of people eligible to participate. This measure was 61.5 percent in November, up from 60.2 percent in April but down from 63.4 percent in January and February. Another gauge is the number employed as a percentage of the population, which we think is more definitive. In November, the employment-to-population ratio was 57.3 percent, up from the low point of 51.3 percent in April. Figure 4 shows both measures on one graph.
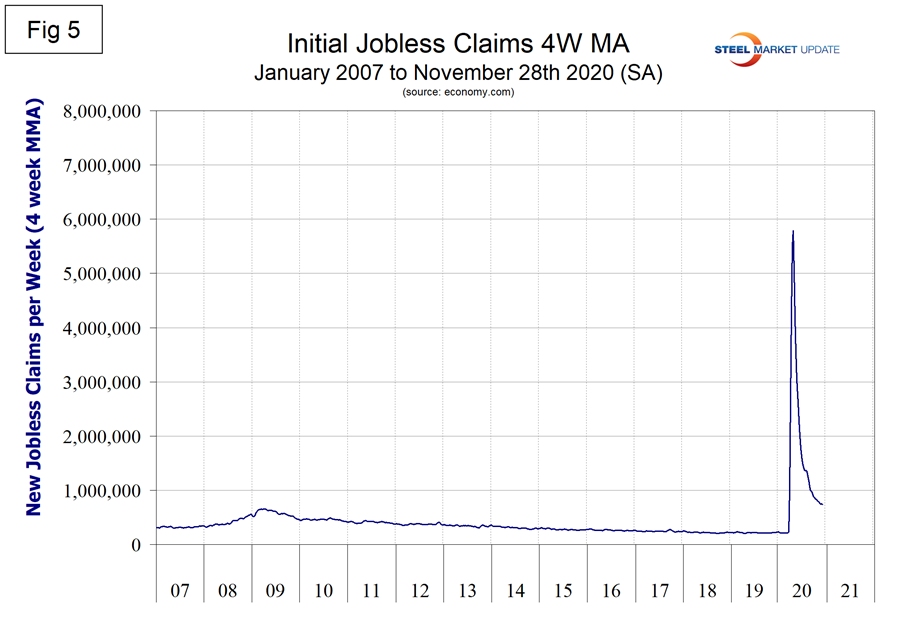
Initial claims for unemployment insurance are reported weekly by the Department of Labor. The pandemic effect began in the week ending March 21 when new claims shot up from 282,000 in the previous week to 3.3 million. The peak was 6.9 million in the week ending March 28. Since then new claims have fallen steadily to 712,000 in the week ending Nov. 28. New filings are still higher than they were at the peak of the Great Recession. Figure 5 shows the four-week moving average of new claims since January 2007.
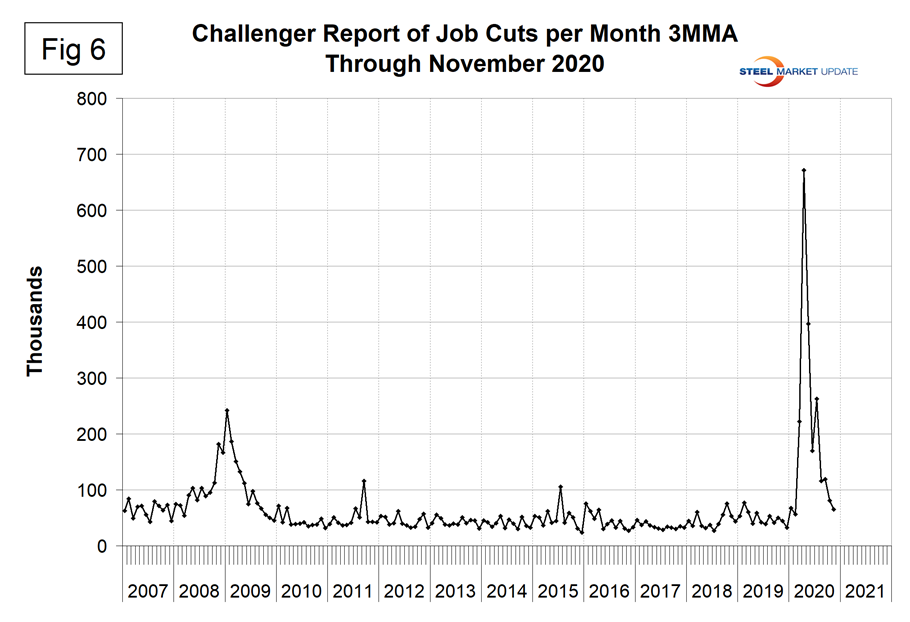
Challenger, Gray and Christmas, Inc., produces a monthly employment update for the U.S. and reported that job cuts in November were 64,800, down from 80,700 in October. The three-month moving average (3MMA) has declined in each of the last six months.
“In November, U.S.-based employers announced 64,797 job cuts, the second-lowest monthly total for 2020. It is 19.7% lower than the 80,666 job cuts announced in October,” Challenger reported. “The majority of cuts last month came from Entertainment/Leisure companies, which announced 11,666 cuts. This sector leads all industries this year with 857,620, up 5,860% from the 14,389 announced in the same period last year. Technology companies followed with 11,431 cuts, bringing the year-to-date total to 77,826, 22.7% more than the 63,447 cuts announced in the sector last year. Transportation companies announced the third-highest total for the month with 10,455 cuts, for a total of 170,129 cuts in the first 11 months of 2020. This is a 543% increase from the 26,445 announced in the same period last year. The only industries that have announced fewer job cuts than during the same period last year are Chemical, Financial, Pharmaceutical and Utility. Market conditions were cited as the reason for 20,021 cuts in November, the highest number for any reason. Demand downturn followed with 17,659. Restructuring resulted in 11,676 cuts. COVID impacted 5,873 jobs in November, but leads all reasons in 2020 with 1,105,599,” Challenger said.
Figure 6 shows the monthly job cuts reported by Challenger on a 3MMA basis since January 2007.
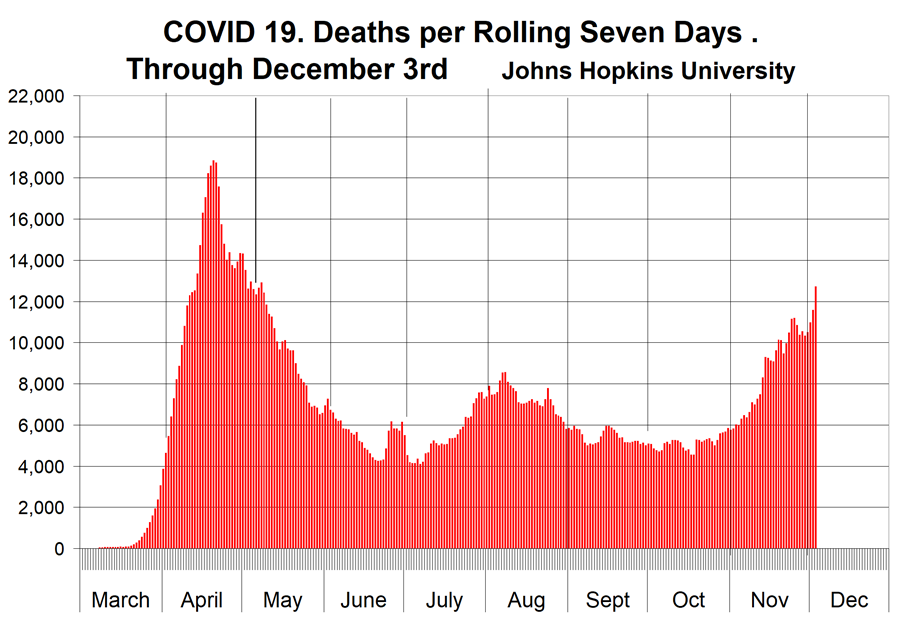
SMU Comment: February 2020 was the all-time high for nonfarm employment in the U.S. Since then the pandemic has wreaked havoc in the job market, and we are now experiencing a third wave of deaths. This is resulting in more draconian restrictions in public activities, which will result in deterioration in the employment statistics. Employment drives consumer spending, GDP and ultimately steel demand. Figure 7 shows the rolling seven-day death count attributed to COVID-19 and reported by the Johns Hopkins Center for Systems Science and Engineering. There has been a steady increase in deaths since mid-October and on Dec. 3 the rolling seven-day death count exceeded 12,000 for the first time since May 9.
Explanation: On the first Friday of each month, the Bureau of Labor Statistics releases the employment data for the previous month. Data is available at www.bls.gov. The BLS reports on the results of two surveys. The Establishment survey reports the actual number employed by industry. The Household survey reports on the unemployment rate, participation rate, earnings, average workweek, the breakout into full-time and part-time workers and lots more details describing the age breakdown of the unemployed, reasons for and duration of unemployment. It’s important to understand that none of these numbers is an actual count of everyone employed across the country. No one keeps comprehensive records, and they’re certainly not processed centrally on a monthly basis. All the reported numbers are based on samples of the population.
At Steel Market Update, we track the job creation numbers by many different categories. The BLS database is a reality check for other economic data streams such as manufacturing and construction. We include the net job creation figures for those two sectors in our “Key Indicators” report. It is easy to drill down into the BLS database to obtain employment data for many subsectors of the economy. For example, among hundreds of sub-indexes are truck transportation, auto production and primary metals production. The important point about all these data streams is the direction in which they are headed. Whenever possible, we try to track three separate data sources for a given steel-related sector of the economy. We believe this gives a reasonable picture of market direction. The BLS data is one of the most important sources of fine-grained economic data that we use in our analyses. The states also collect their own employment numbers independently of the BLS. The compiled state data compares well with the federal data. Every three months, SMU examines the state data and provides a regional report, which indicates strength or weakness on a geographic basis. Reports by individual state can be produced on request.


