

Prices

April 26, 2022
Steel Imports Bounce Back in March, Slip Again in April
Written by Brett Linton
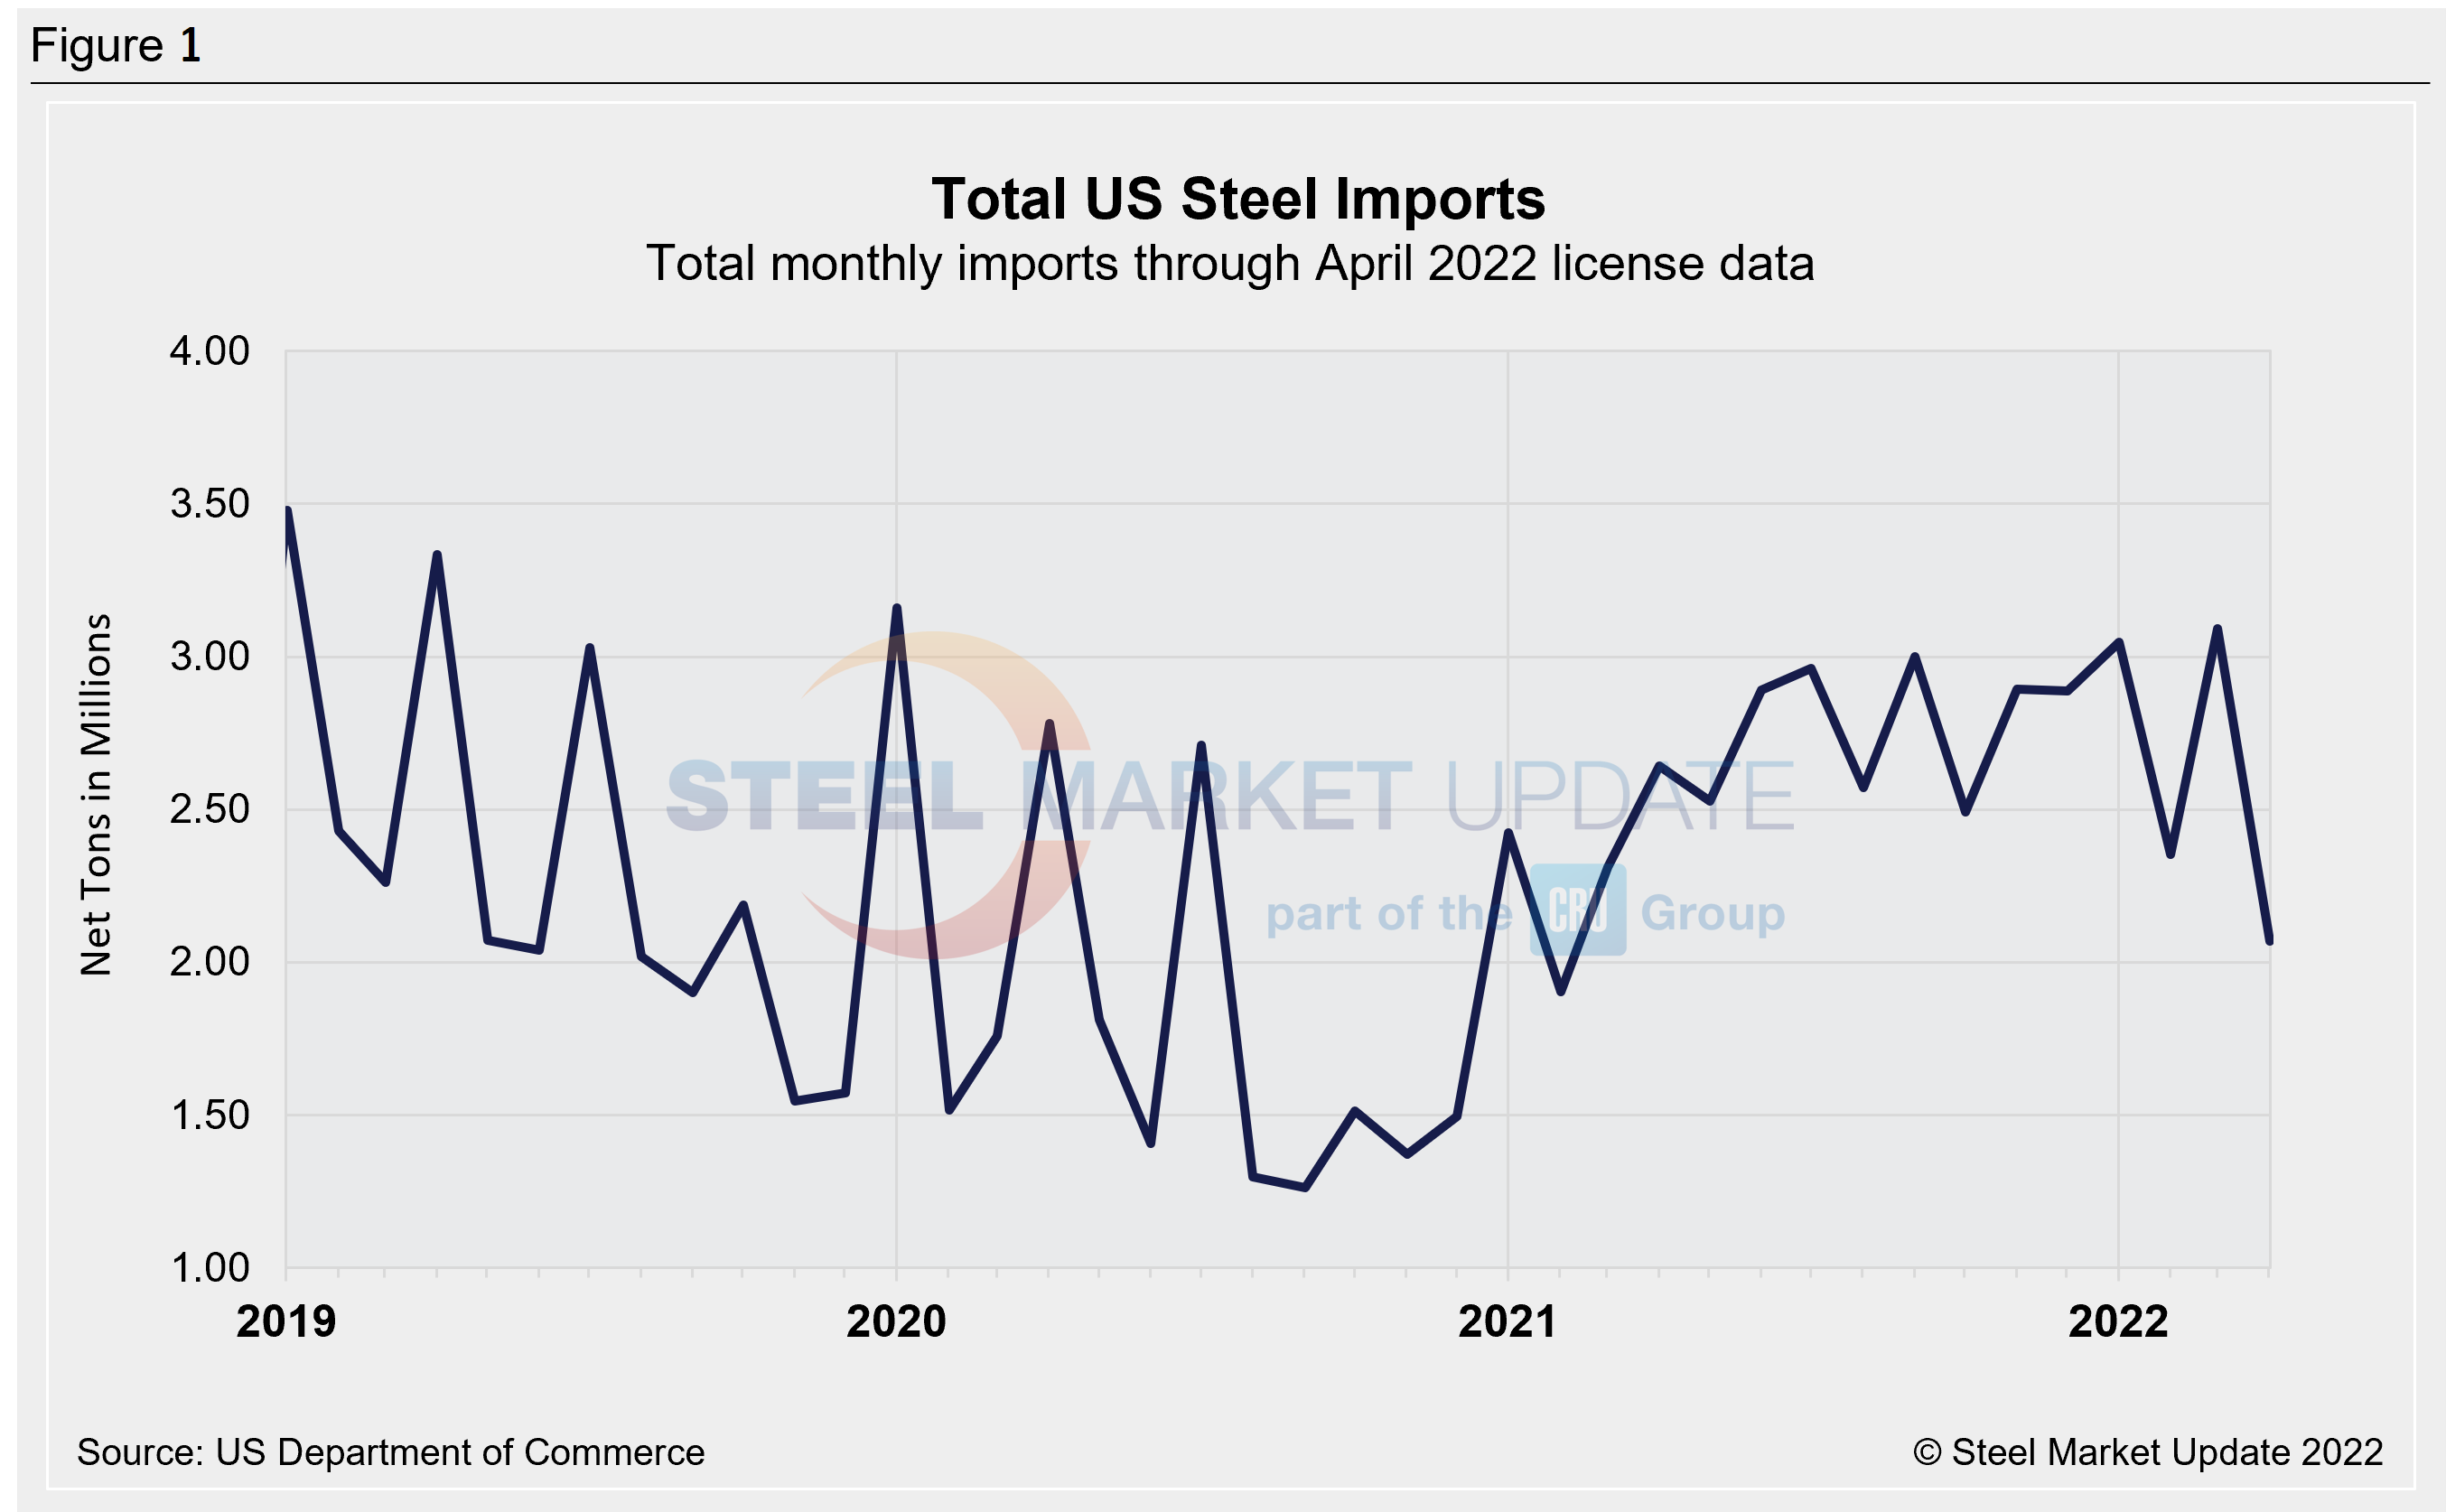
Preliminary Census data shows that steel imports in March increased 31% month-over-month to 3.09 million net tons, rising from an 11-month low to a 2+ year high. April import licenses through April 24 are currently at 2.07 million tons, down 33% from March and down 12% compared to February.
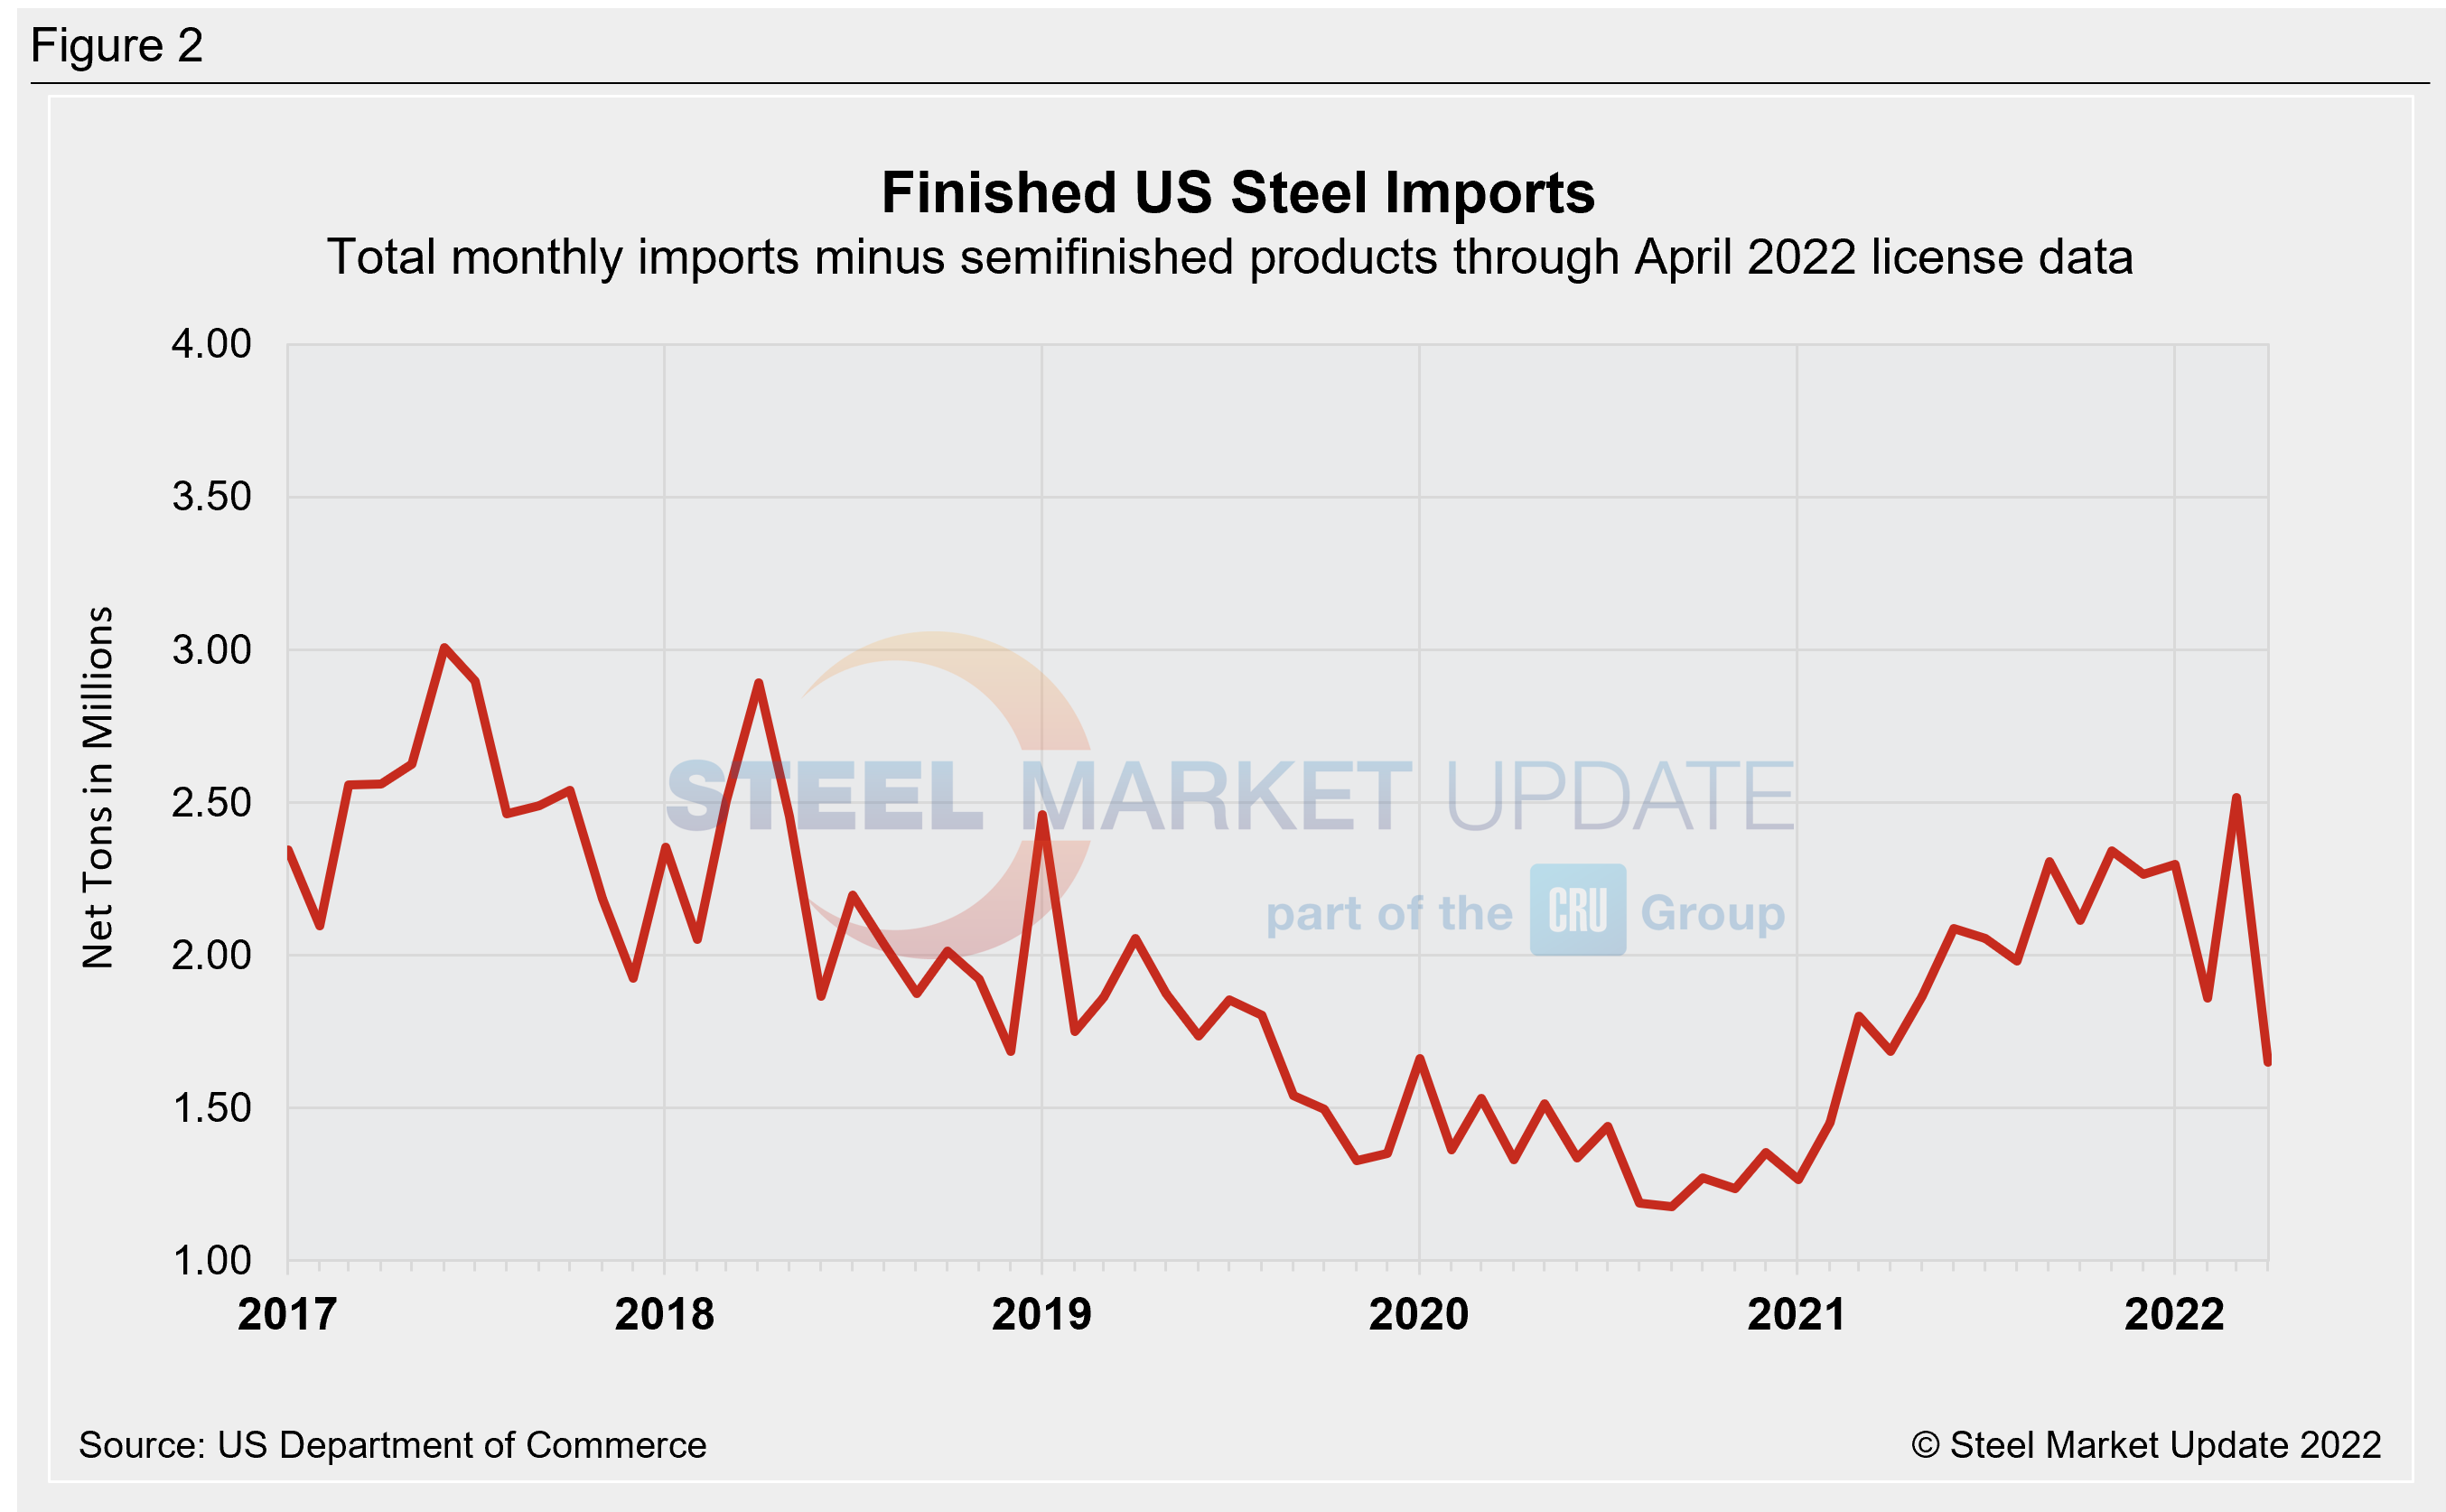
Preliminary finished steel imports were 2.52 million tons in March, up 35% from the month prior and nearing a 4-year high. The last time finished imports were this high was in April 2018 (2.90 million tons). License data shows April finished steel imports are down 34% over March to 1.65 million tons, which is 11% below February and potentially the lowest level seen since February 2021.
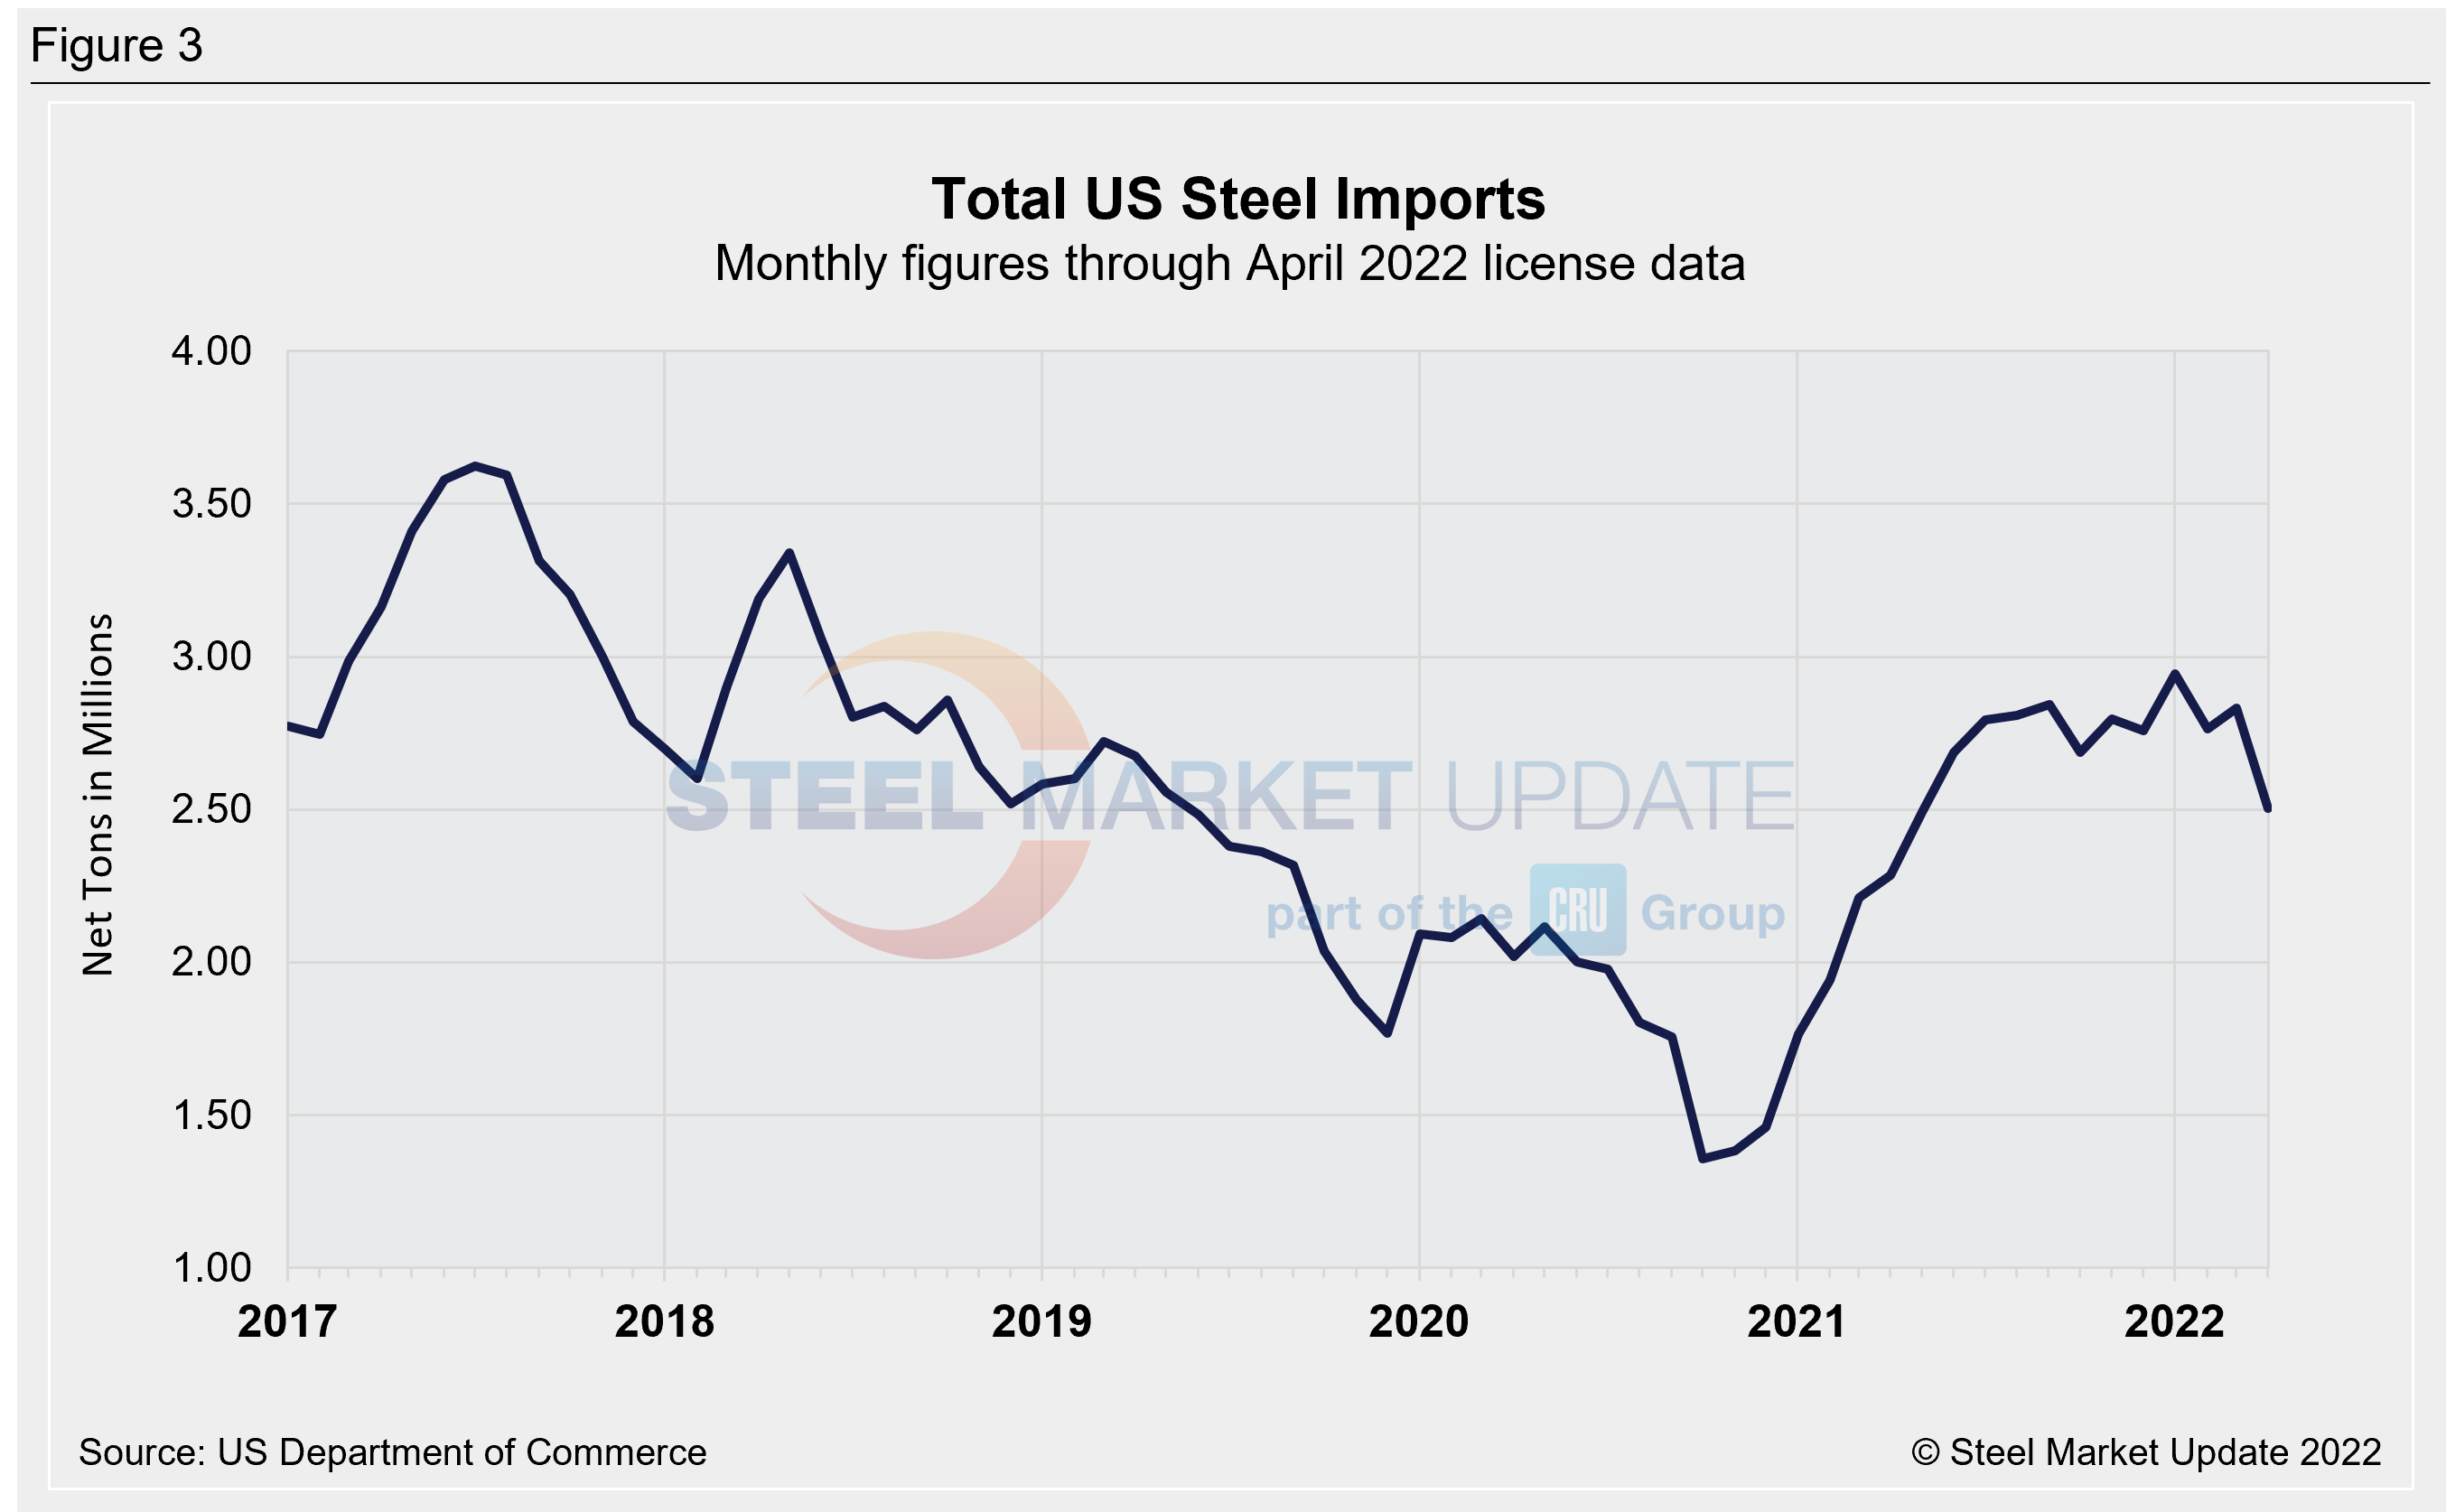
Due to large month-to-month swings in semifinished imports, the chart below shows total monthly imports on a three-month moving average (3MMA) basis in an attempt to more accurately display US steel import trends. The 3MMA through preliminary March data is 2.83 million tons, up from February but still below January’s 42-month high. Import figures remain strong historically: 2021 averaged 2.63 million tons per month, 2020 averaged 1.84 million tons per month, 2019 averaged 2.32 million tons per month. Recall that the lowest 3MMA level in SMU’s recent history was October 2020, at 1.36 million tons. The latest April license data indicates that the 3MMA is down to 2.50 million tons.
The table below displays flat rolled product imports as well as other high-volume products, including rebar, tin plate, wire rod, structural pipe and tube, and other long products. We also provide data on imports divided into semifinished, finished, flat rolled, longs, pipe and tube, and stainless products.
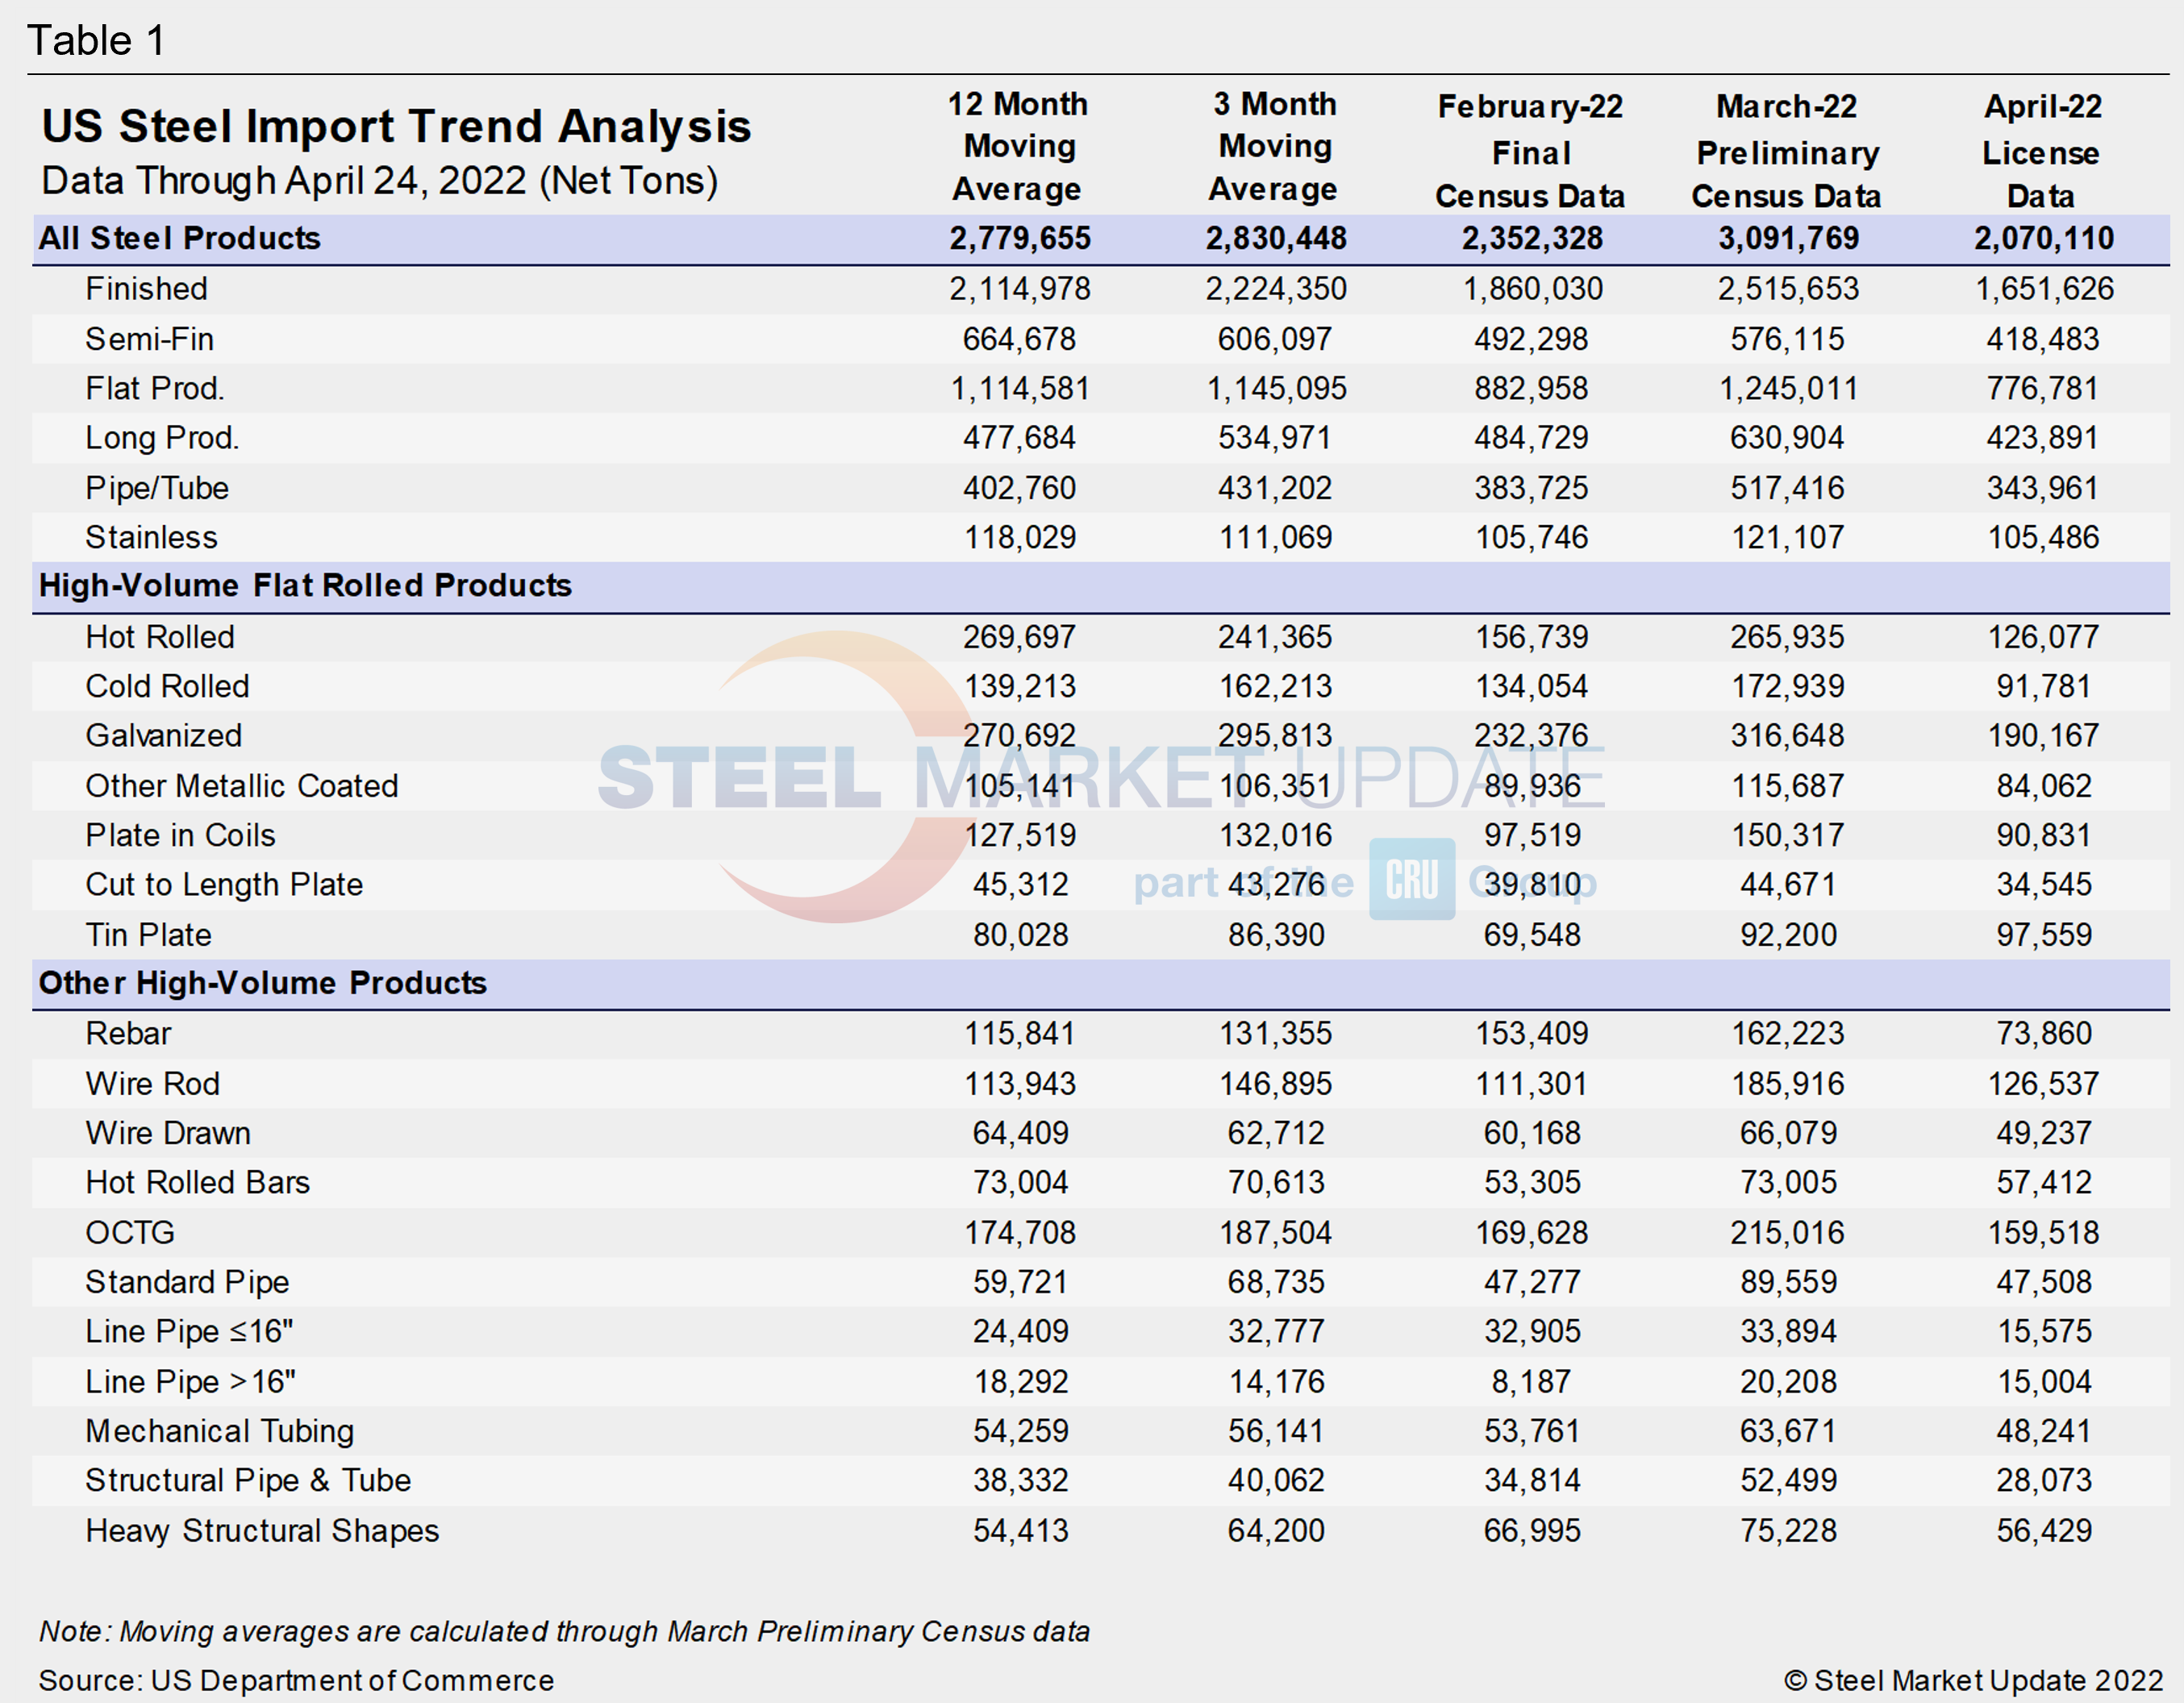
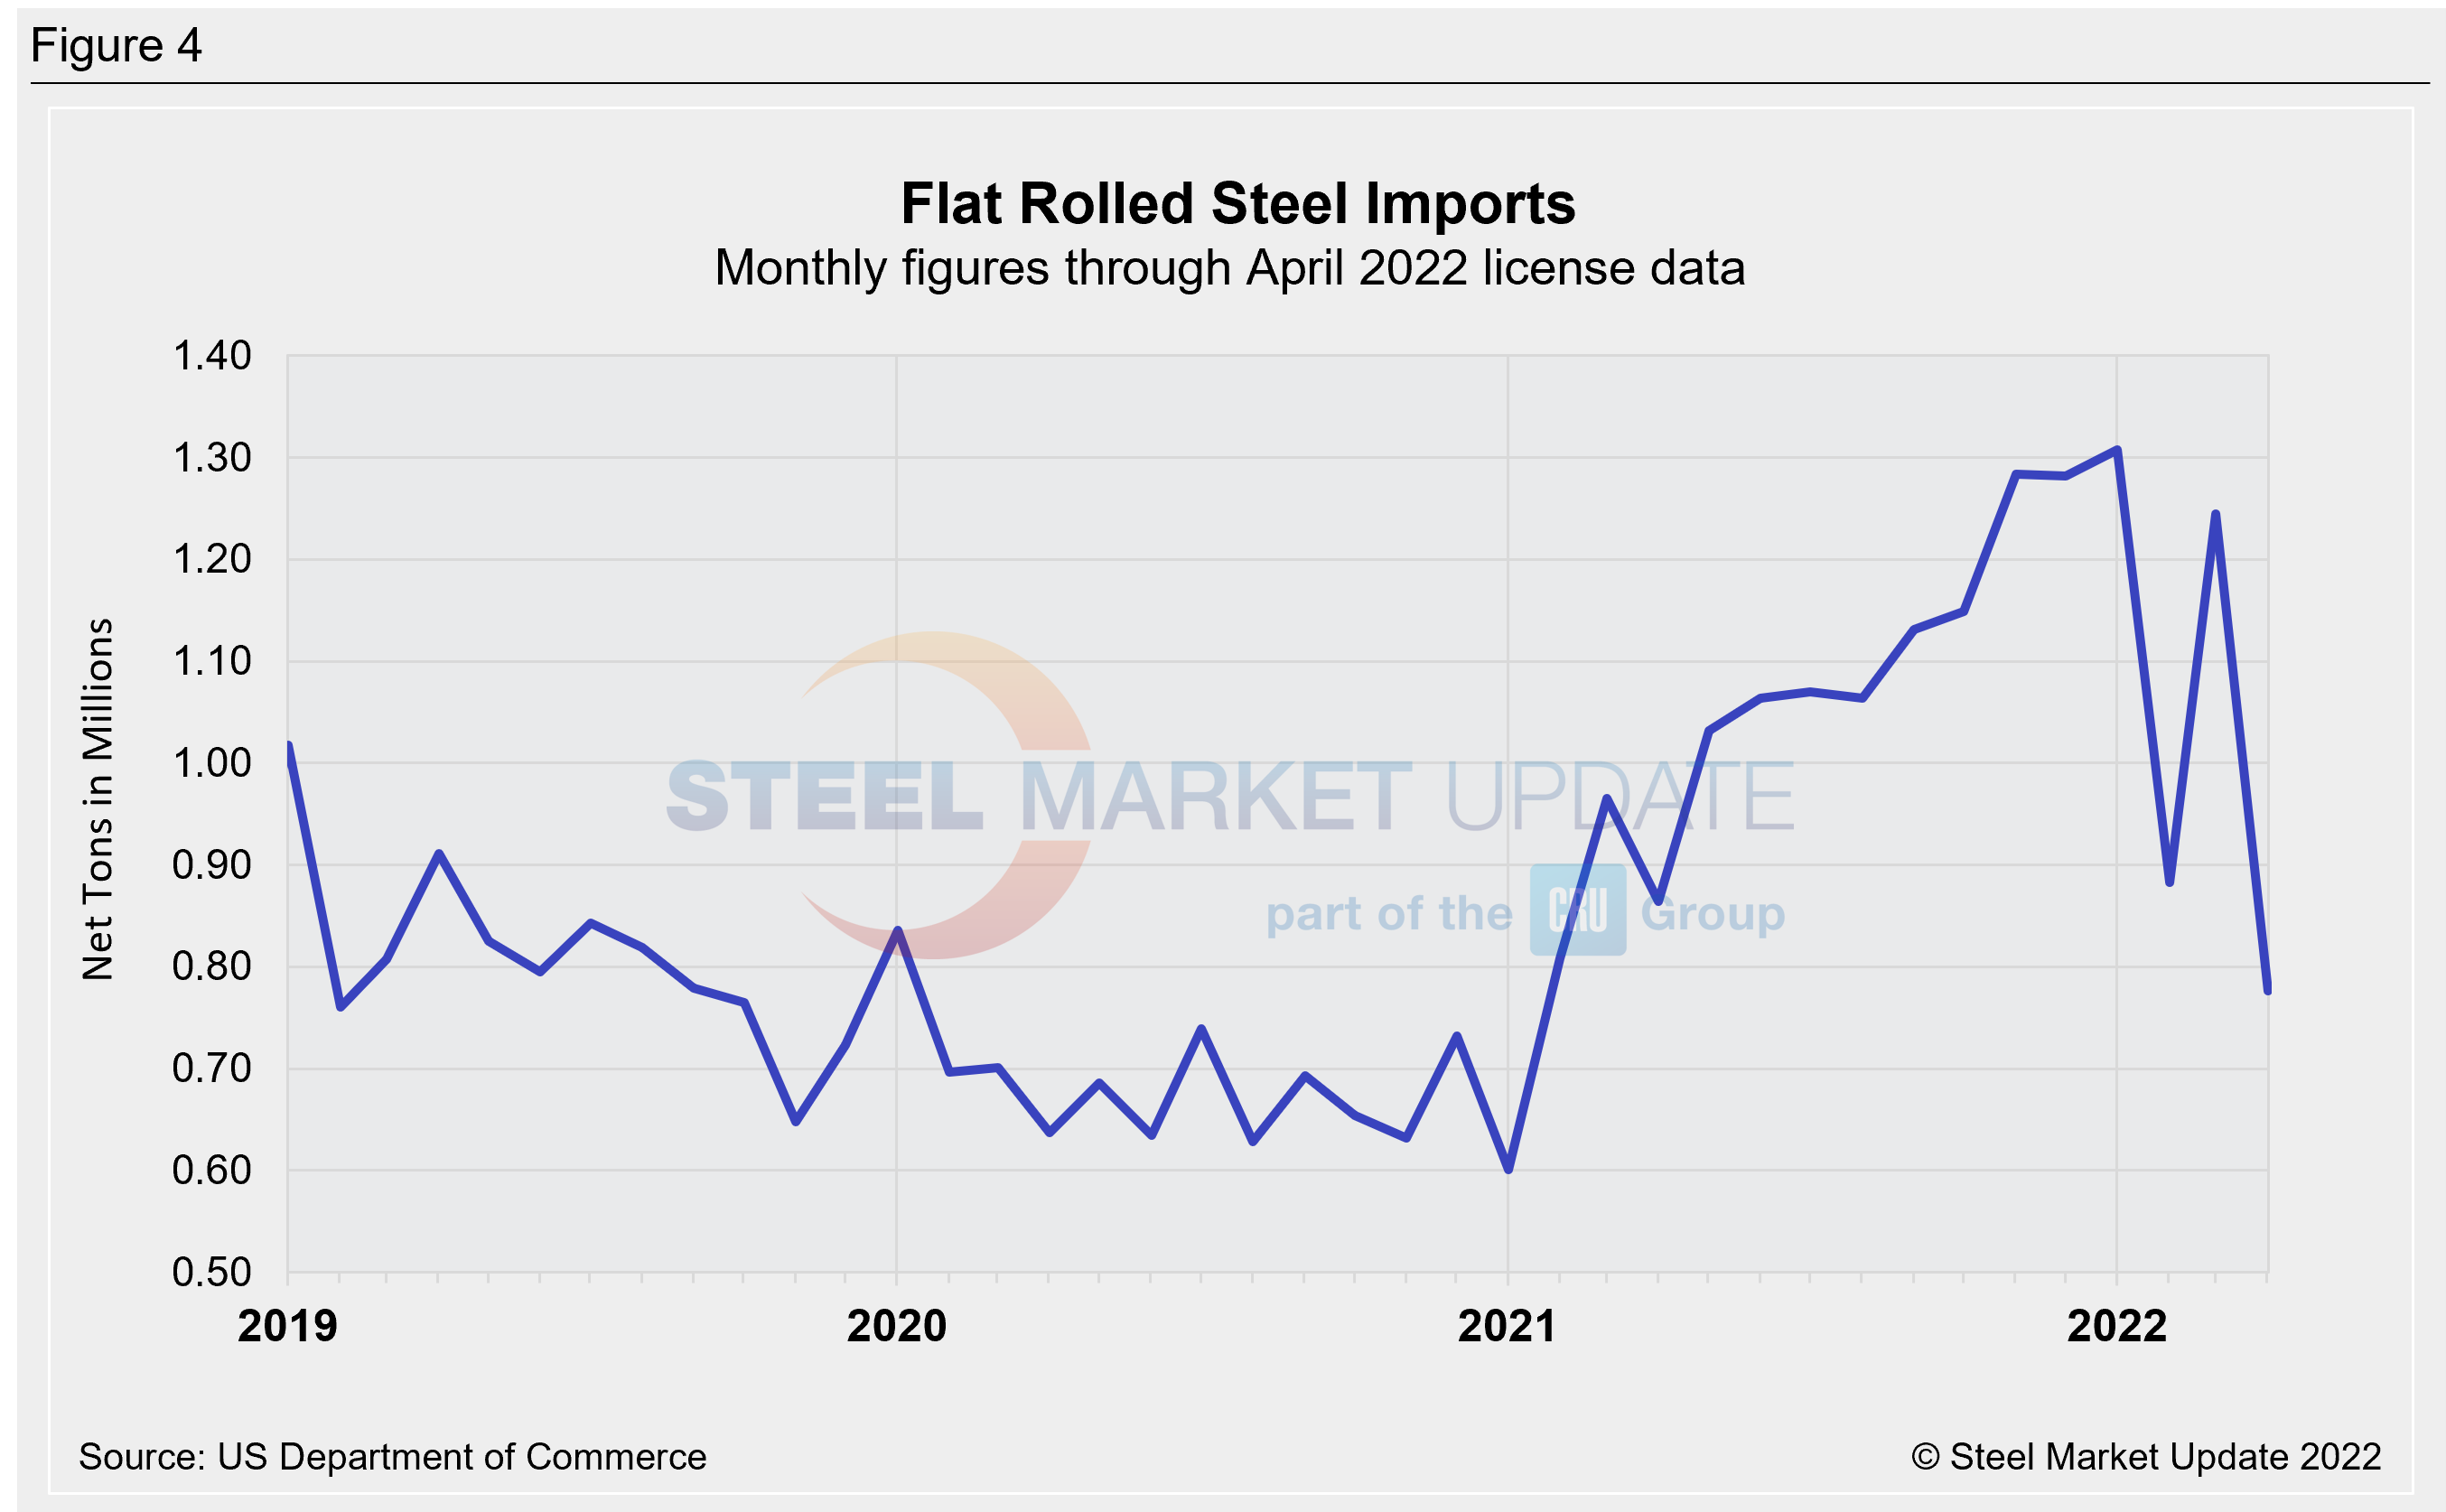
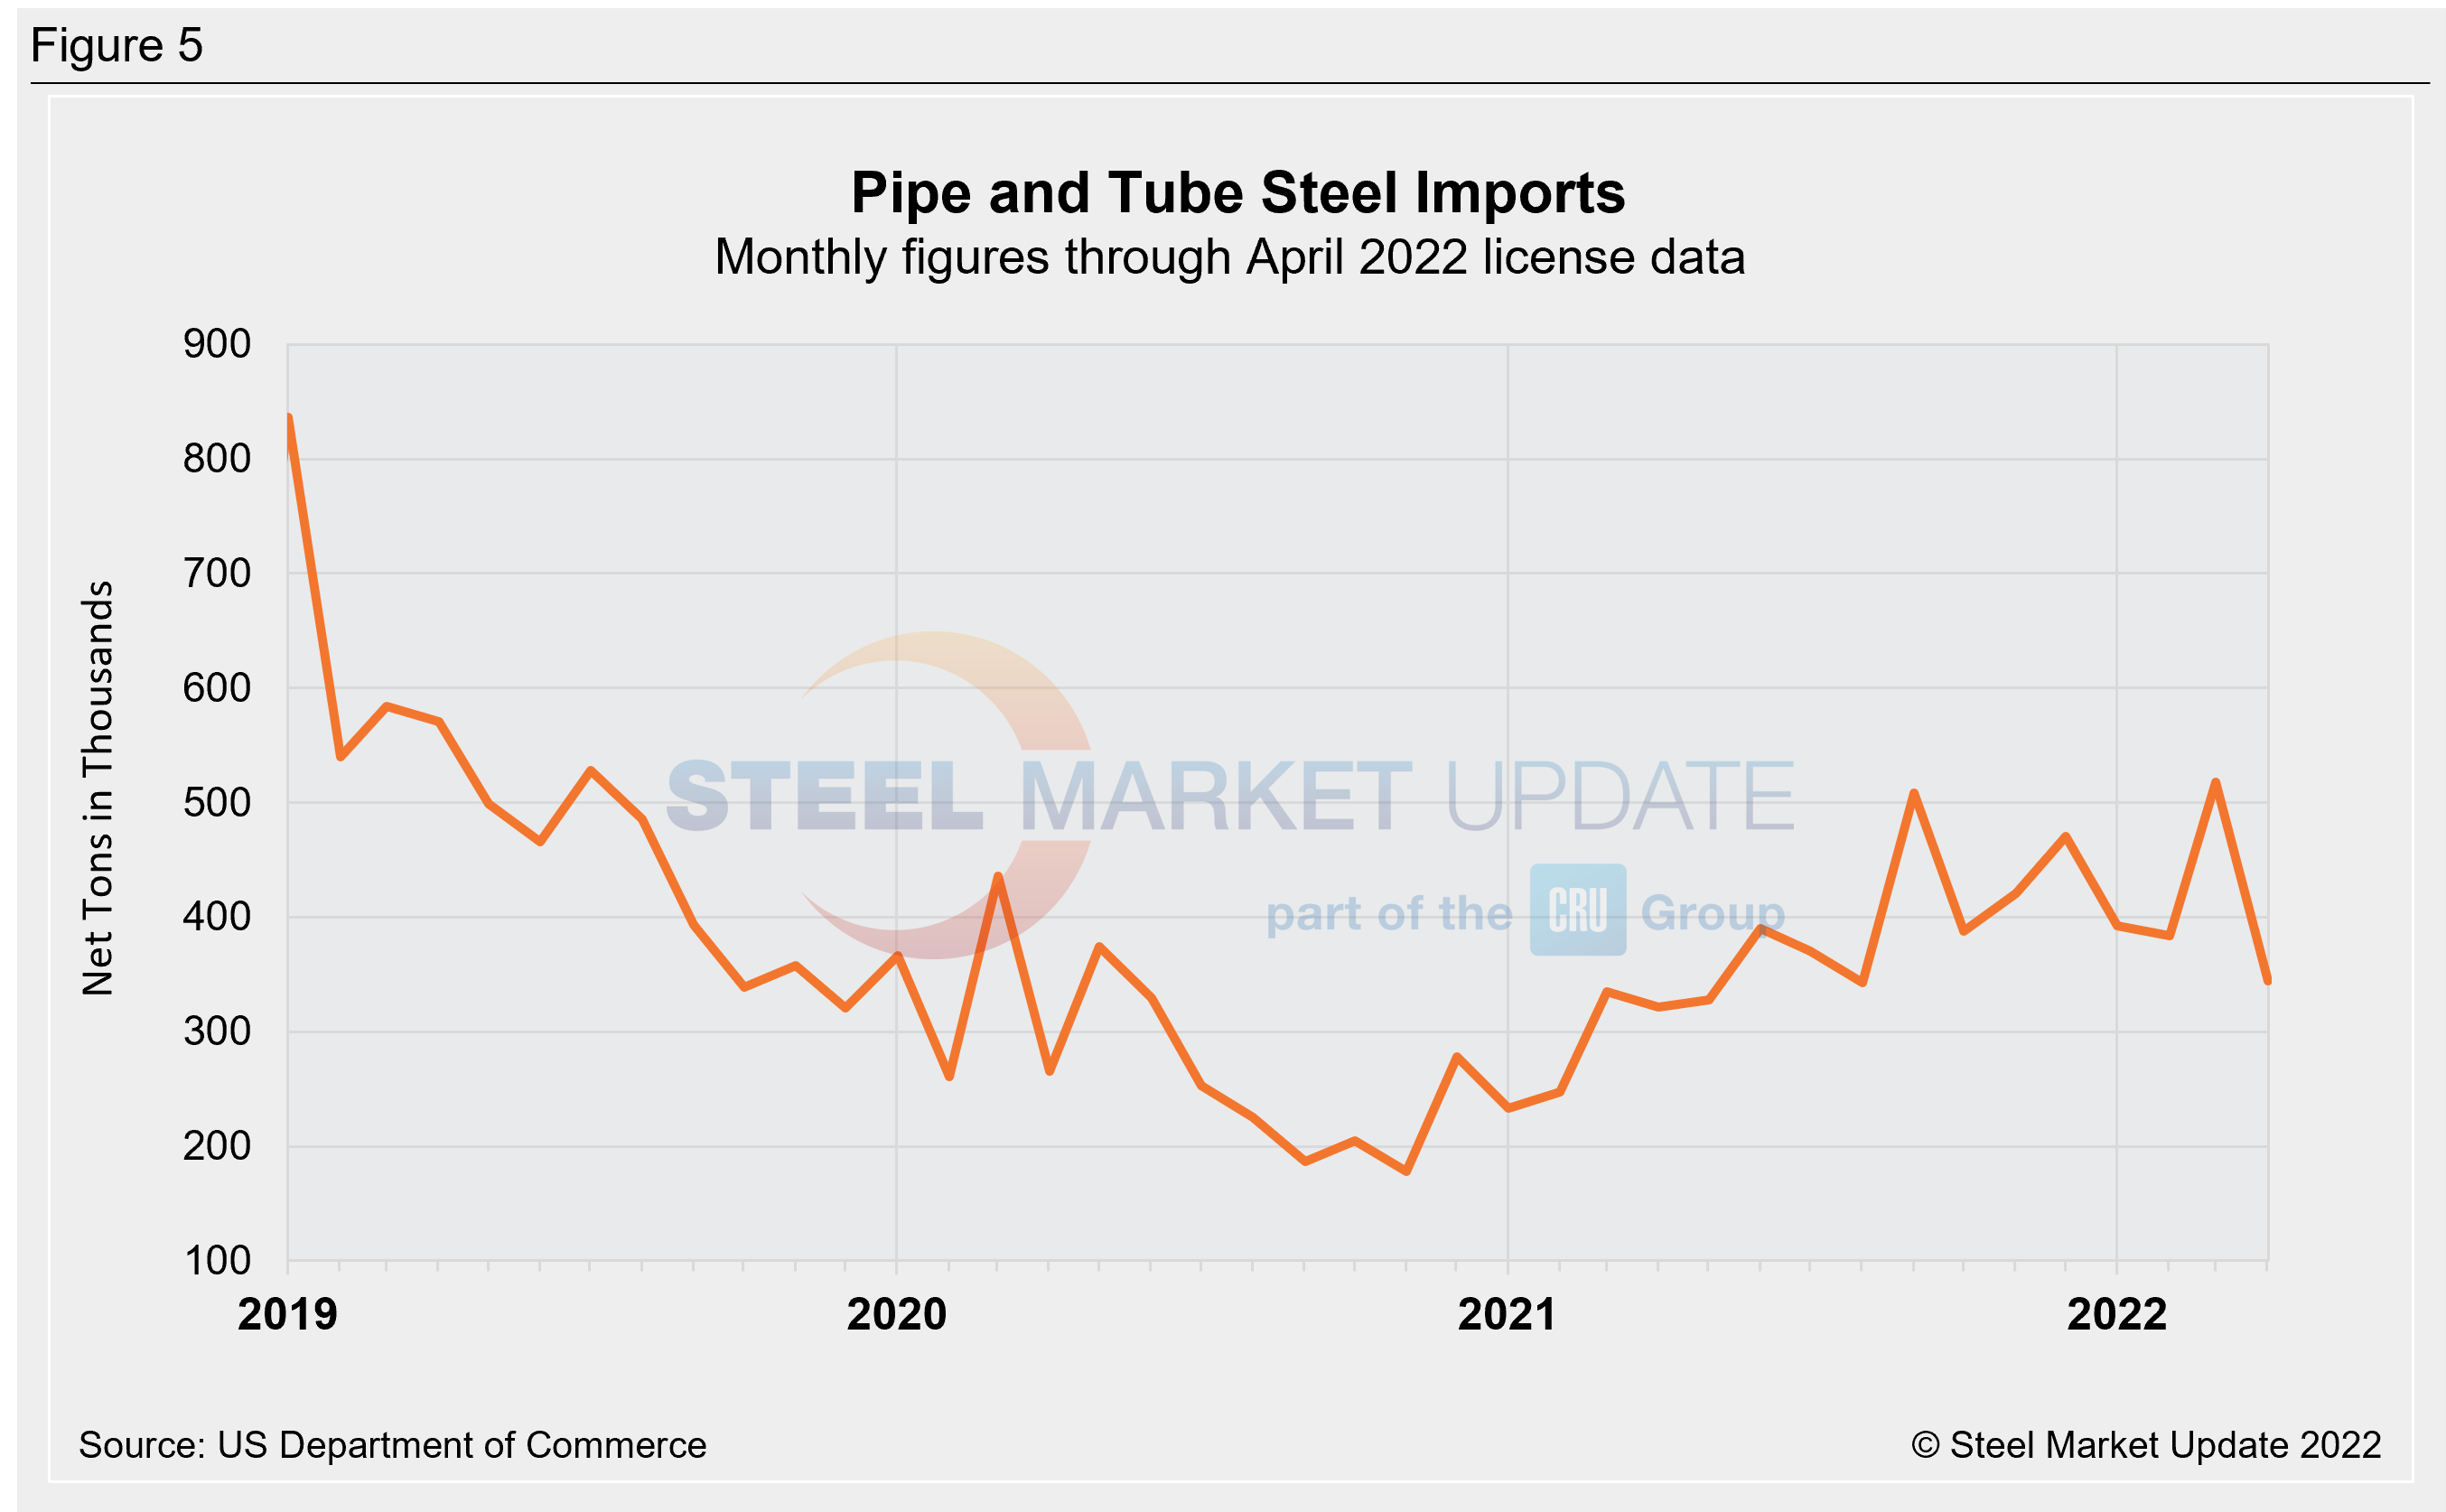
The two charts below show monthly imports grouped by product category: flat rolled imports and pipe and tube imports. March flat rolled imports bounced back from February’s dip to 1.25 million tons, up 41% from the month prior. April licenses show a decline of 38%, with 777,000 tons of flat rolled imports coming into the country. Pipe and tube imports rose 35% to 517,000 tons in March, a 2.5 year high. April pipe and tube import licenses are down 34% to 344,000 tons.
We have an interactive graphing tool available on our website here. Readers can explore historical import data, in total and by product. If you need assistance logging into or navigating the website, contact us at Info@SteelMarketUpdate.com.
By Brett Linton, Brett@SteelMarketUpdate.com


