Market Data
December 21, 2023
SMU survey: Current Buyers Sentiment Index rises, future index falls
Written by Ethan Bernard
SMU’s Current Buyers Sentiment Index inched up this week, while the future index edged down, according to our most recent survey data.
Every other week, we poll steel buyers about sentiment. The Steel Buyers Sentiment Indices measure how steel buyers feel about their companies’ chances of success in the current market and three to six months down the road. (We have historical data dating to 2008. You can find that here.)
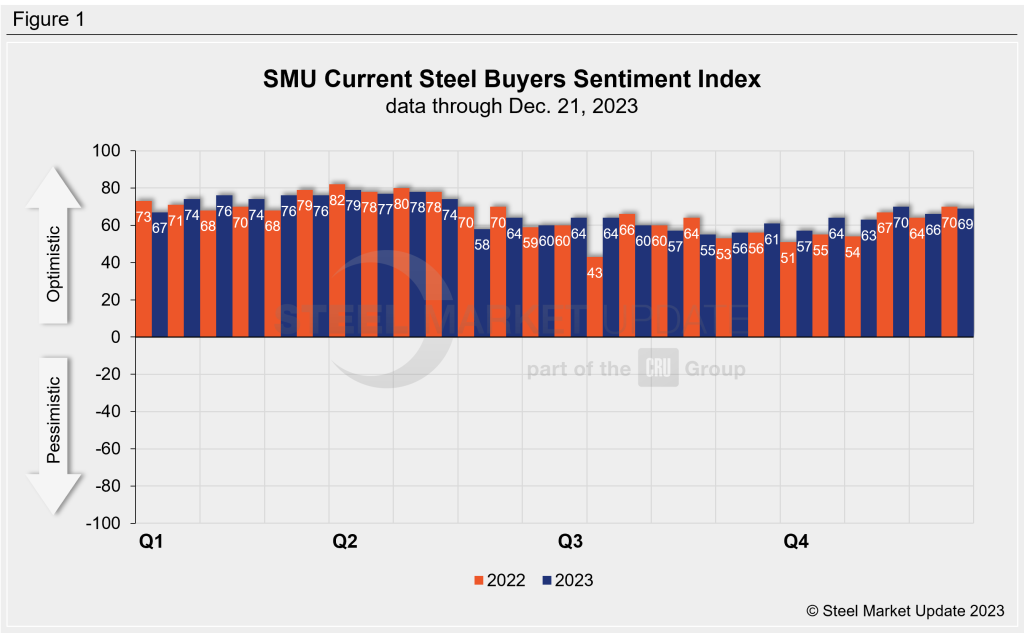
SMU’s Current Buyers Sentiment Index was +69 this week, up three points from +66 two weeks prior (Figure 1). For 2023, the highest reading was at the end of March at 79, while the lowest reading was 55 at the end of August.
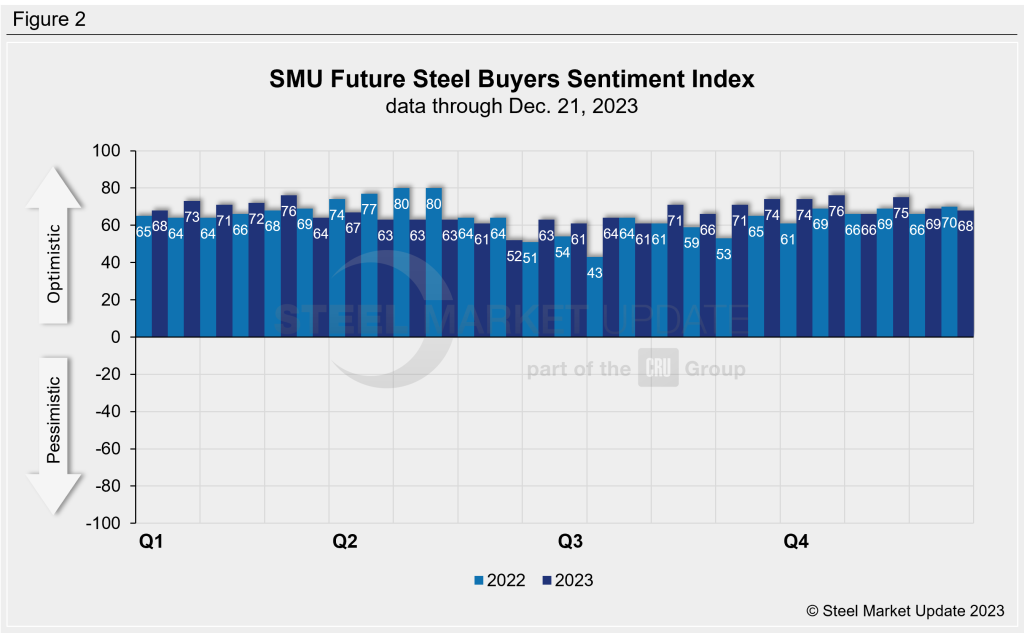
SMU’s Future Buyers Sentiment Index measures buyers’ feelings about business conditions three to six months in the future. This week, the index fell one point from two weeks earlier to +68 (Figure 2). The highest reading for the year was 76, reached at the beginning of March and again at end of October. The lowest reading was 52 at the beginning of June.
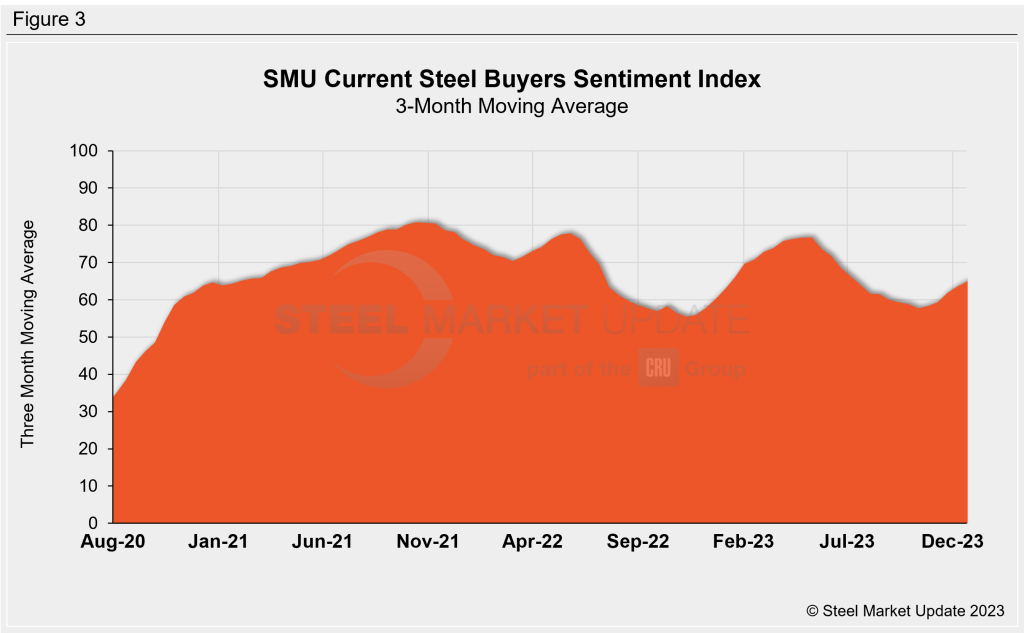
Measured as a three-month moving average, the Current Sentiment 3MMA increased to +66.40 from +63.50 two weeks earlier. (Figure 3).
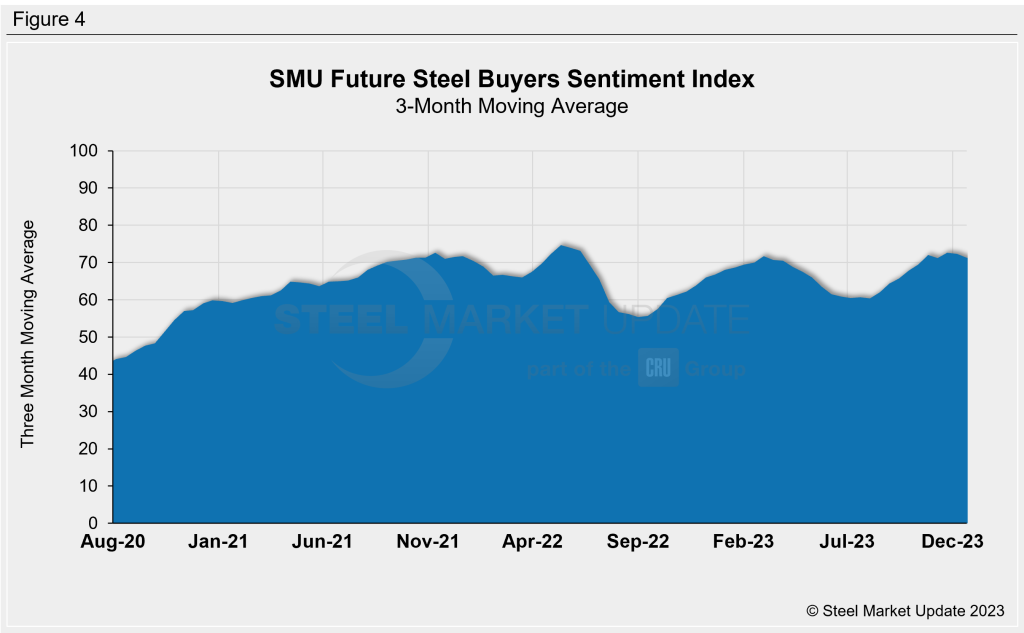
This week’s Future Sentiment 3MMA fell to +71.33 vs. +72.33 at the previous market check (Figure 4).
What SMU respondents had to say:
“This year we met what was anticipated.”
“Import demand is stable to increasing.”
“Import business is stronger now due to domestic price increase.”
“Our forecast is currently at capacity limits.”
About the SMU Steel Buyers Sentiment Index
The SMU Steel Buyers Sentiment Index measures the attitude of buyers and sellers of flat-rolled steel products in North America. It is a proprietary product developed by Steel Market Update for the North American steel industry. Tracking steel buyers’ sentiment is helpful in predicting their future behavior.
Positive readings run from +10 to +100. A positive reading means the meter on the right-hand side of our home page will fall in the green area indicating optimistic sentiment. Negative readings run from -10 to -100. They result in the meter on our homepage trending into the red, indicating pessimistic sentiment. A reading of “0” (+/- 10) indicates a neutral sentiment (or slightly optimistic or pessimistic), which is most likely an indicator of a shift occurring in the marketplace. Sentiment is measured via SMU surveys twice per month. If you would like to participate in our survey, please contact us at info@steelmarketupdate.com.