Analysis
September 12, 2025
Apparent steel supply remains elevated in July
Written by Brett Linton
The volume of finished steel that entered the US market in July declined less than 1% from June, holding near one of the highest rates seen in recent years, according to SMU’s analysis of Department of Commerce and American Iron and Steel Institute (AISI) data.
This “apparent steel supply” metric is calculated by combining domestic mill shipments with finished US steel imports then subtracting total US exports.
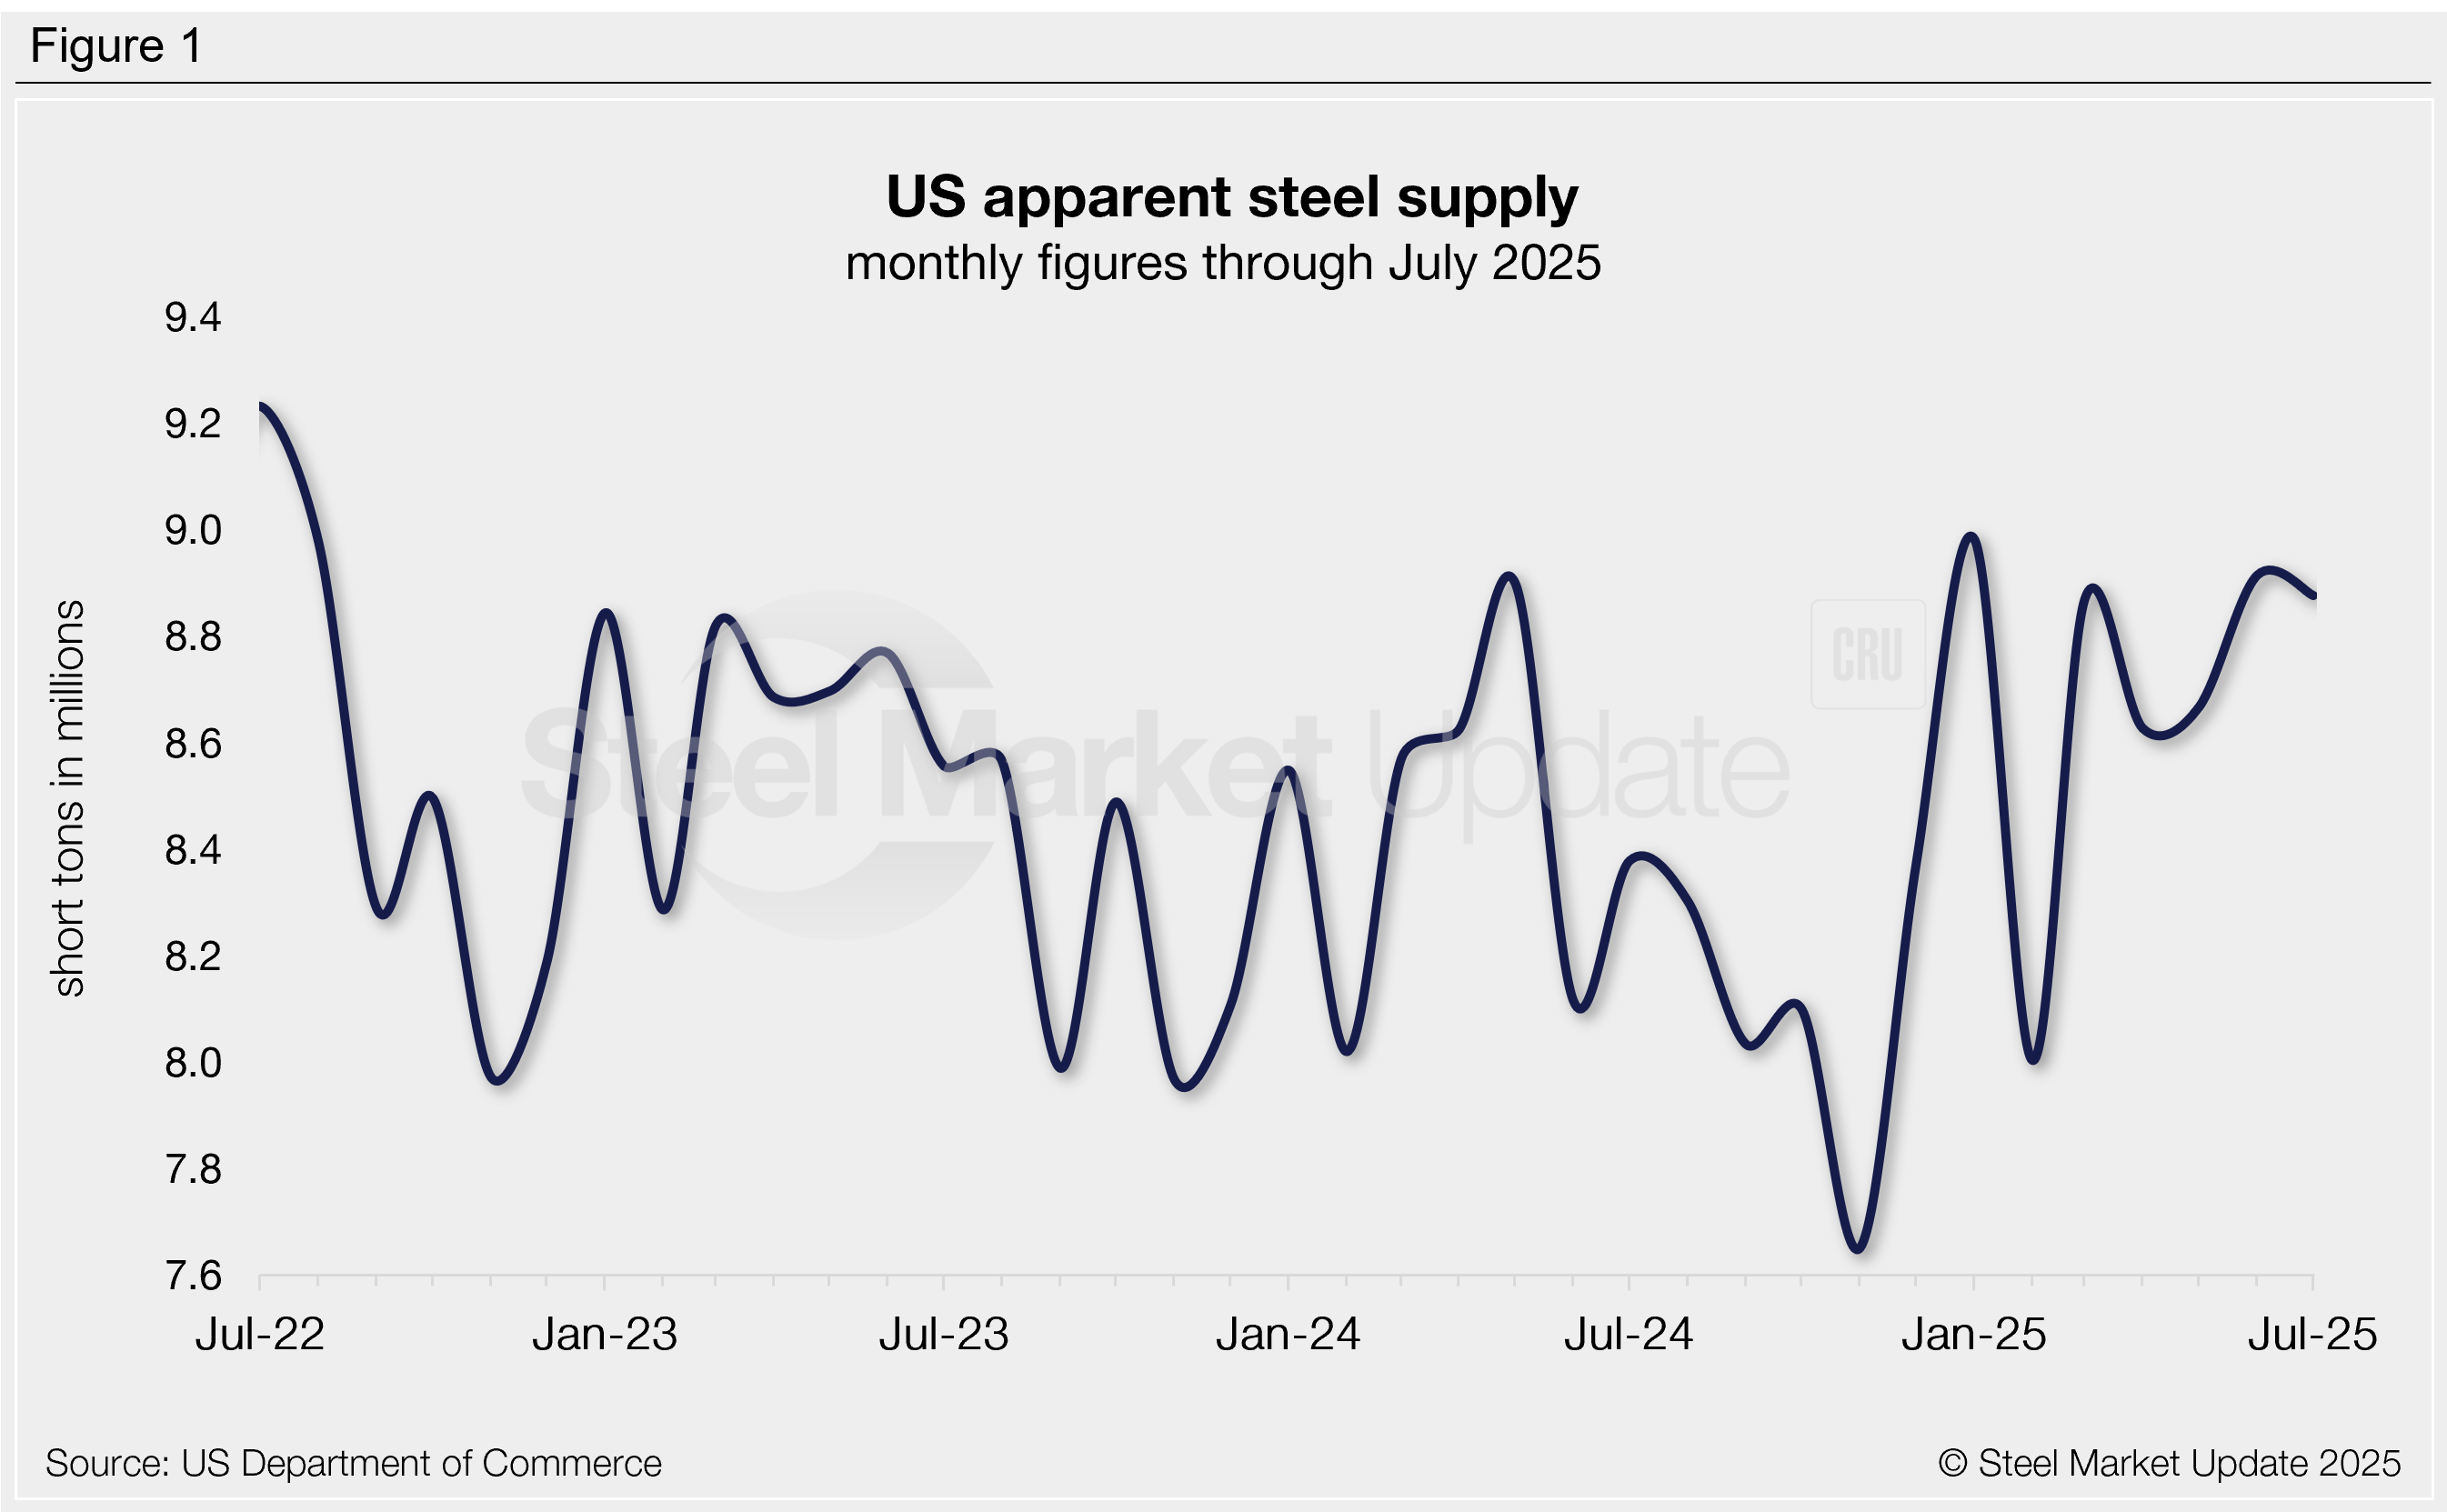
Apparent supply totaled 8.88 million short tons (st) in July, down 38,000 st from June and 6% higher than the same month last year. This marks the fourth-highest monthly supply rate seen since 2022.
Supply has fluctuated within a stable range over the past three years, averaging 8.45 million st per month in that time (Figure 1). We saw increased volatility around the turn of the calendar year. Last November, supply fell to a near four-year low of 7.65 million st, then rebounded in January to a two-and-a-half year high of 8.98 million st. For comparison, the highest measure recorded in our 15-year data history was 10.90 million st in 2014 and the lowest was 6.52 million st in mid-2020.
Trends
Supply can be calculated on a three-month moving average (3MMA) to smooth out monthly fluctuations and better highlight trends (Figure 2). On this basis, supply peaked in late 2021 at 9.87 million st and bottomed out by the end of 2022. After touching a four-year low of 7.93 million st last November, the 3MMA has recovered almost each month since, rising to a near three-year high of 8.82 million st through July.
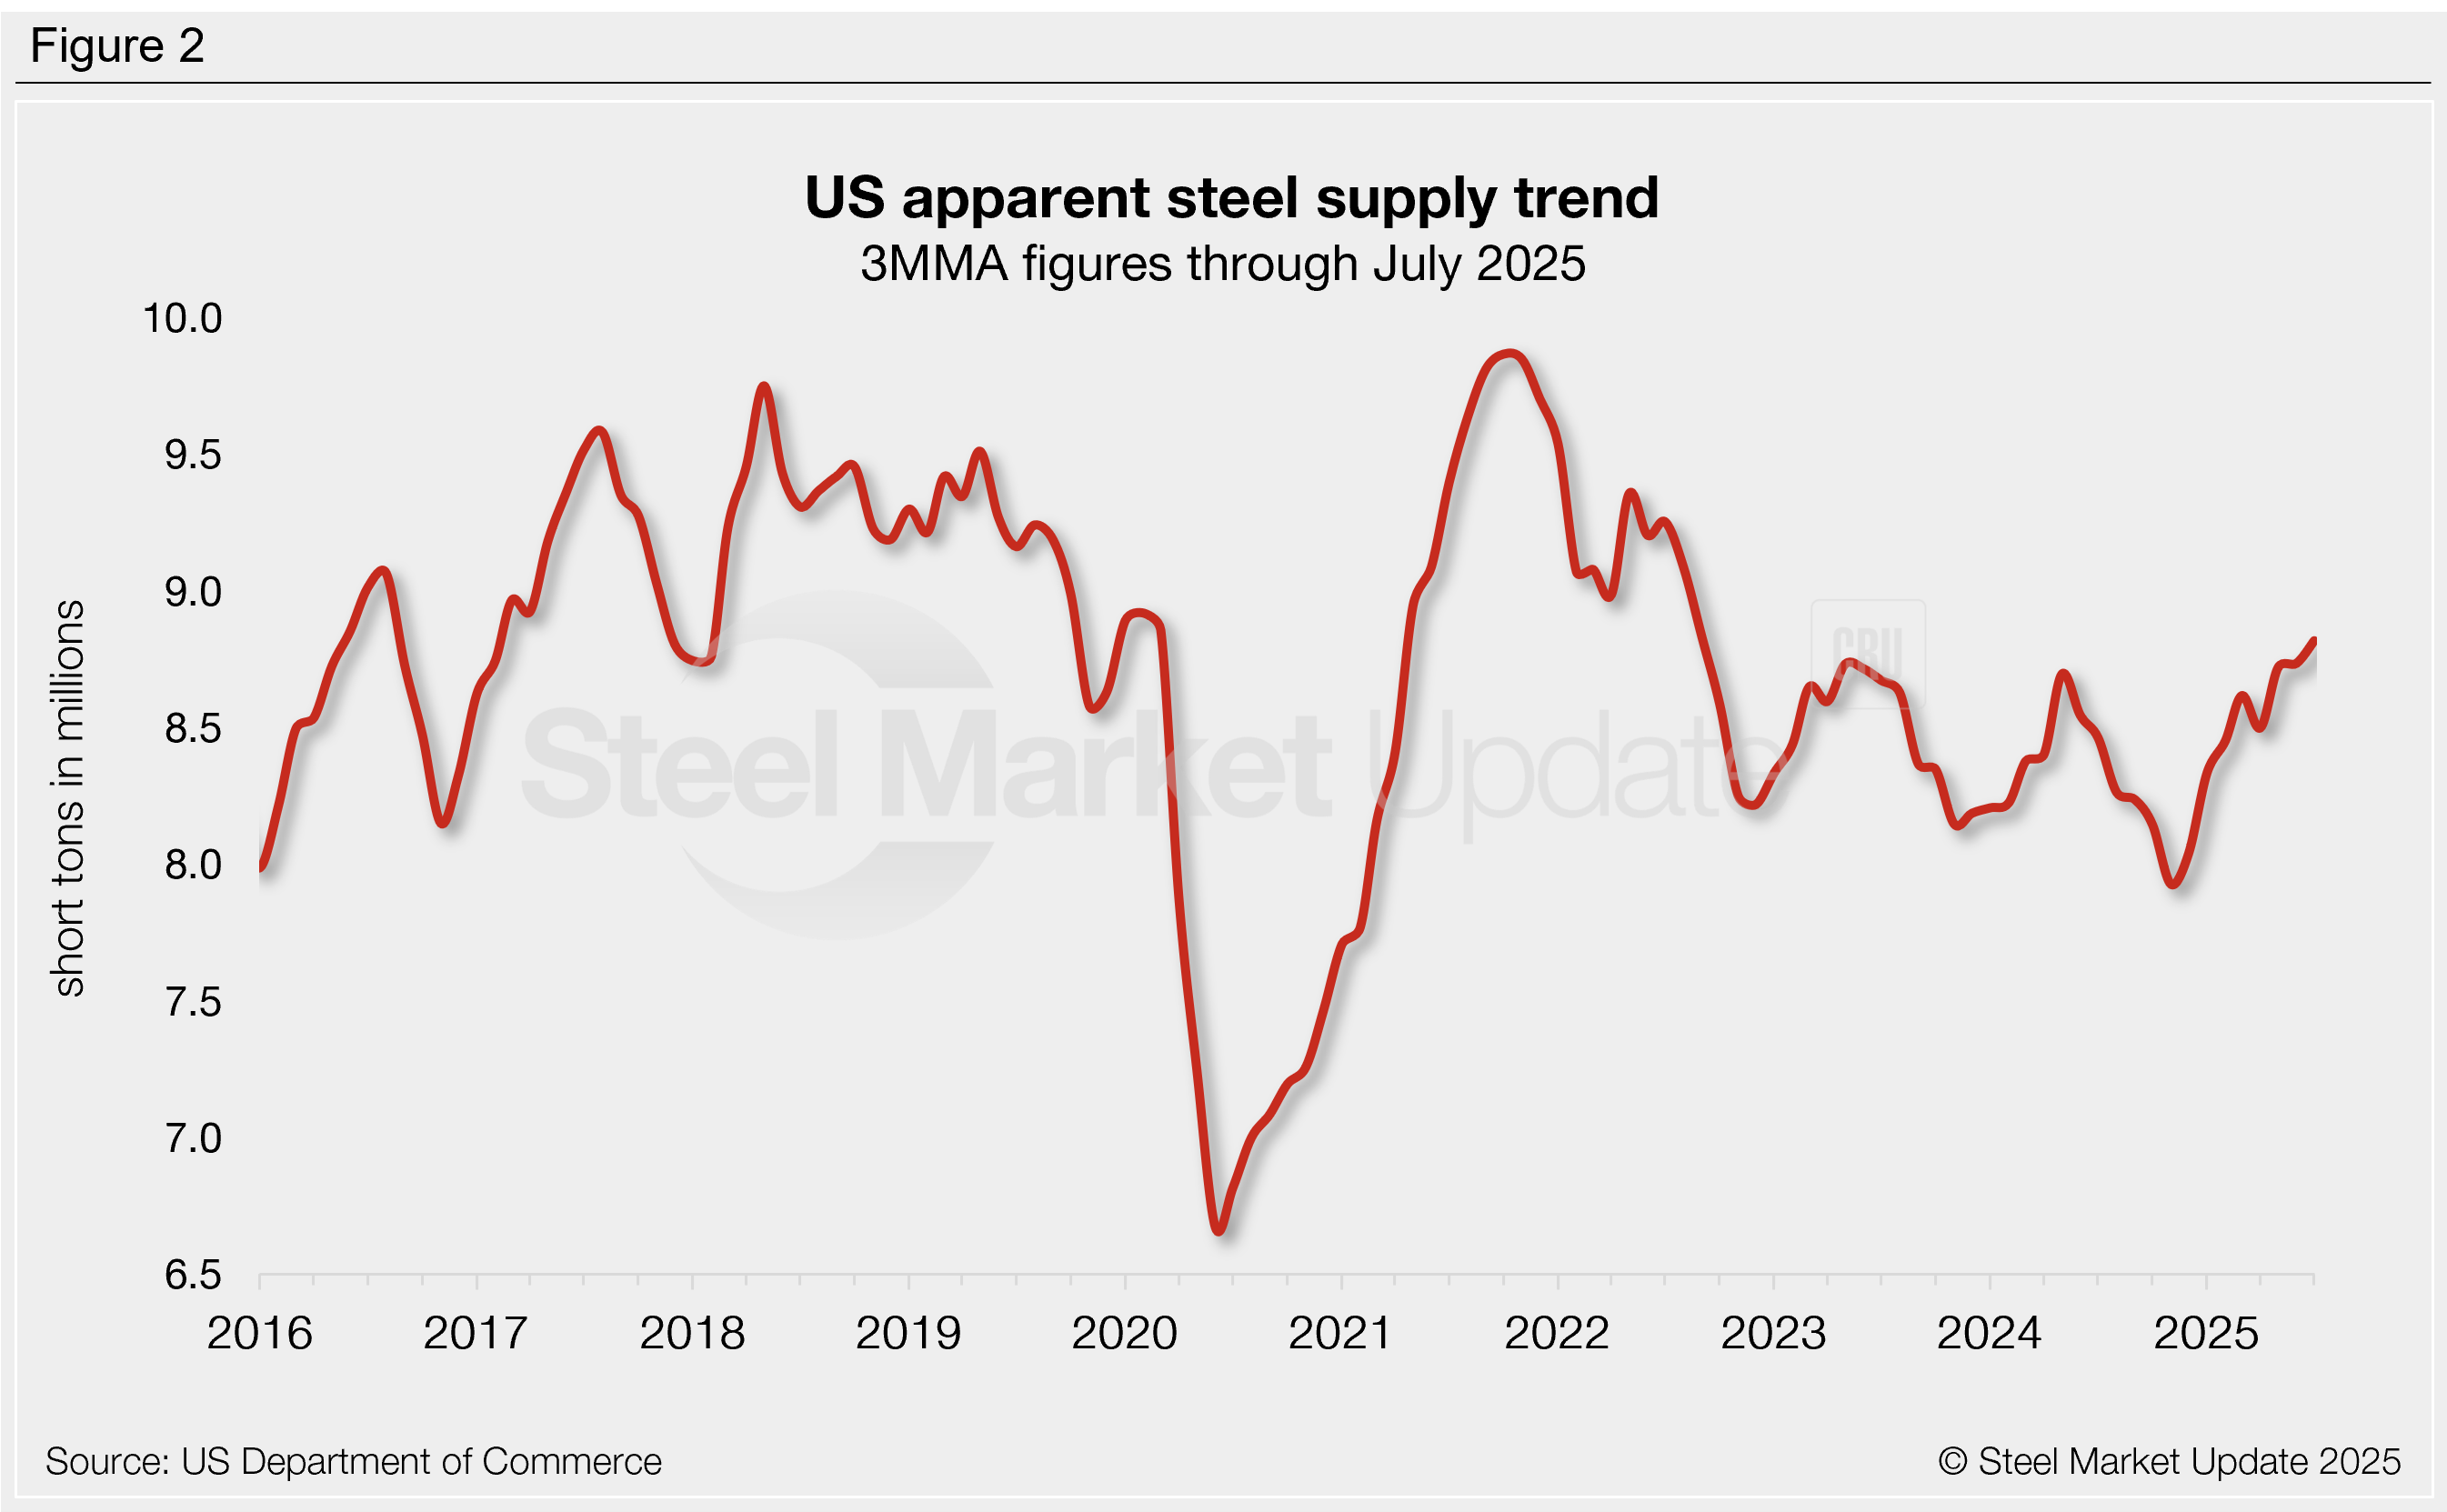
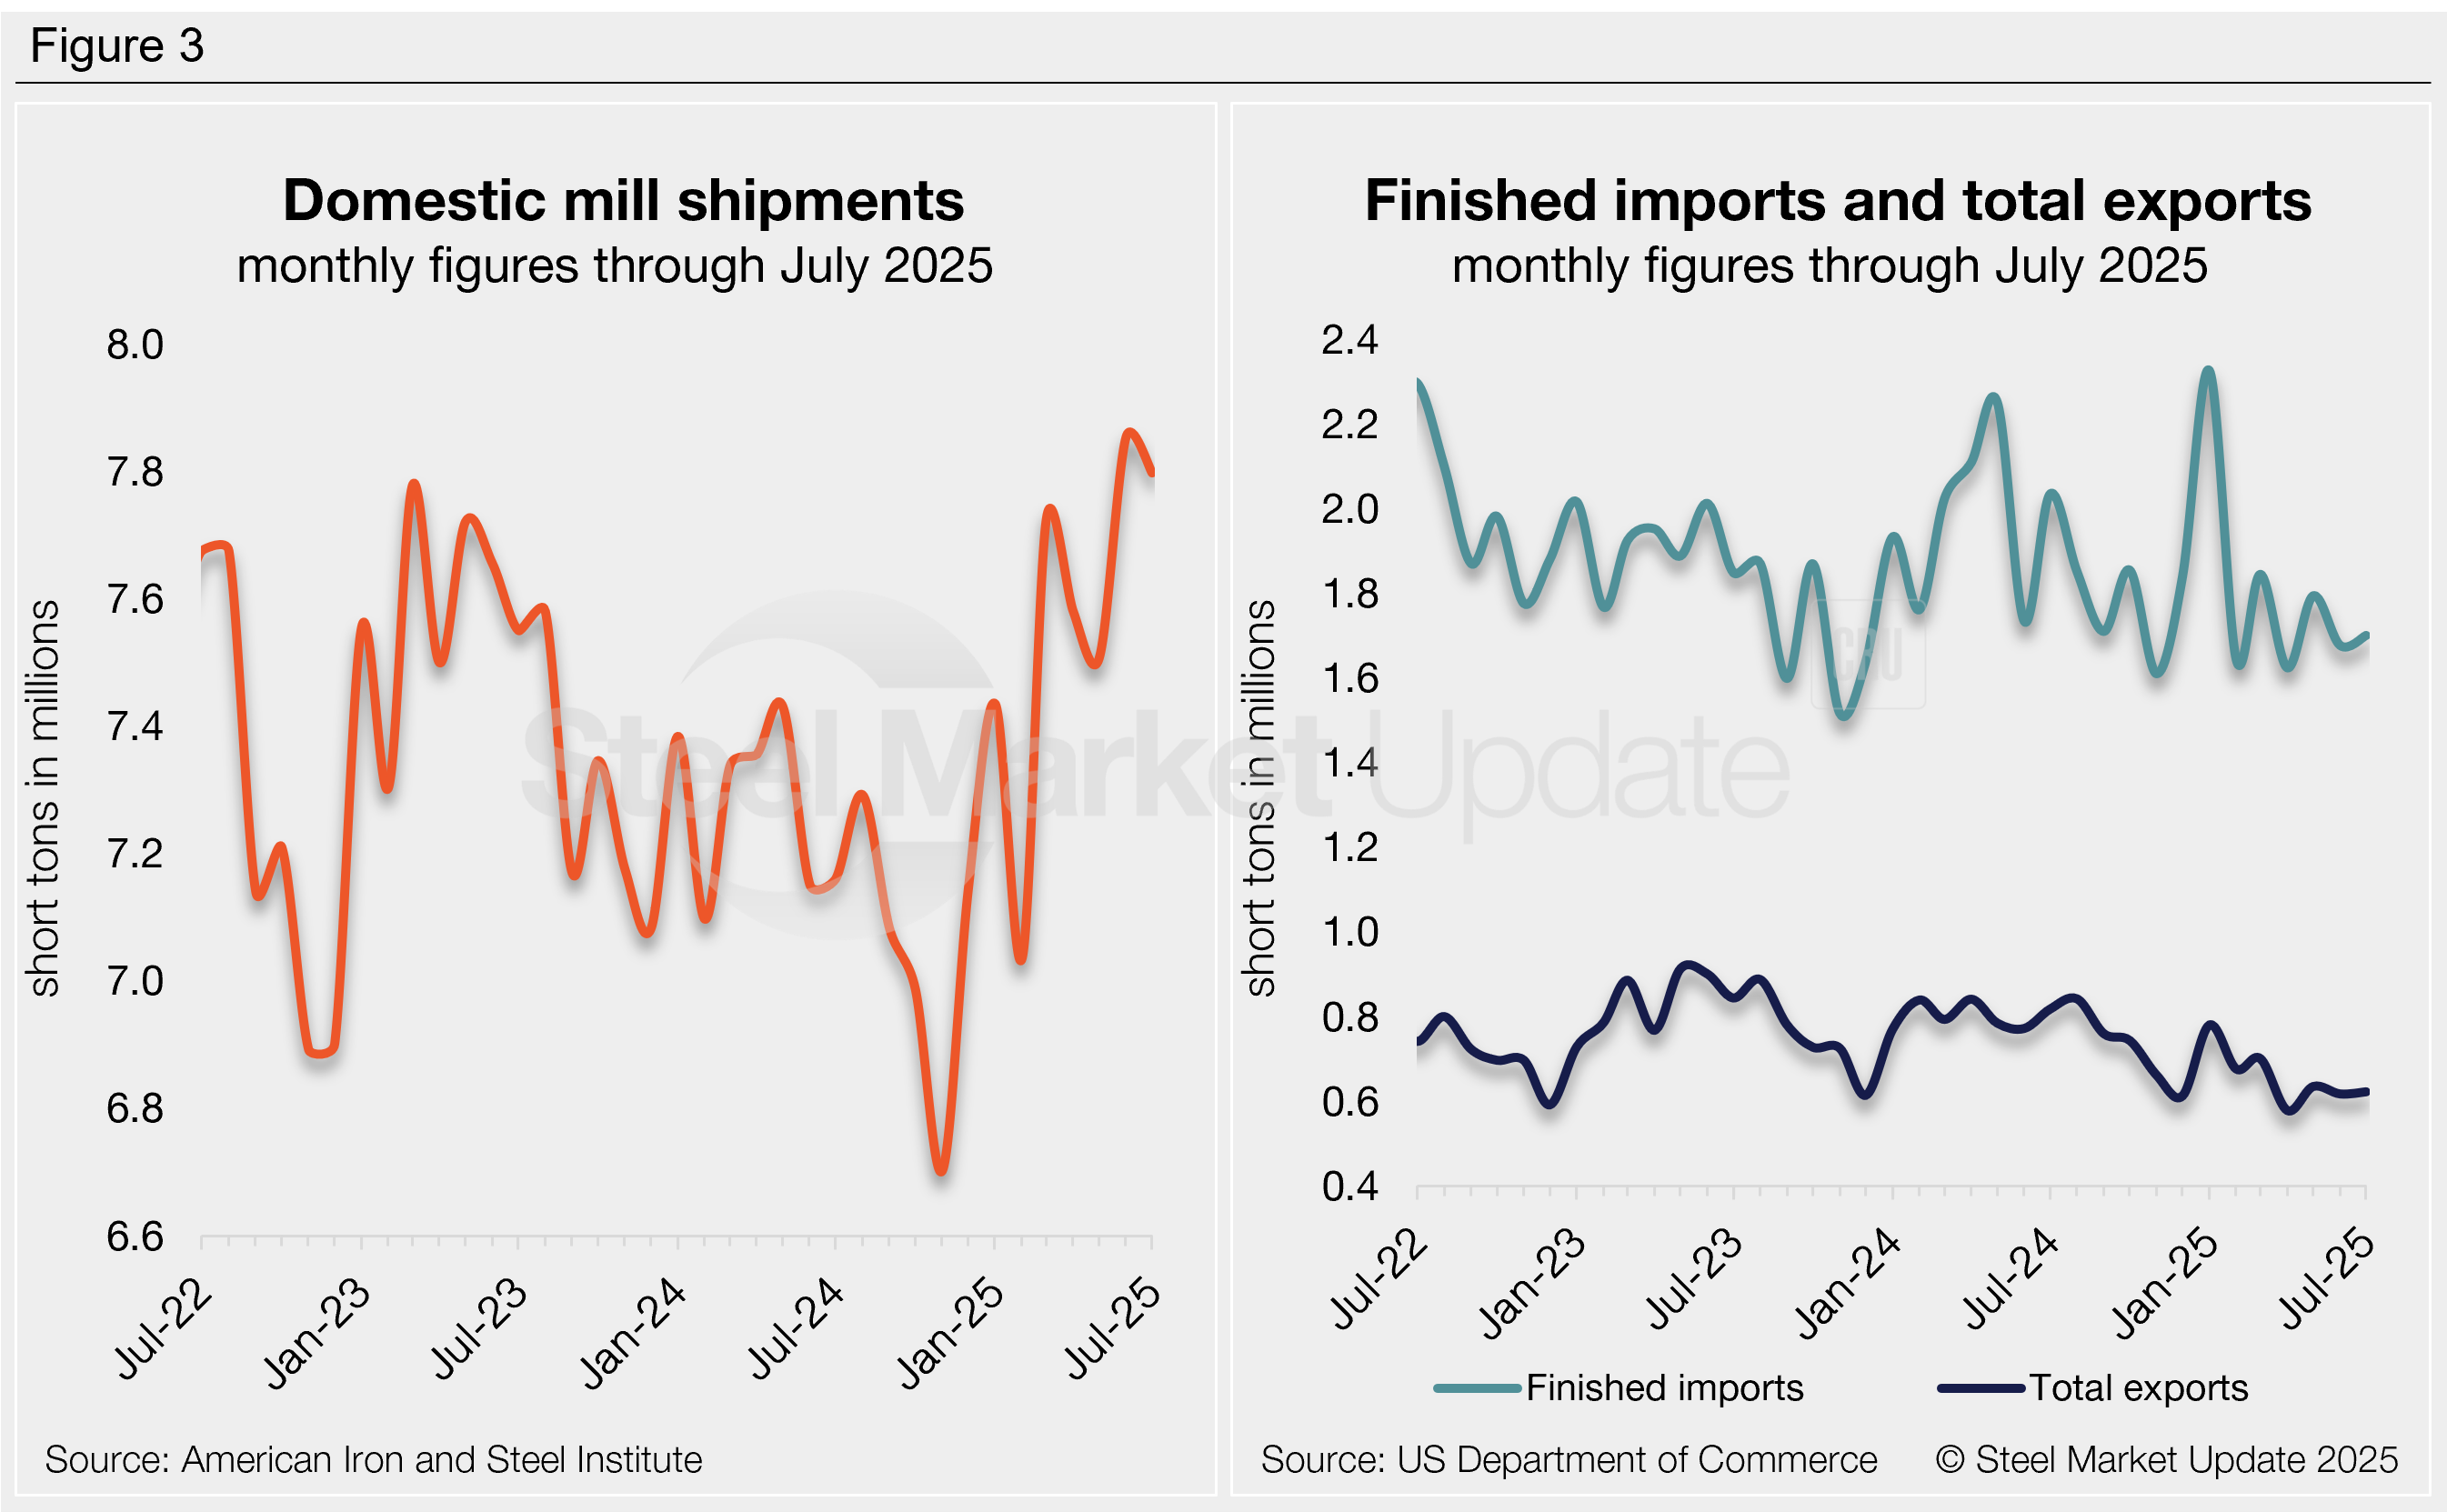
Figure 3 shows the individual components of apparent supply and their marginal shifts from June to July:
- Domestic shipments declined 1% (56,000 st) to 7.80 million st, accounting for 88% of total supply.
- Finished steel imports rose 1% (24,000 st) to 1.70 million st, holding near one of the lowest rates seen in the past year and a half.
- Steel exports increased 1% (5,000 st) to 623,000 st, the sixth-lowest monthly export rate since the COVID-19 pandemic.
- Net imports (finished imports minus exports) made up 12% of July’s supply, in line with the previous month, but down from 15% one year prior.
To see an interactive graphic of our apparent steel supply history, click here. If you need any assistance logging into or navigating the website, contact us at info@steelmarketupdate.com.