Analysis

November 25, 2025
Steel imports slump in September and October
Written by Brett Linton
With the end of the US government shutdown, the Department of Commerce has resumed updating its trade records, including steel import license data. According to figures released last week, imports have declined considerably from our early September update, with September and October trade down to levels not seen in nearly five years.
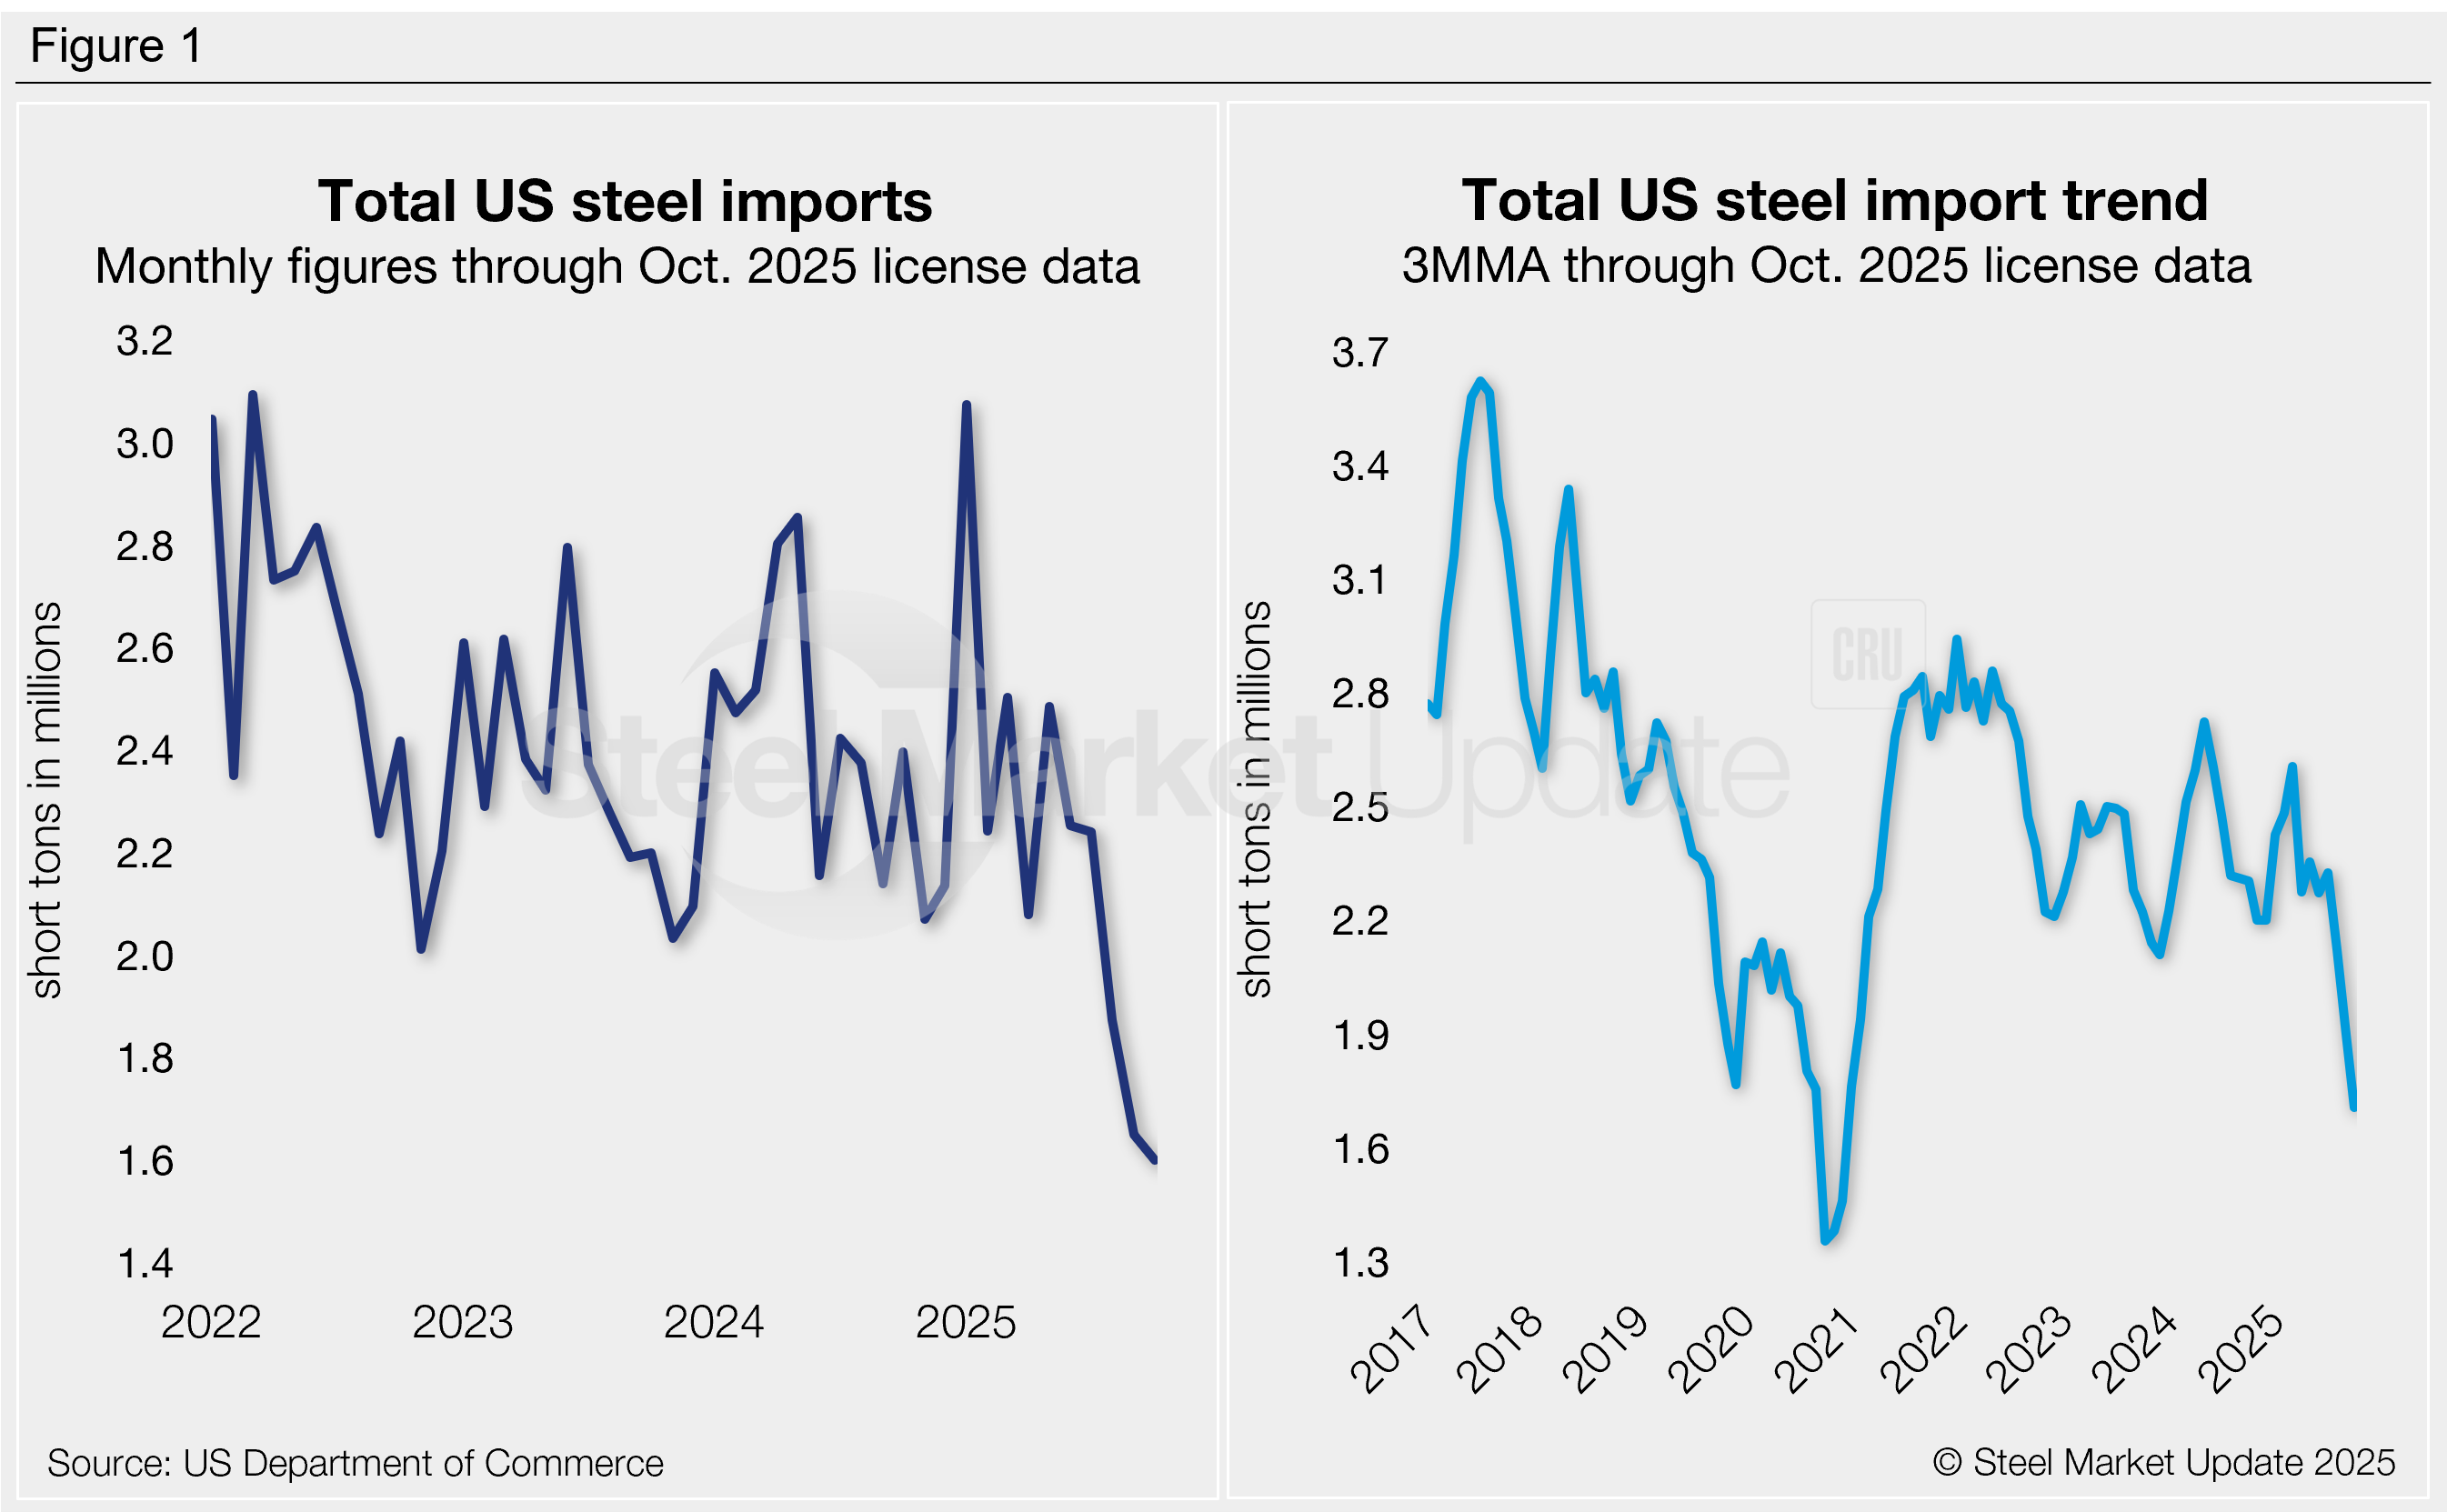
The total volume of steel products entering the country in September eased to 1.65 million short tons (st), the lowest monthly rate since December 2020. October license figures are down even further to 1.60 million st. November licenses through the 17th totaled 979,000 st, but we will omit this partial month’s data in this analysis as permits are still being collected. Recall that imports spiked to a two-and-a-half-year high of 3.08 million st at the start of the year (Figure 1, left).
Across the first ten months of 2025, imports averaged 2.20 million st per month. For comparison, imports averaged 2.47 million st per month in the same period of 2024 and 2.41 million st per month in 2023.
Nearly three-quarters of the steel that entered the country in September and October came from just eight countries. In September, that was Canada (19%), Brazil (15%), South Korea (14%), Mexico (8%), Germany (5%), Japan (5%), Vietnam (4%), and Argentina (4%). Other major suppliers included the Netherlands, Taiwan, India, the United Kingdom, China, Indonesia, and Turkey, each contributing 2-3% of the total. Combined, these 15 countries accounted for 88% of all September imports.
To explore steel import data by country, category, or specific product, visit the International Trade Administration’s Steel Import Monitor.
Import trends
To better highlight trends, import data can be analyzed as a three-month moving average (3MMA) to smooth out monthly variations (Figure 1, right). On this basis, 3MMA imports have also fallen to multi-year lows through October, now totaling 1.71 million st. Compare this to the 10-month high of 2.61 million st set in March.
Imports by product
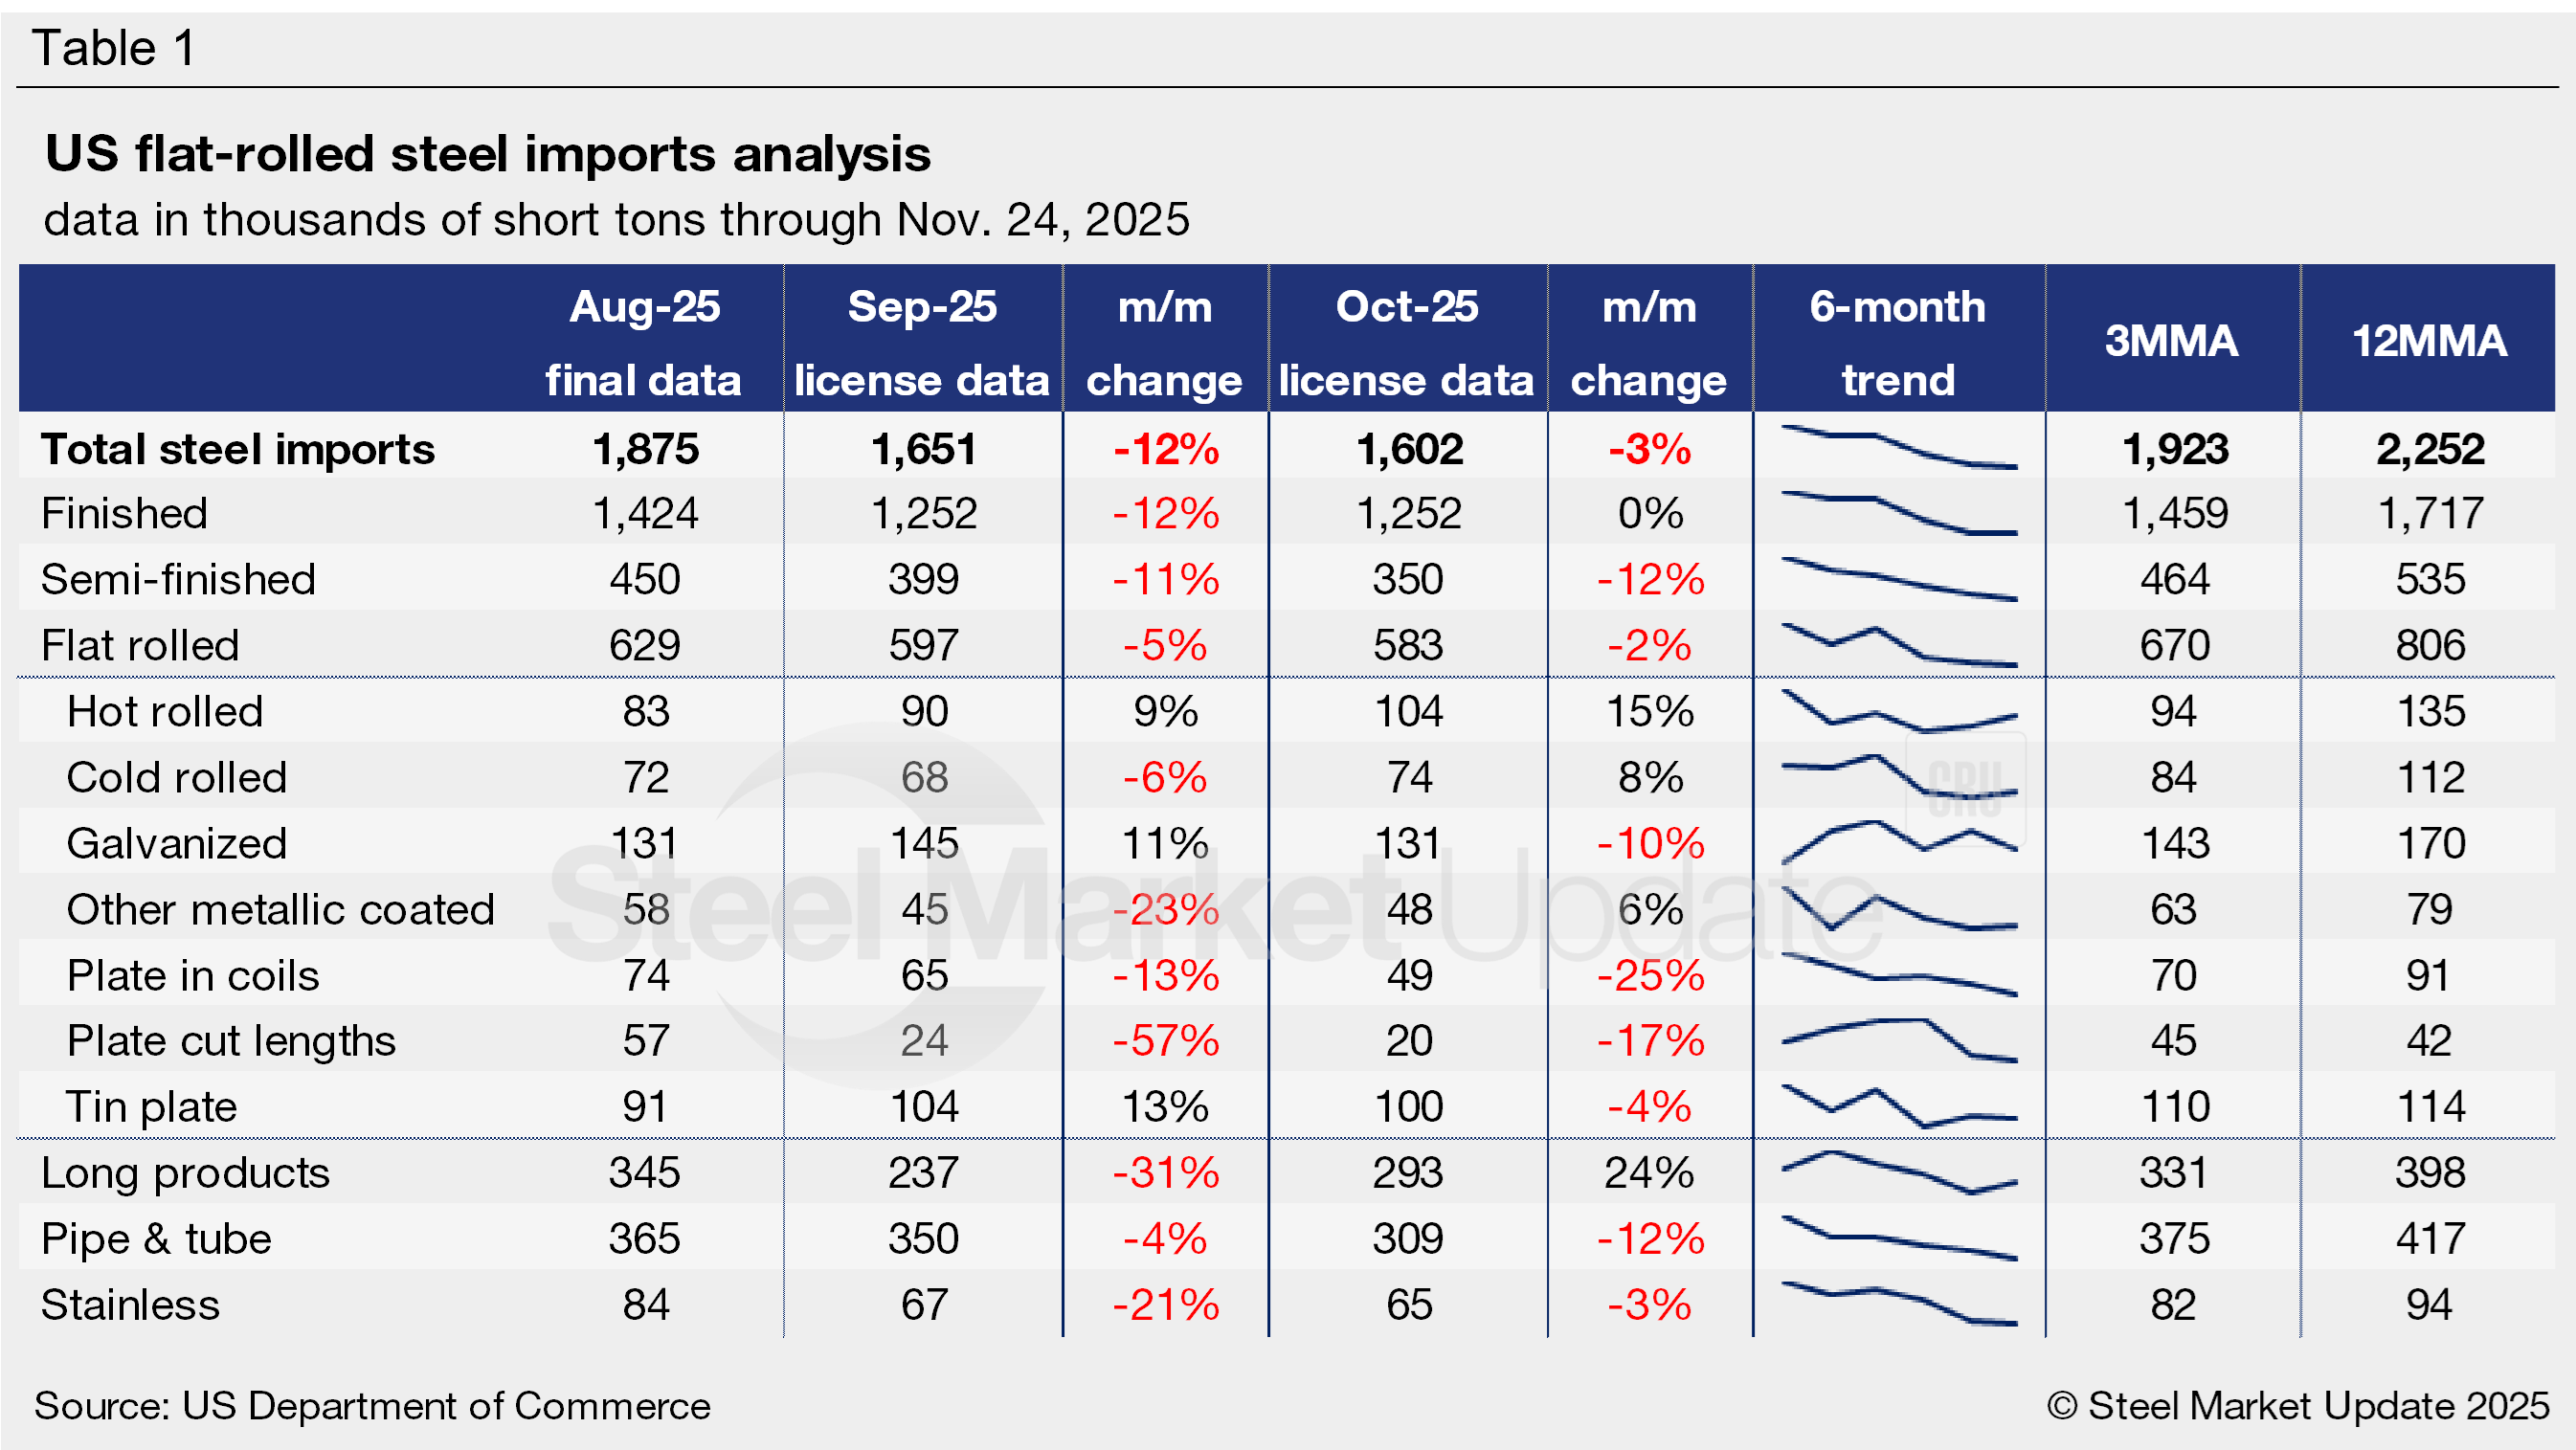
Table 1 highlights high-volume steel product imports (click to expand). Note that the 3MMA and 12MMA columns are calculated through September figures. For a deeper analysis of data by specific products, visit our Steel Imports page.
Finished vs. semi-finished imports
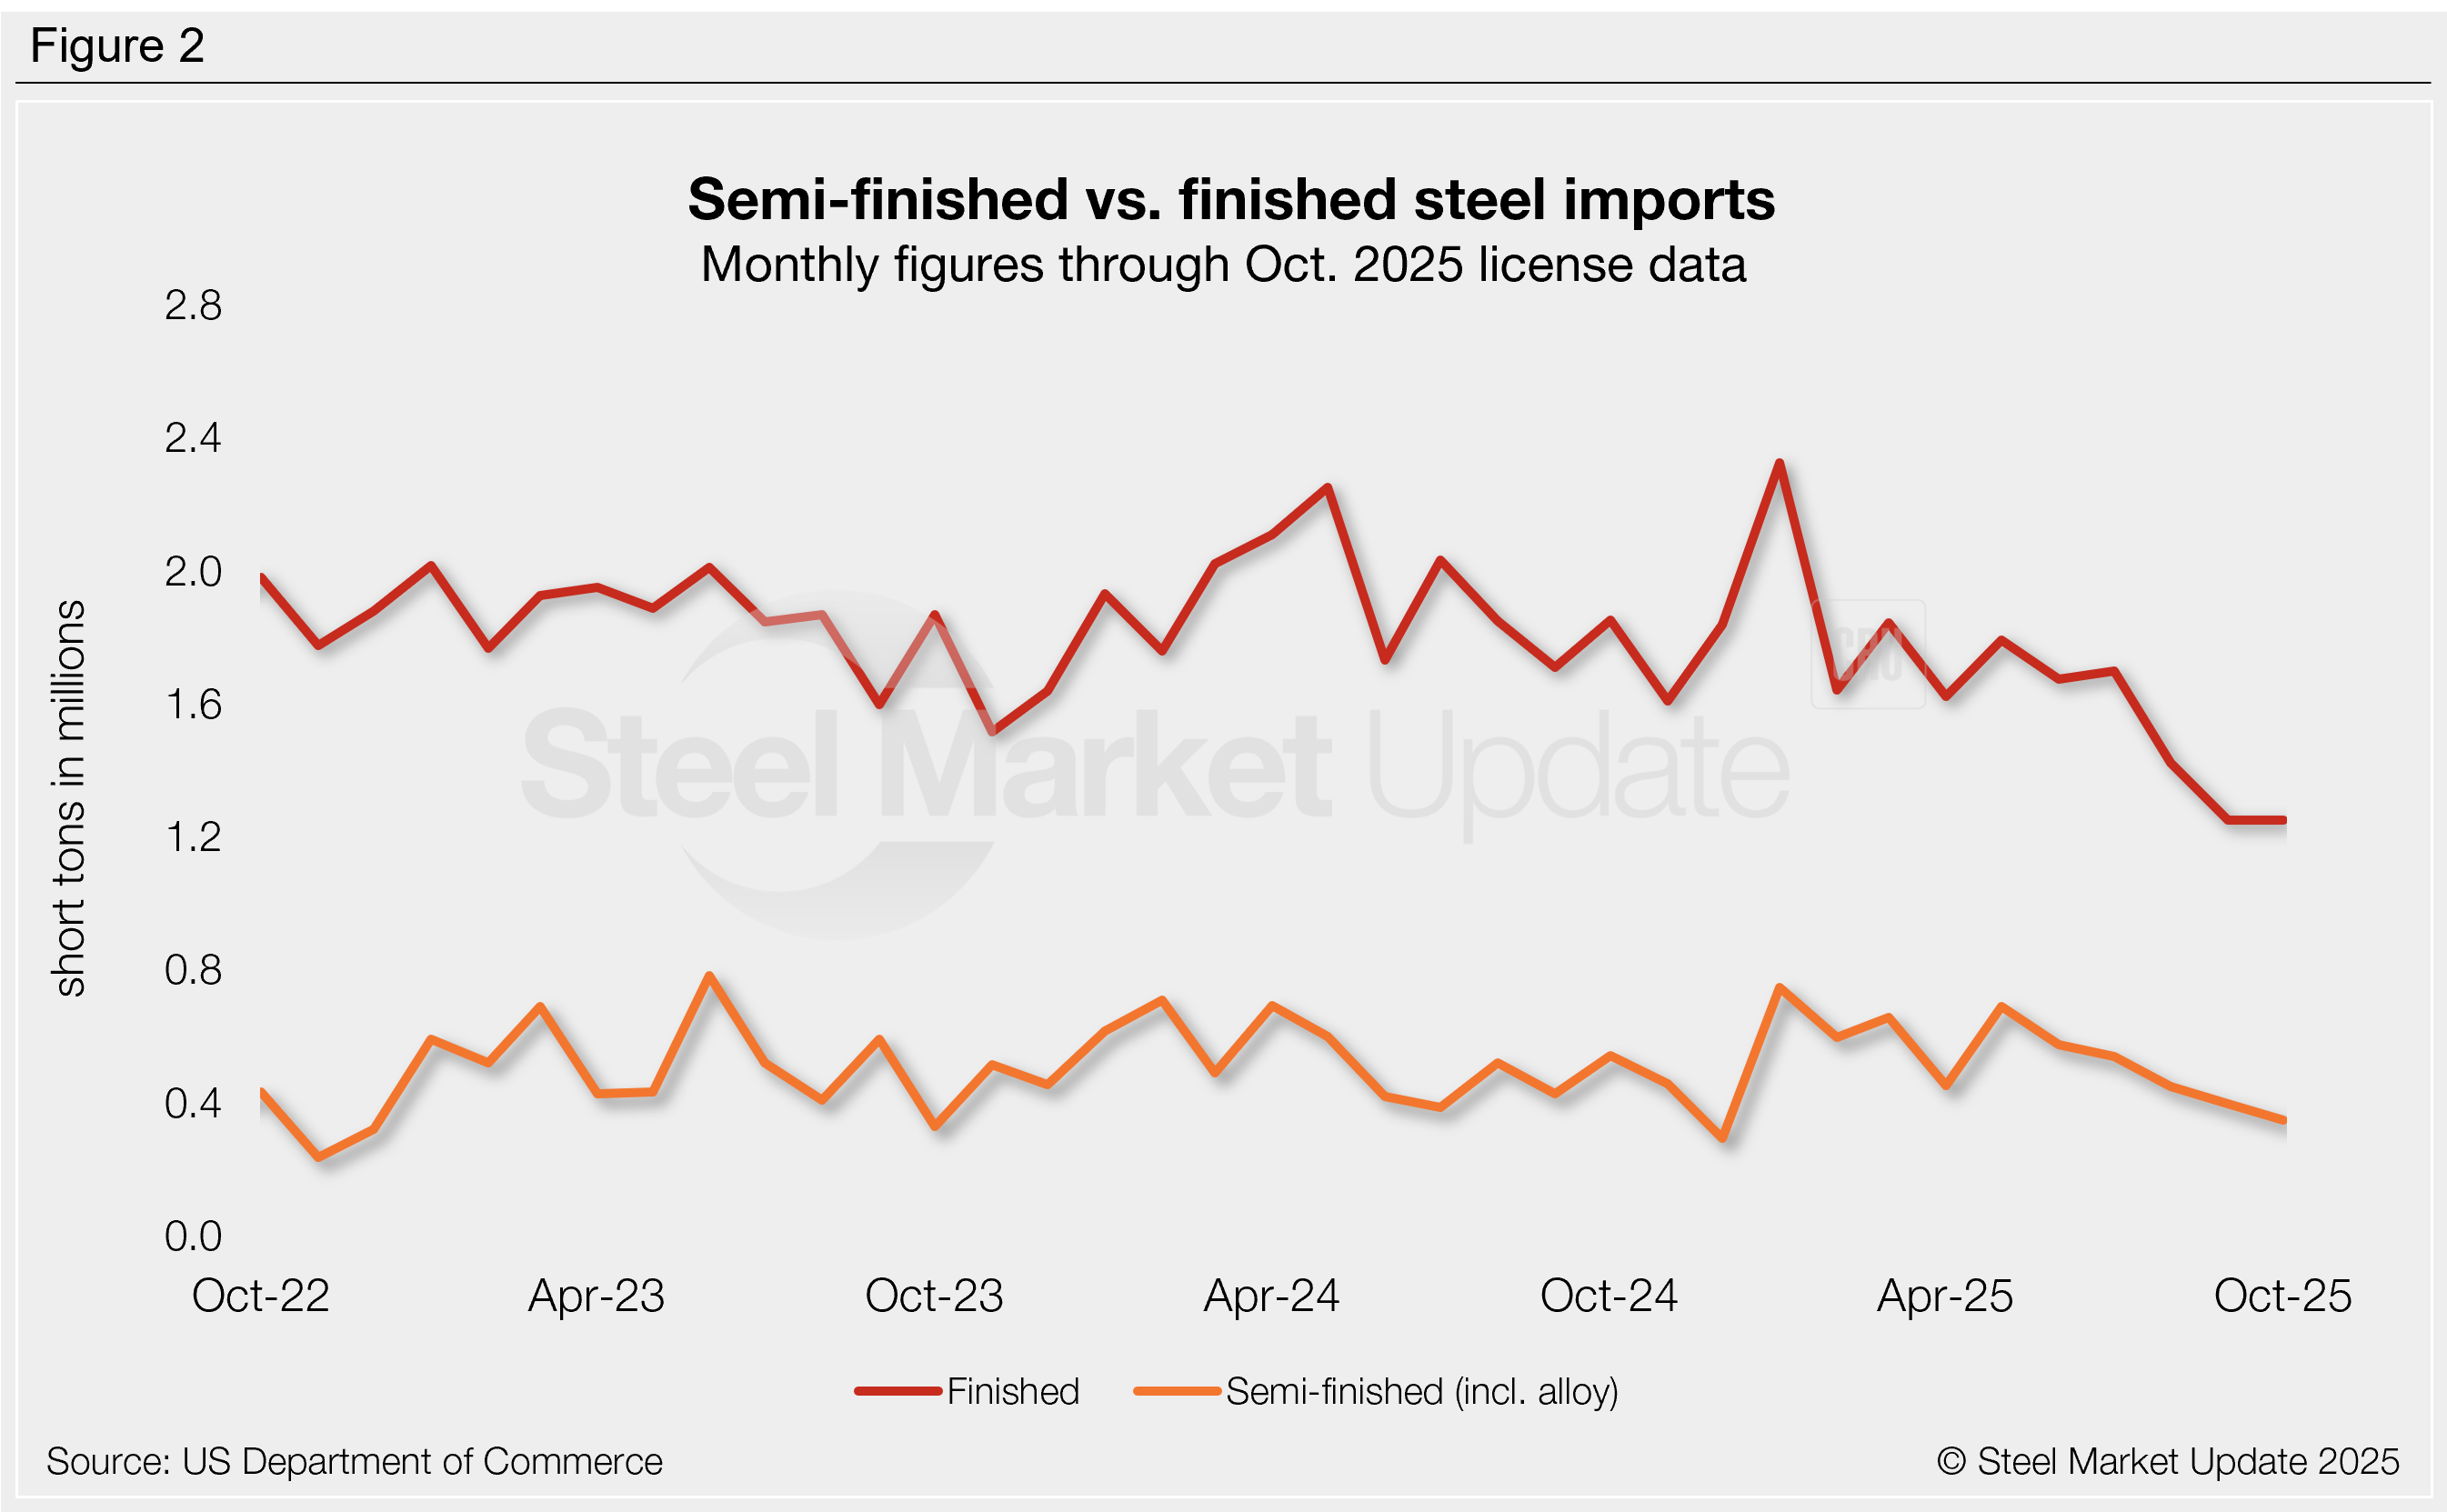
Imports of finished steel versus semi-finished products (mostly slabs to be further processed by a mill) saw similar declines in September but diverged in October. Finished imports fell 12% in September to a near-five-year low of 1.25 million st, accounting for 76% of monthly imports. October levels were flat (up less than 1%). Semi-finished imports fell 11% m/m to 399,000 st in September, the lowest rate seen this year. October saw another 12% decline to 350,000 st, a 10-month low (Figure 2).
Imports by category
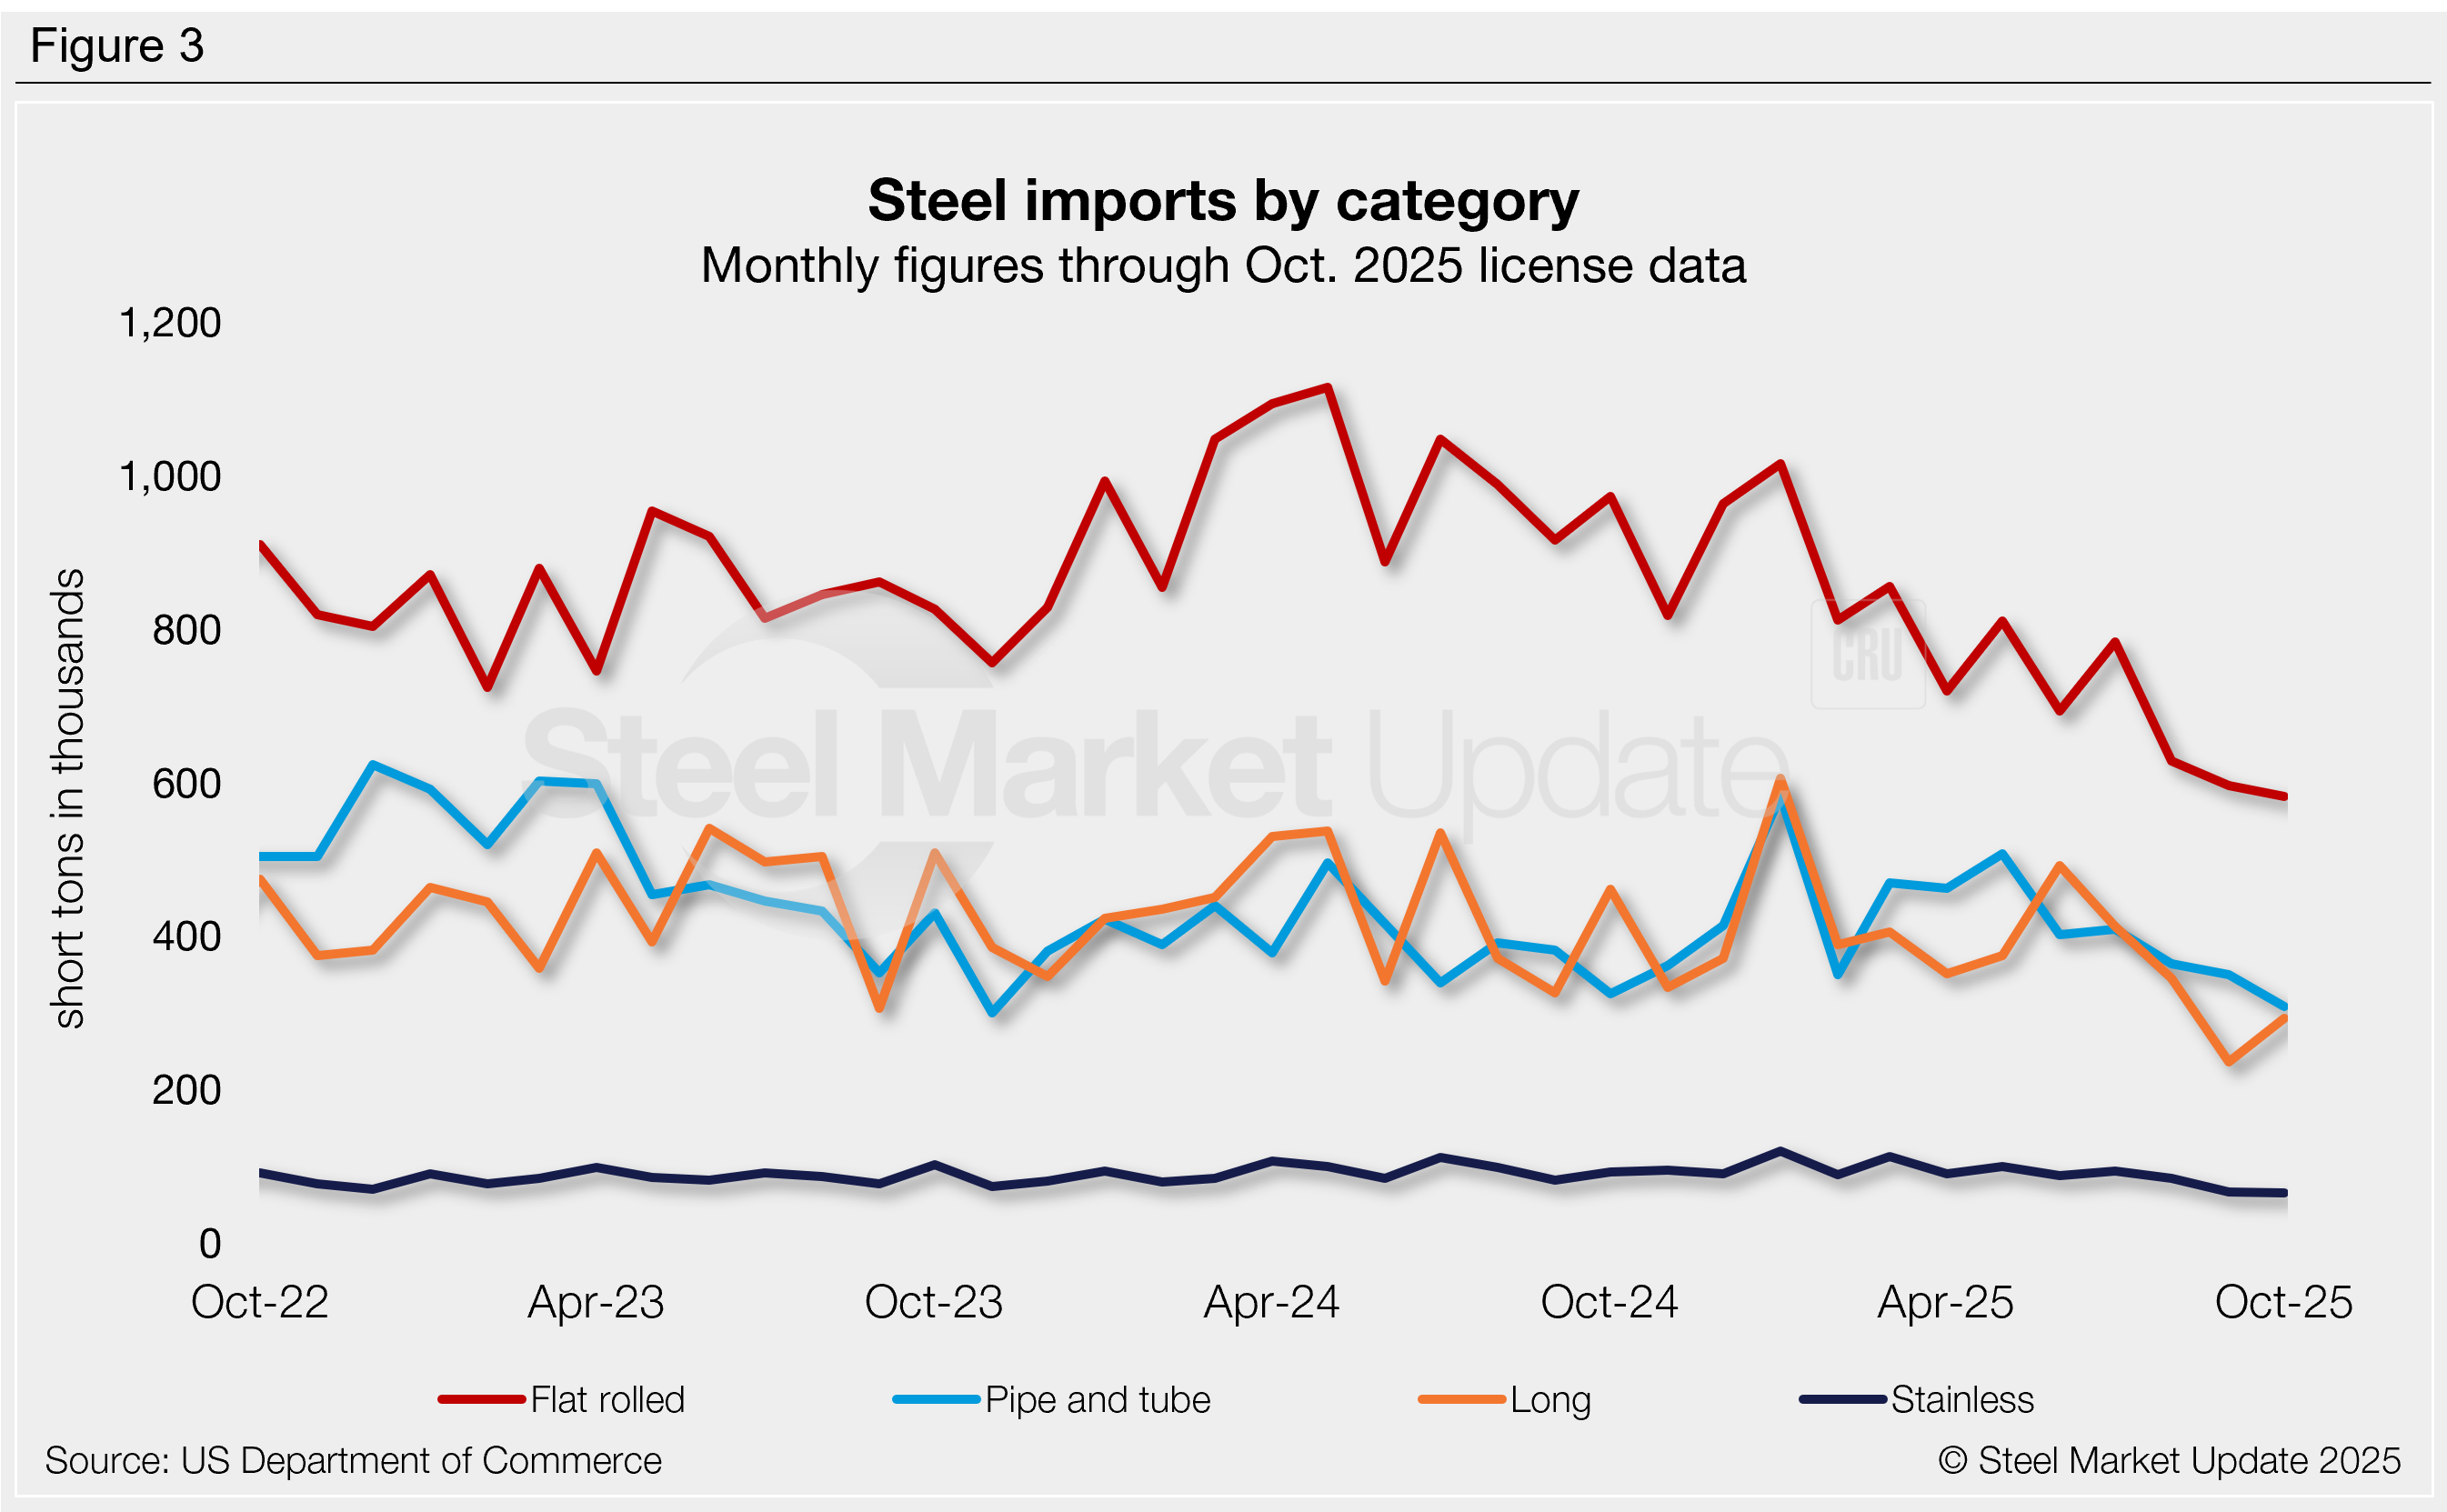
Figure 3 shows monthly imports by popular steel product categories. Notable shifts include:
- Flat-rolled imports fell 5% from August to September to the lowest monthly rate in our seven-year data history. October trade is down 2% further.
- Long products fell 31% in September to a multi-year low, but rebounded 24% in October.
- Pipe and tube fell 4% in September to an 11-month low, then declined 12% further in October to a 23-month low.
- Stainless declined 21% in September to a four-year low, then eased another 3% in October.
Flat-rolled imports
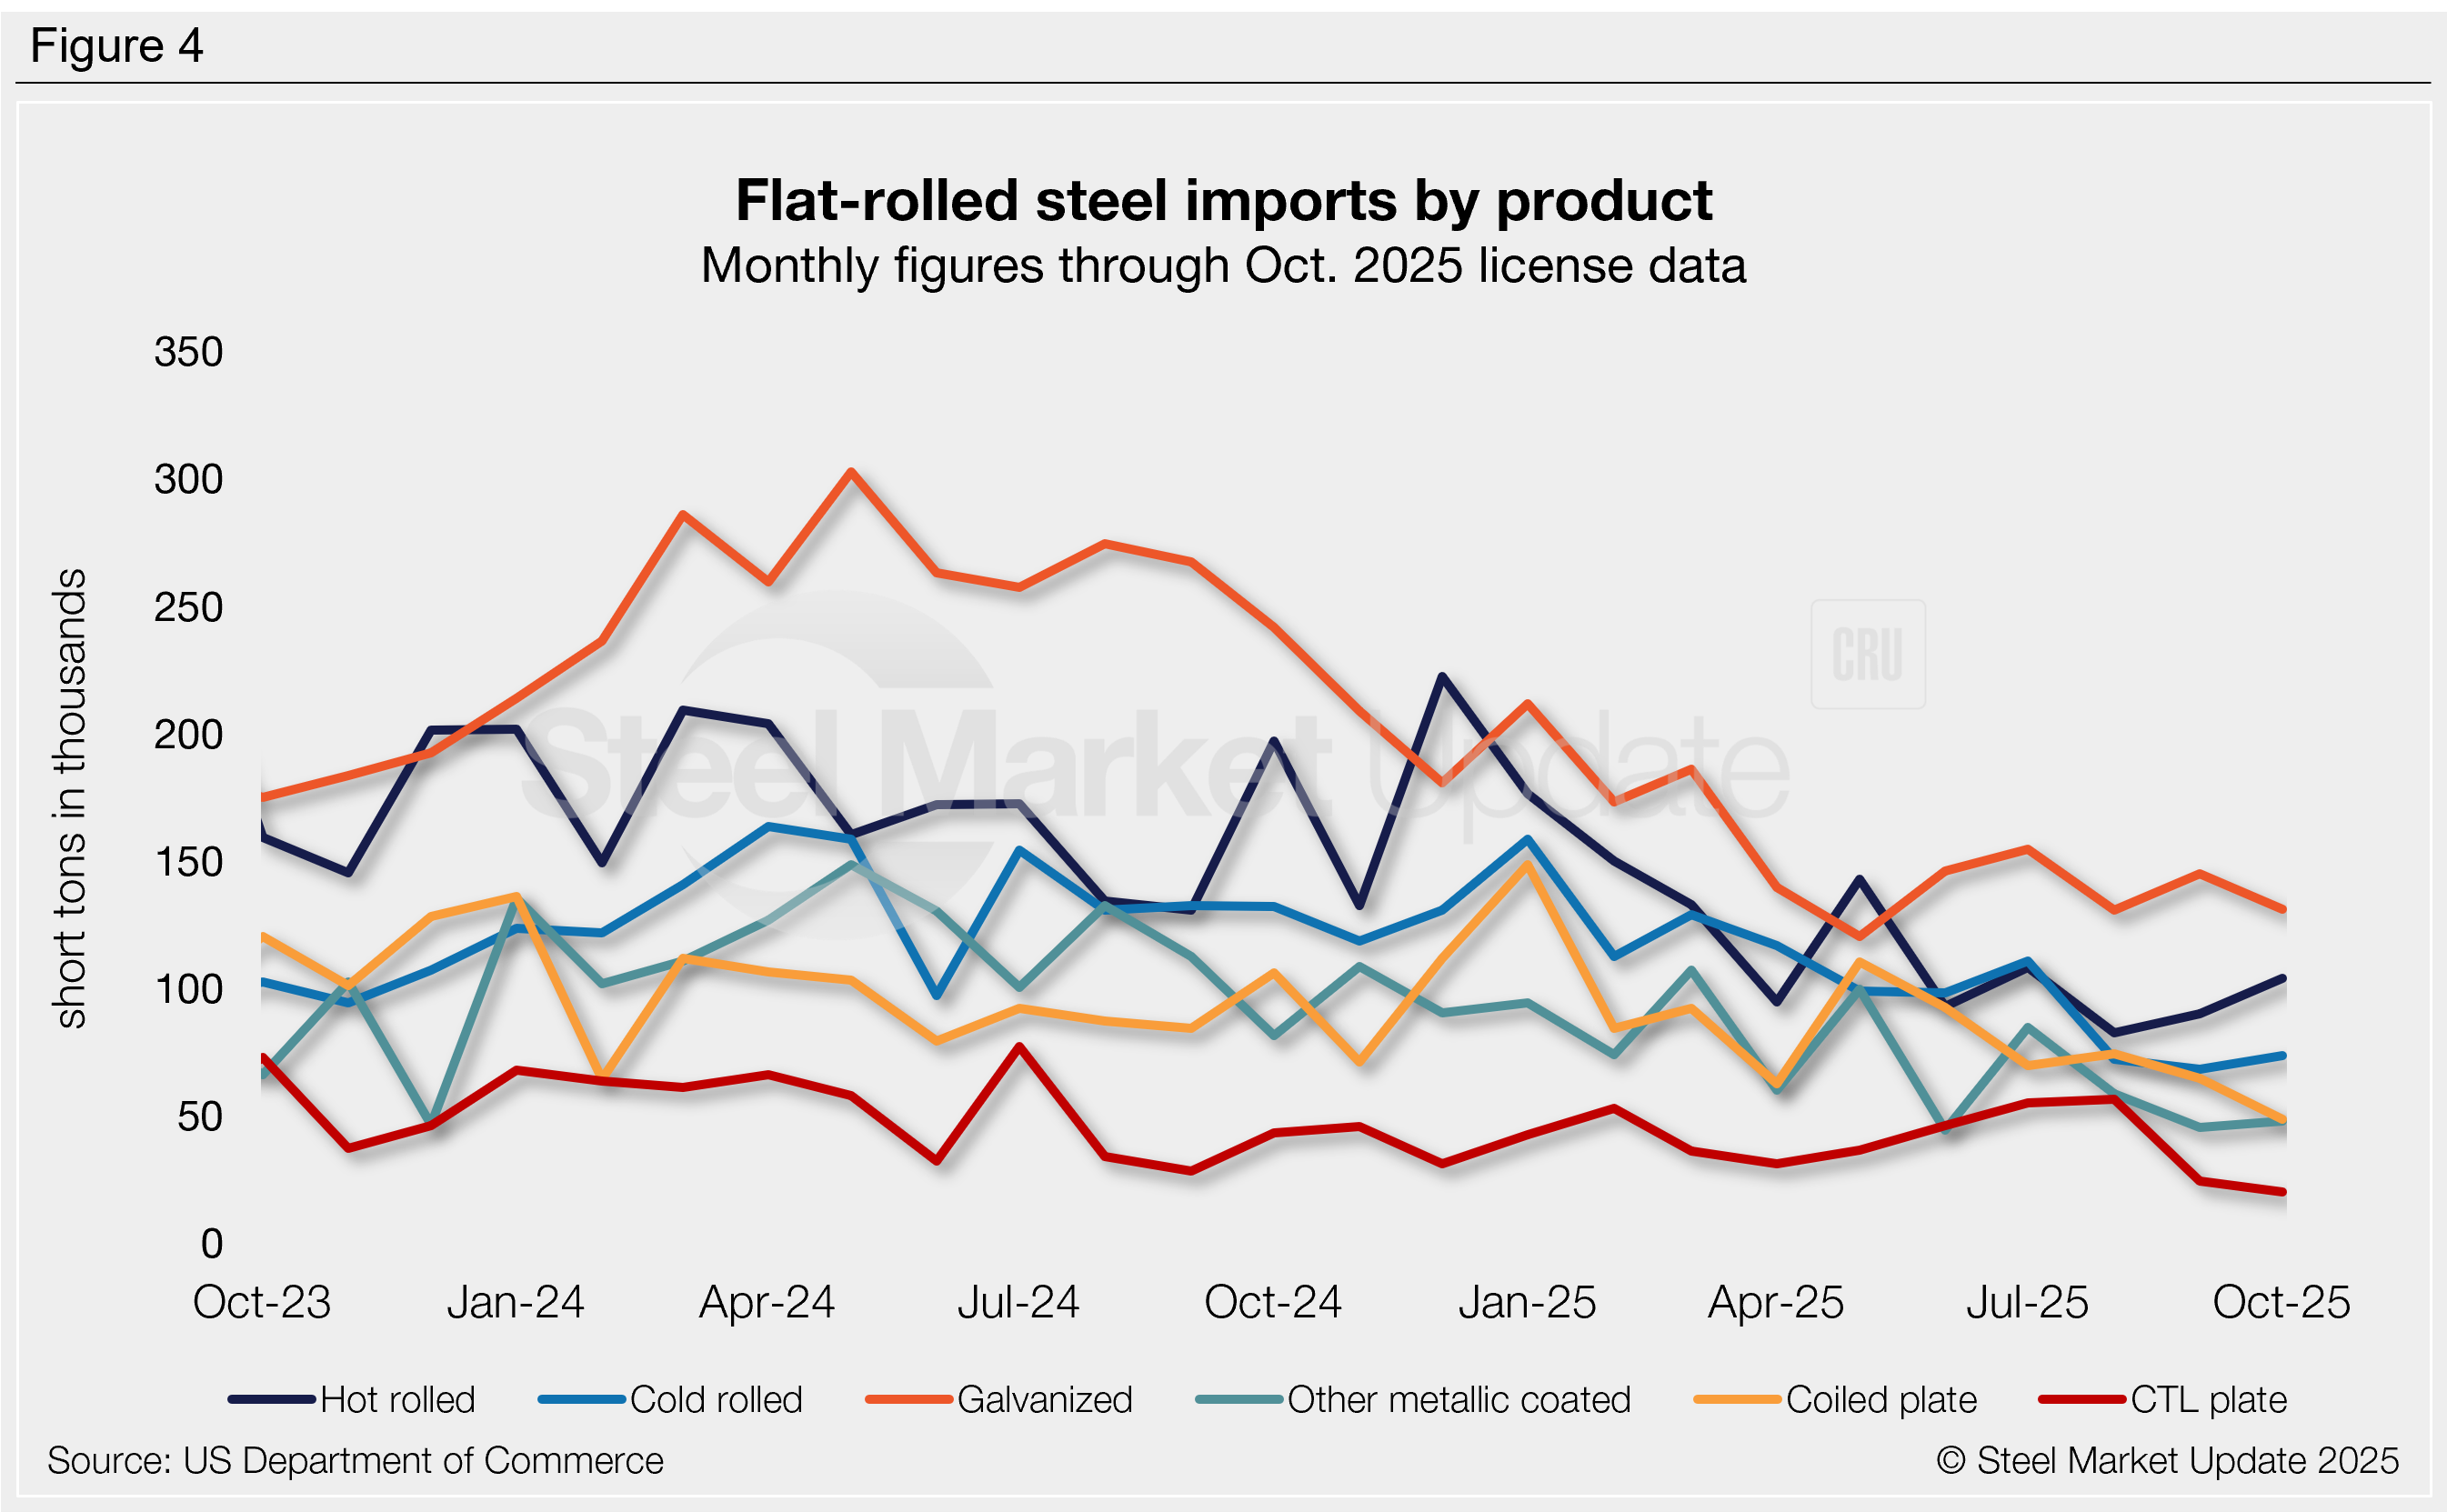
Figure 4 tracks flat-rolled imports for six popular sheet products. Most products declined from August to September aside from hot-rolled coil, galvanized, and tin plate, with many falling to multi-year lows. Movement was mixed through October. Key highlights:
- Hot-rolled coil imports rose 9% m/m in September following the 27-year low set in August. October trade is up another 15%.
- Cold-rolled coil fell 6% in September to the lowest level since January 2021, then recovered 8% in October.
- Galvanized sheet recovered 11% in September but fell back down 10% in October.
- Other-metallic coated (mostly Galvalume) slipped 23% in September, marginally higher than the near-three-year low set in April. October licenses are back up 6%.
- Coiled plate fell 13% in September and another 25% in October, reaching the lowest level since August 2020.
- CTL plate tumbled 57% in September to a four-year low, then eased 4% in October to a near six-year low.
- Tin plate jumped 13% in September. Those gains were erased in October, with imports down 25% to a nine-month low.