Canada
December 12, 2025
Steel imports historically weak through November license data
Written by Brett Linton
US steel imports tumbled to a near five-year low in September, according to recently finalized US Commerce Department data. The latest license figures suggest that trade has held near that low in October and November.
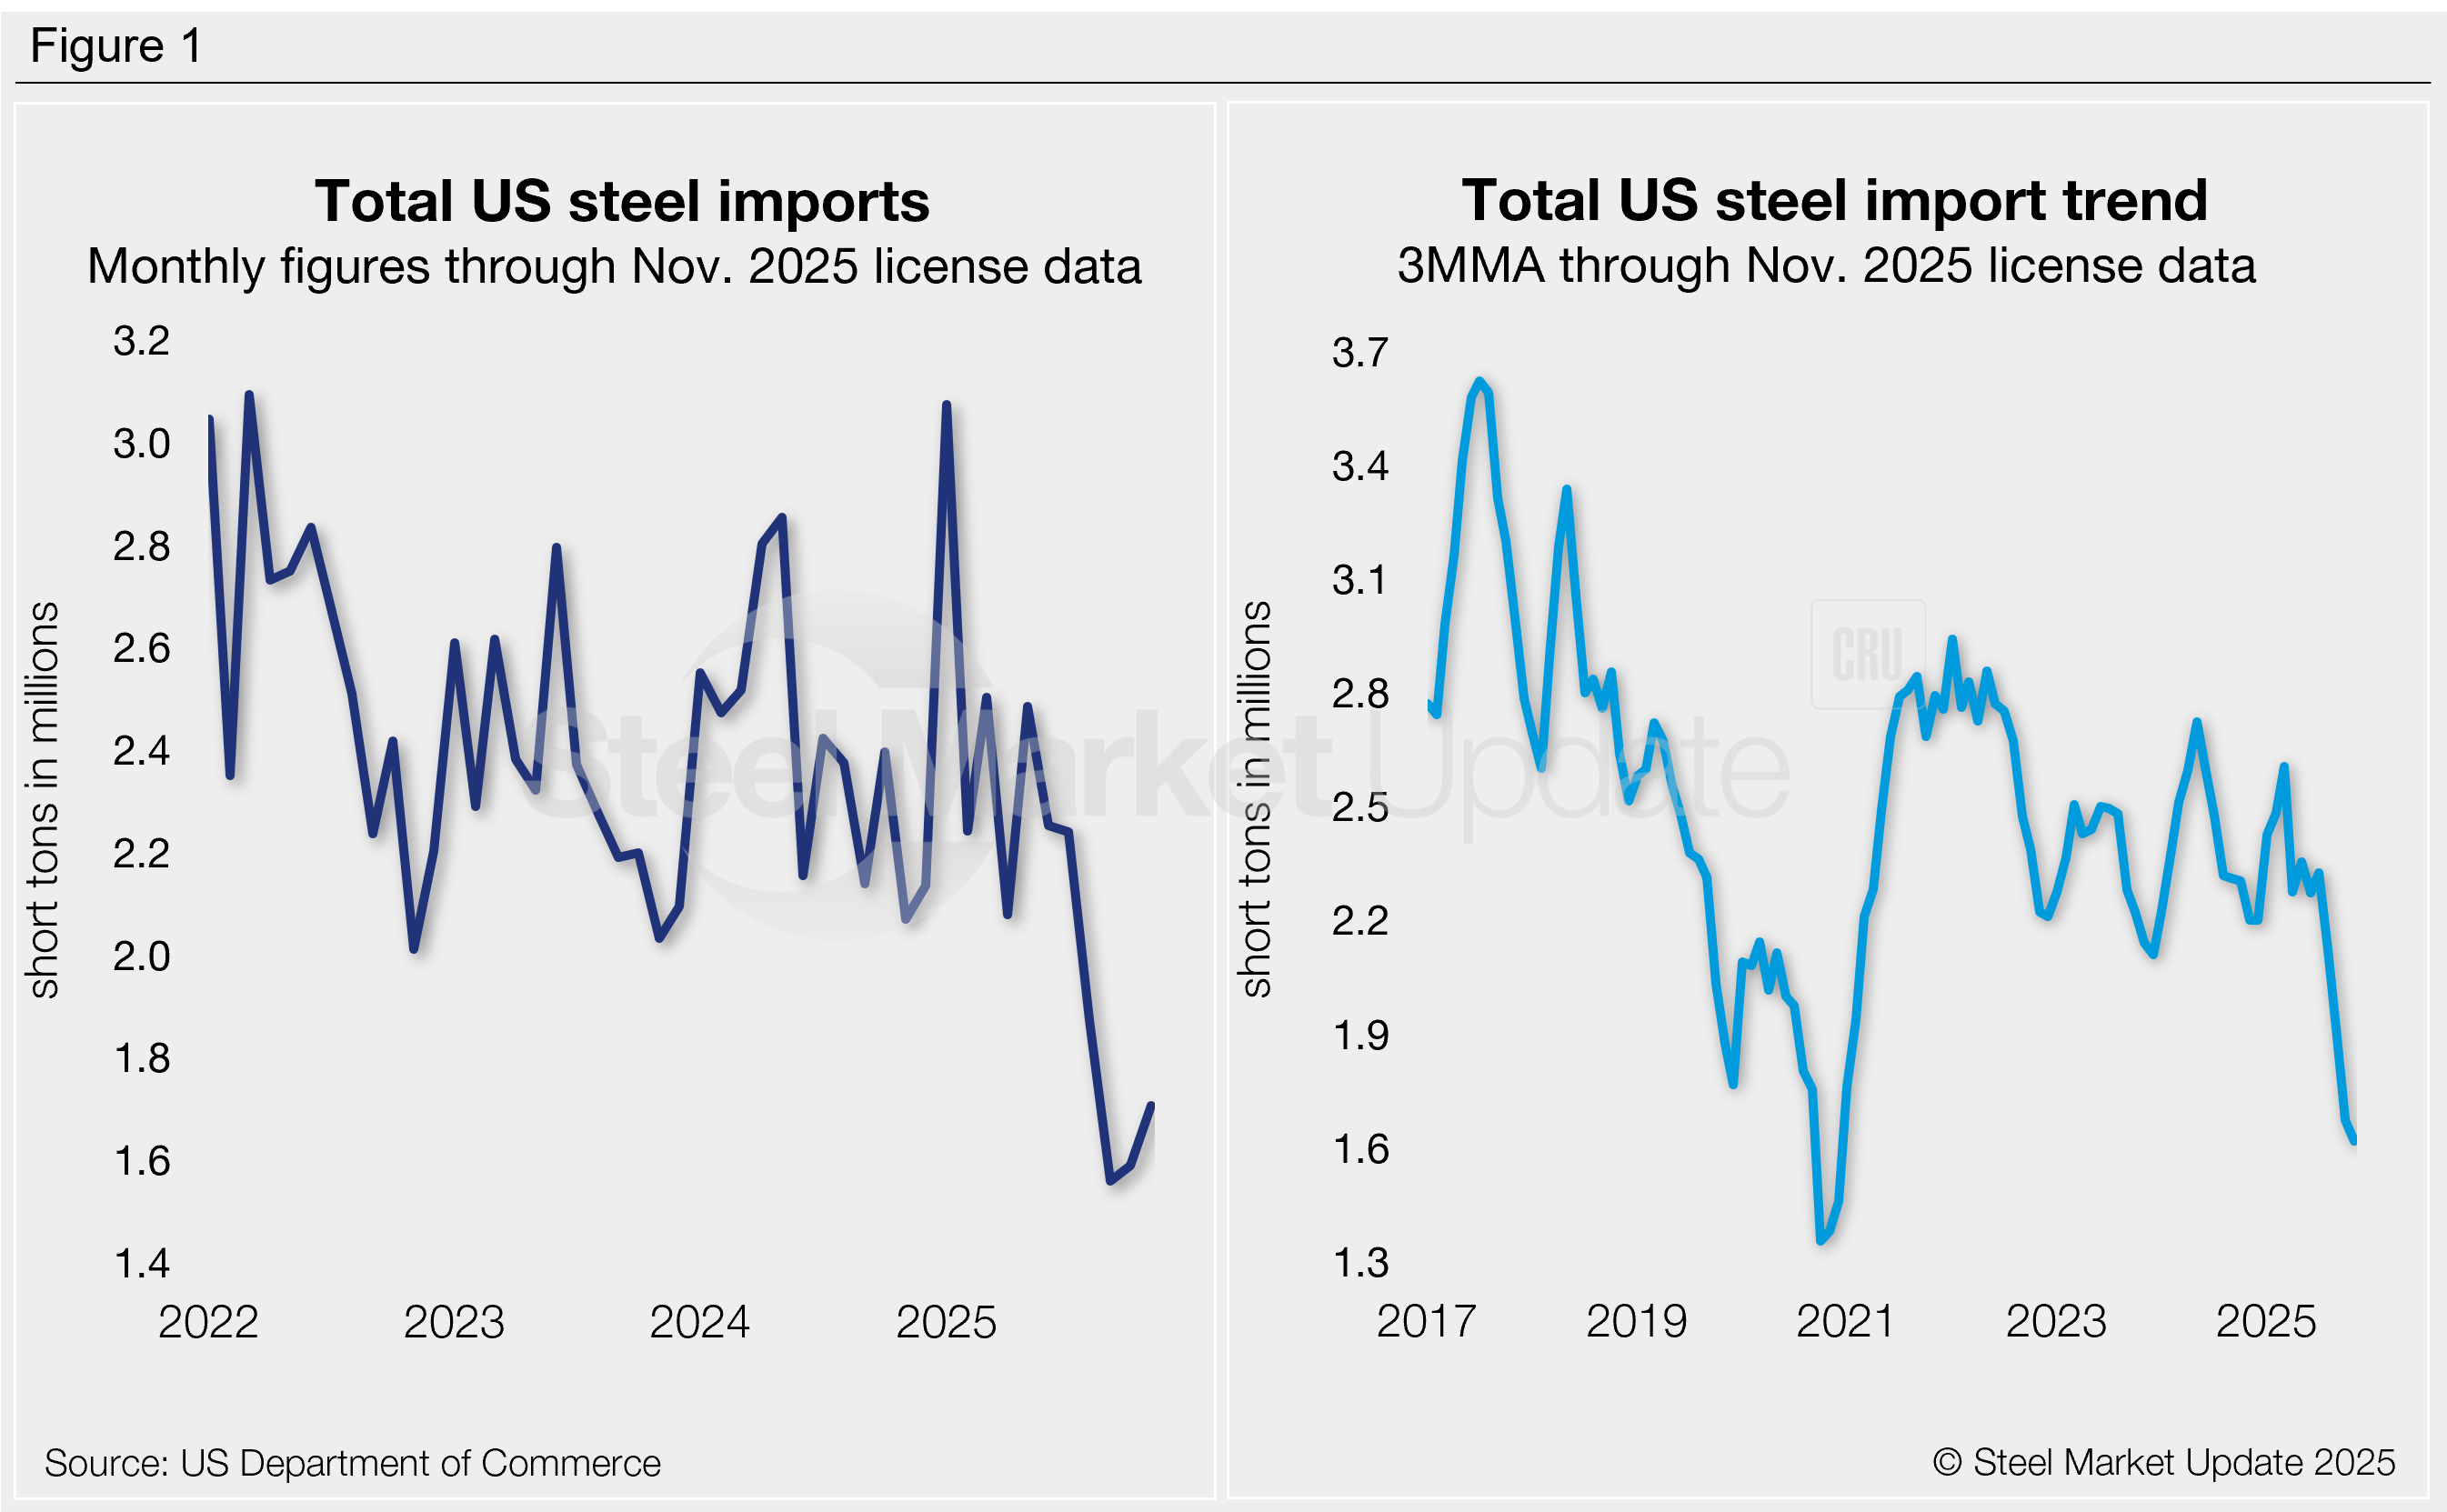
The total volume of steel products that entered the country in September fell to 1.56 million short tons (st), the lowest monthly rate witnessed since December 2020. The latest license data shows 1.59 million st of material was imported in October and 1.71 million st in November, the second and third-lowest monthly totals recorded since 2020.
Recall that imports spiked to a two-and-a-half-year high of 3.08 million st in January. Trade balanced out for the remaining first half of the year and then significantly slowed after July (Figure 1, left).
Two-thirds of the steel that entered the country in September came from just six countries: Canada (20%), South Korea (16%), Brazil (11%), Mexico (9%), Germany (6%), and Japan (6%). Other major suppliers included Vietnam, Argentina, Taiwan, India, the United Kingdom, the Netherlands, China, Italy, and the United Arab Emirates – each contributing 2-4% of the total. Combined, these 15 countries accounted for 89% of all September imports.
To explore steel import data by country, category, or specific product, visit the International Trade Administration’s Steel Import Monitor.
Import trends
To better highlight trends, import data can be analyzed as a three-month moving average (3MMA) to smooth out monthly variations (Figure 1, right). On this basis, 3MMA imports have trended lower following the 10-month high reached in March (2.61 million st). The 3MMA fell to 1.89 million st in September, the lowest rate seen since January 2021. Looking through October and November license data, it has fallen even further and currently stands at 1.62 million st for November. For comparison, imports averaged 2.41 million st per month in 2024 and 2.35 million st per month in 2023.
Imports by product
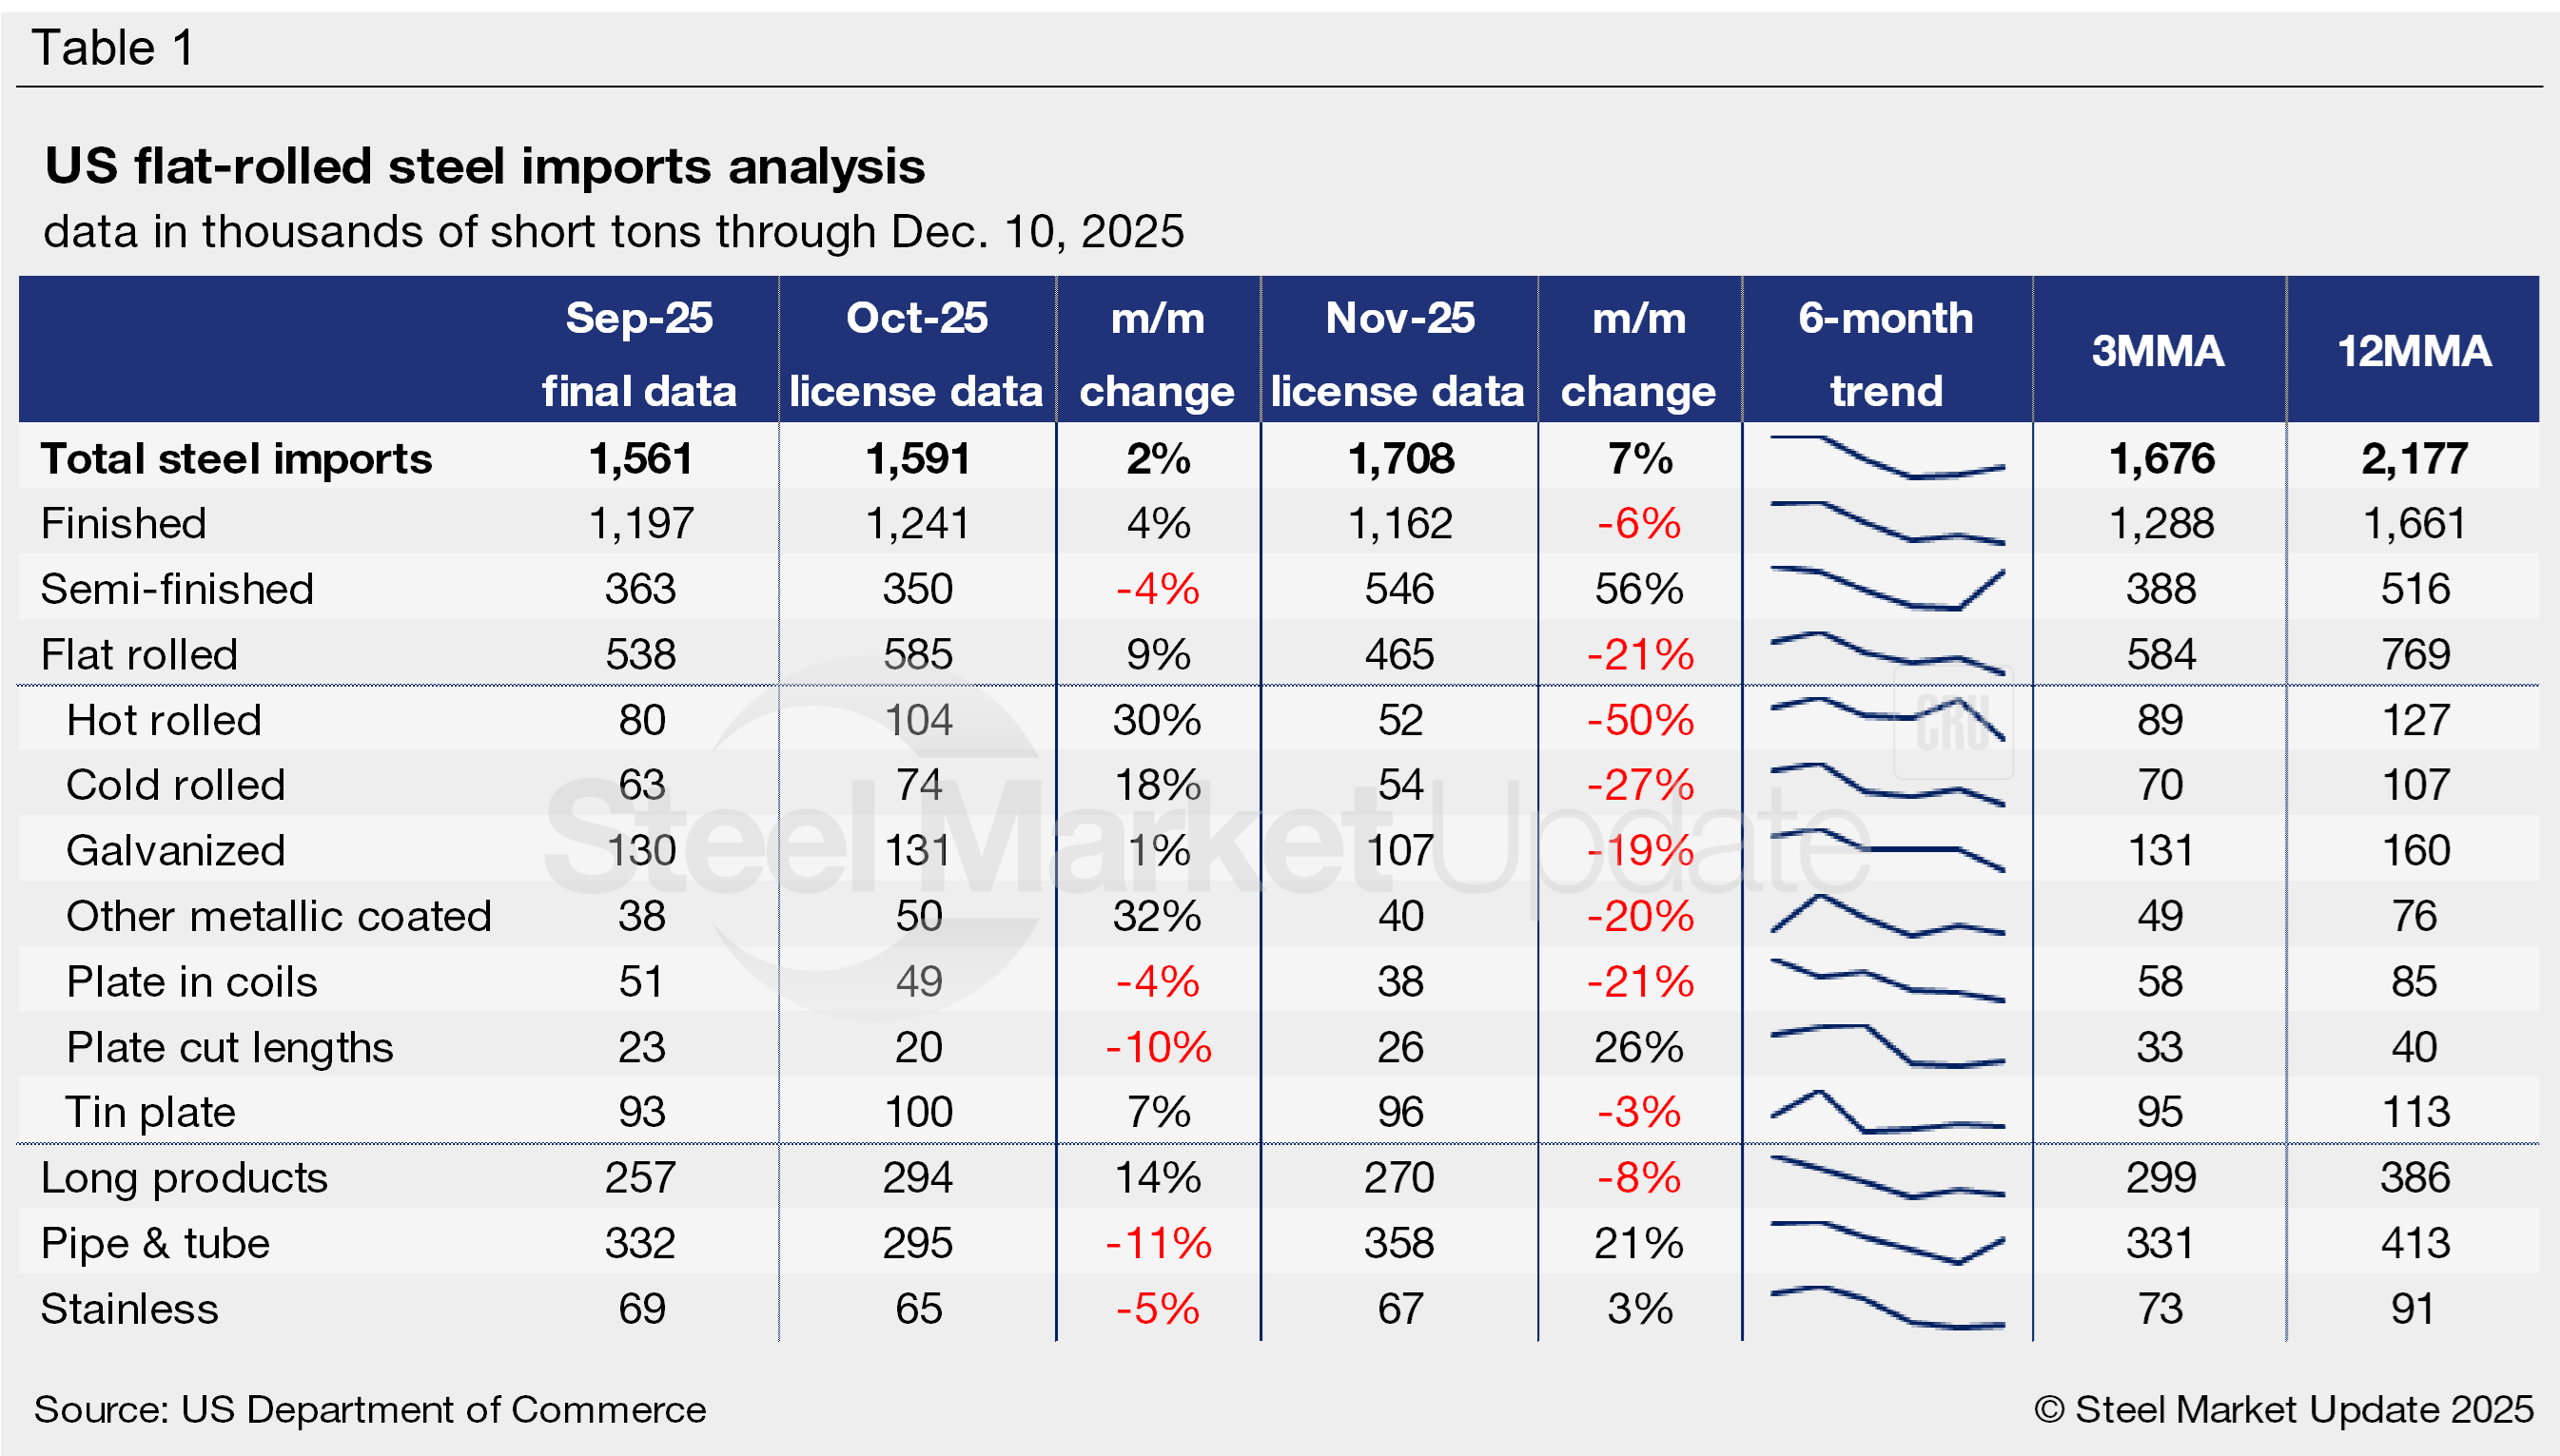
Table 1 highlights high-volume steel product imports (click to expand). Note that the 3MMA and 12MMA columns are calculated through final September data. For deeper analysis, visit our Steel Imports page.
Finished vs. semi-finished imports
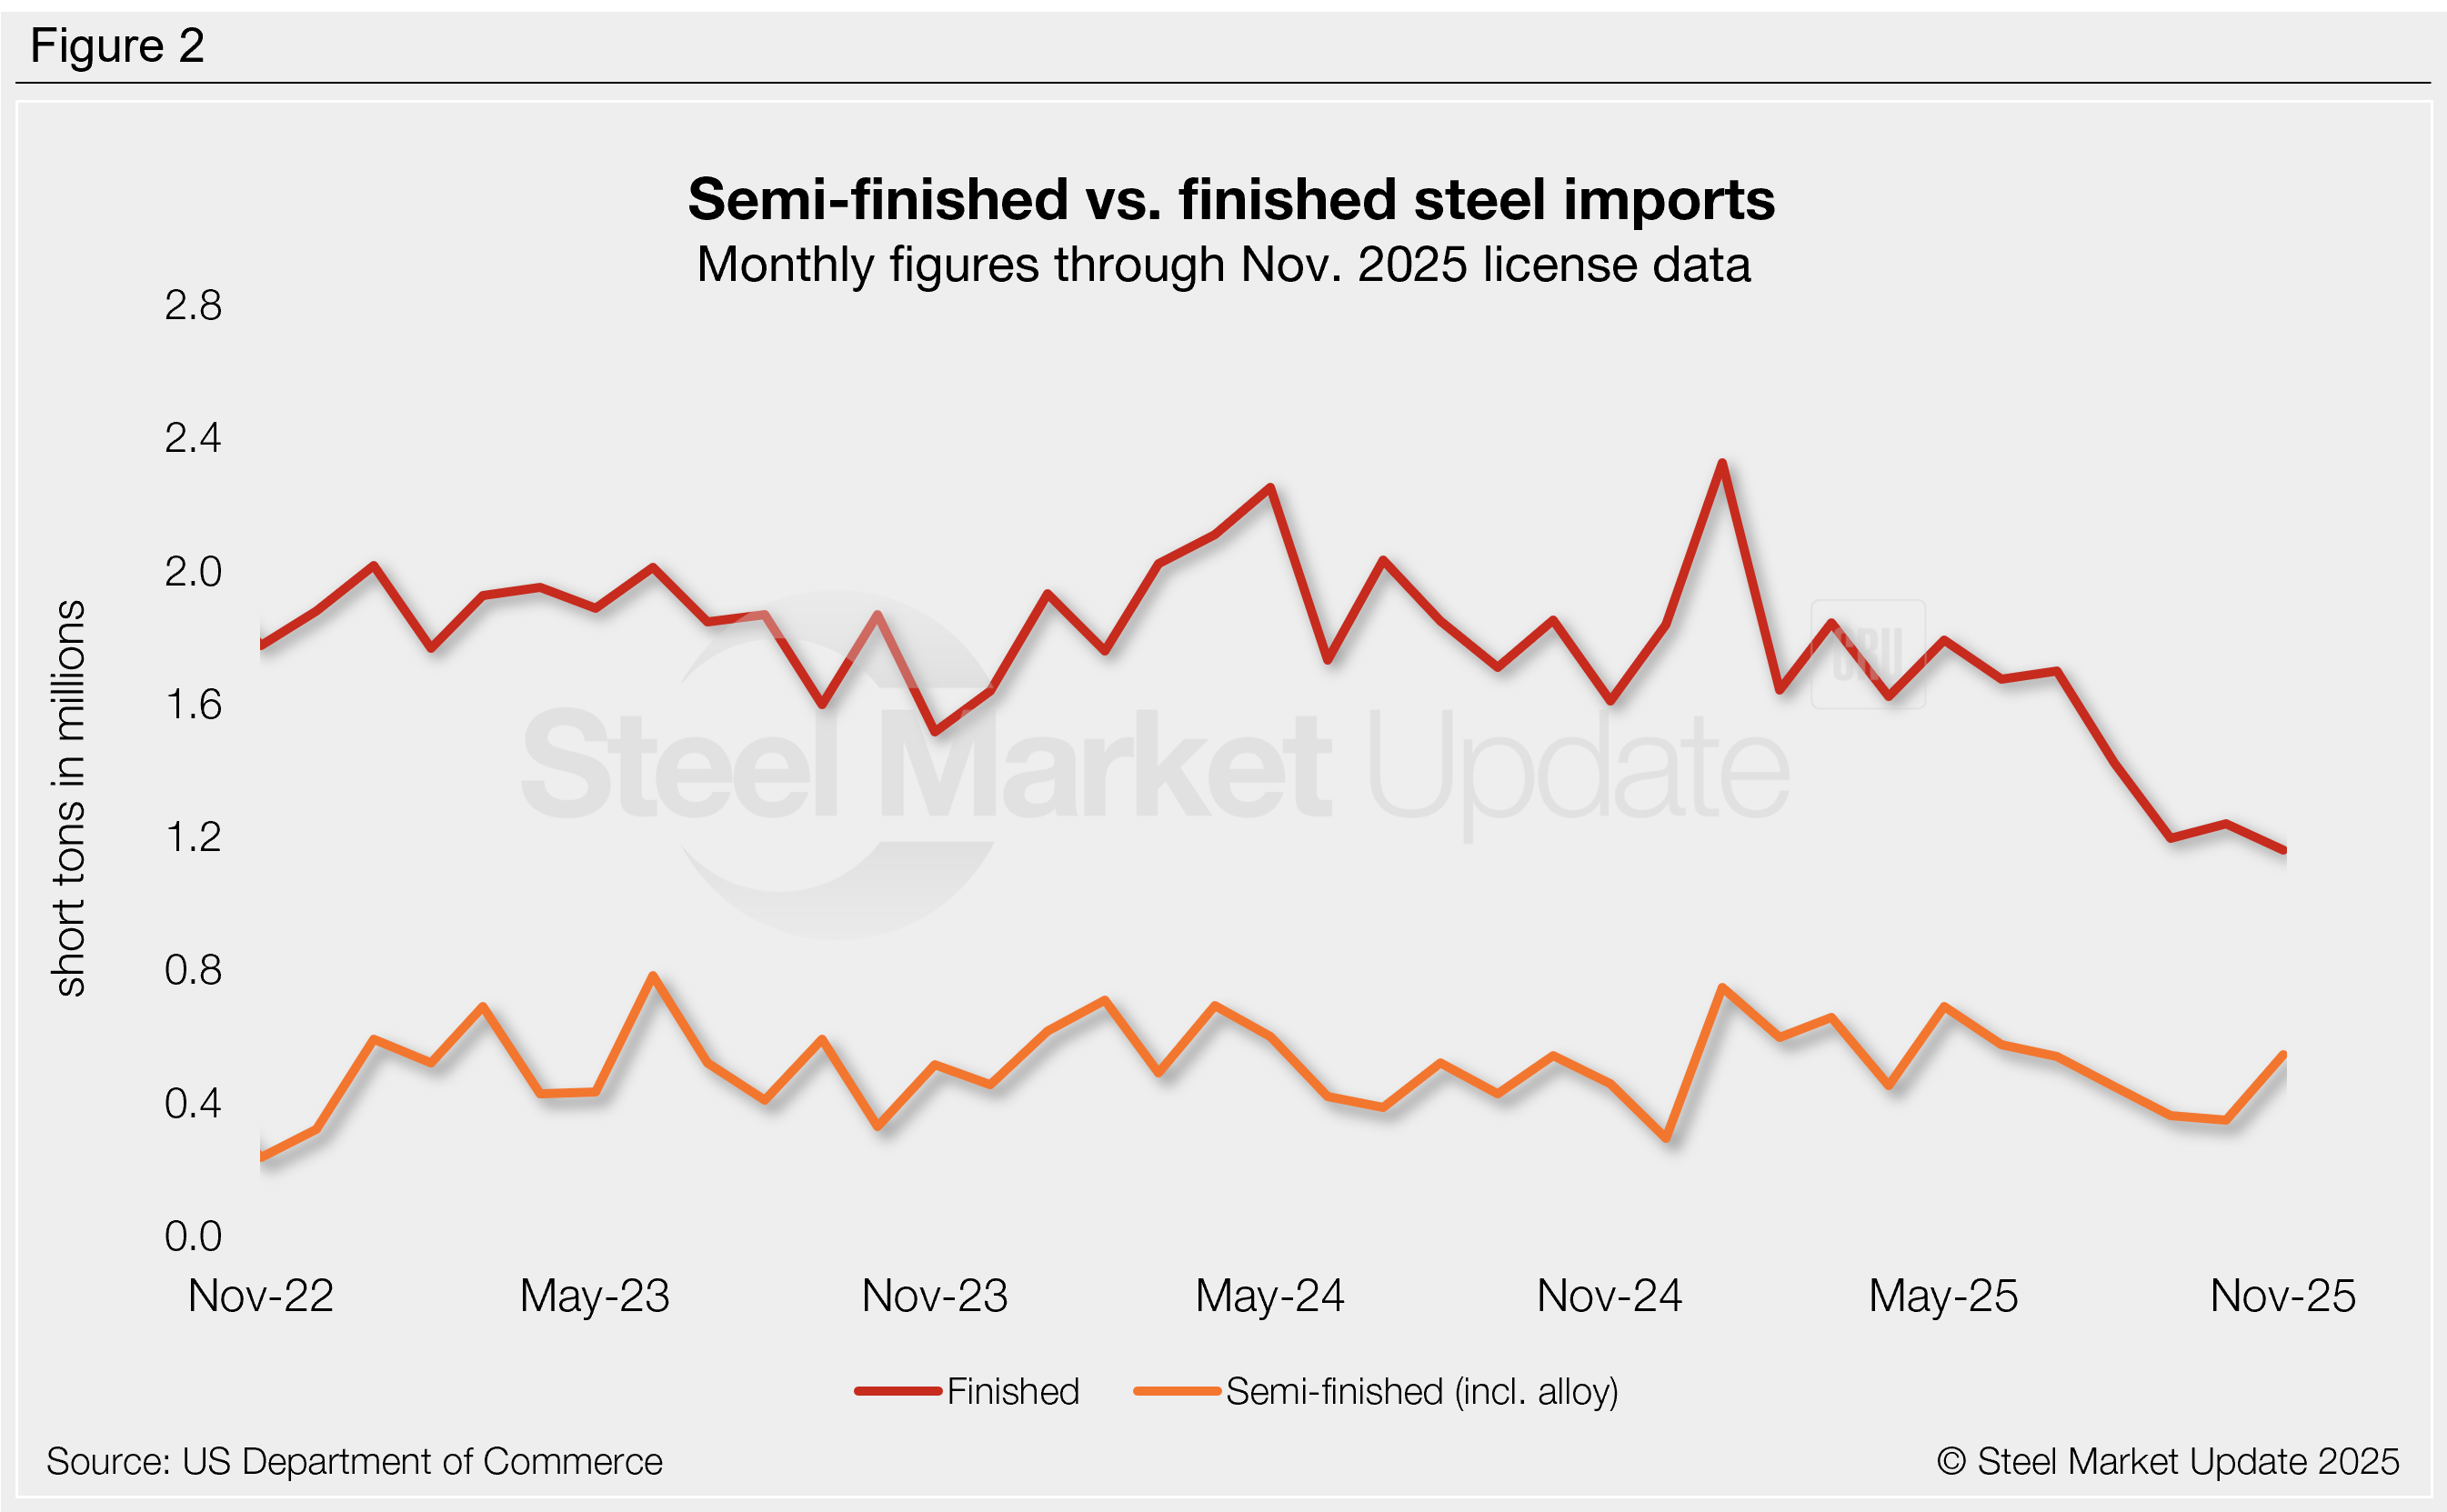
Imports of finished steel versus semi-finished products (mostly slabs to be further processed by a mill) saw similar declines from August to September but diverged in October and November.
Finished imports fell to a five-year low of 1.20 million st in September, accounting for 77% of total monthly imports. October license data is marginally higher (up 4%), but those gains appear to have been erased in November (down 6%). The current November rate of 1.16 million st is potentially the lowest monthly finished import rate on record since December 2009. Almost 16 years ago! (It would also account for 68% of total monthly imports, one of the lowest percentages seen in five years.)
Semi-finished imports fell 19% m/m to 363,000 st in September, the lowest rate seen this year. October licenses are down another 4% to 350,000 st, while November shows a potential 56% recovery to 546,000 st (Figure 2).
Imports by category
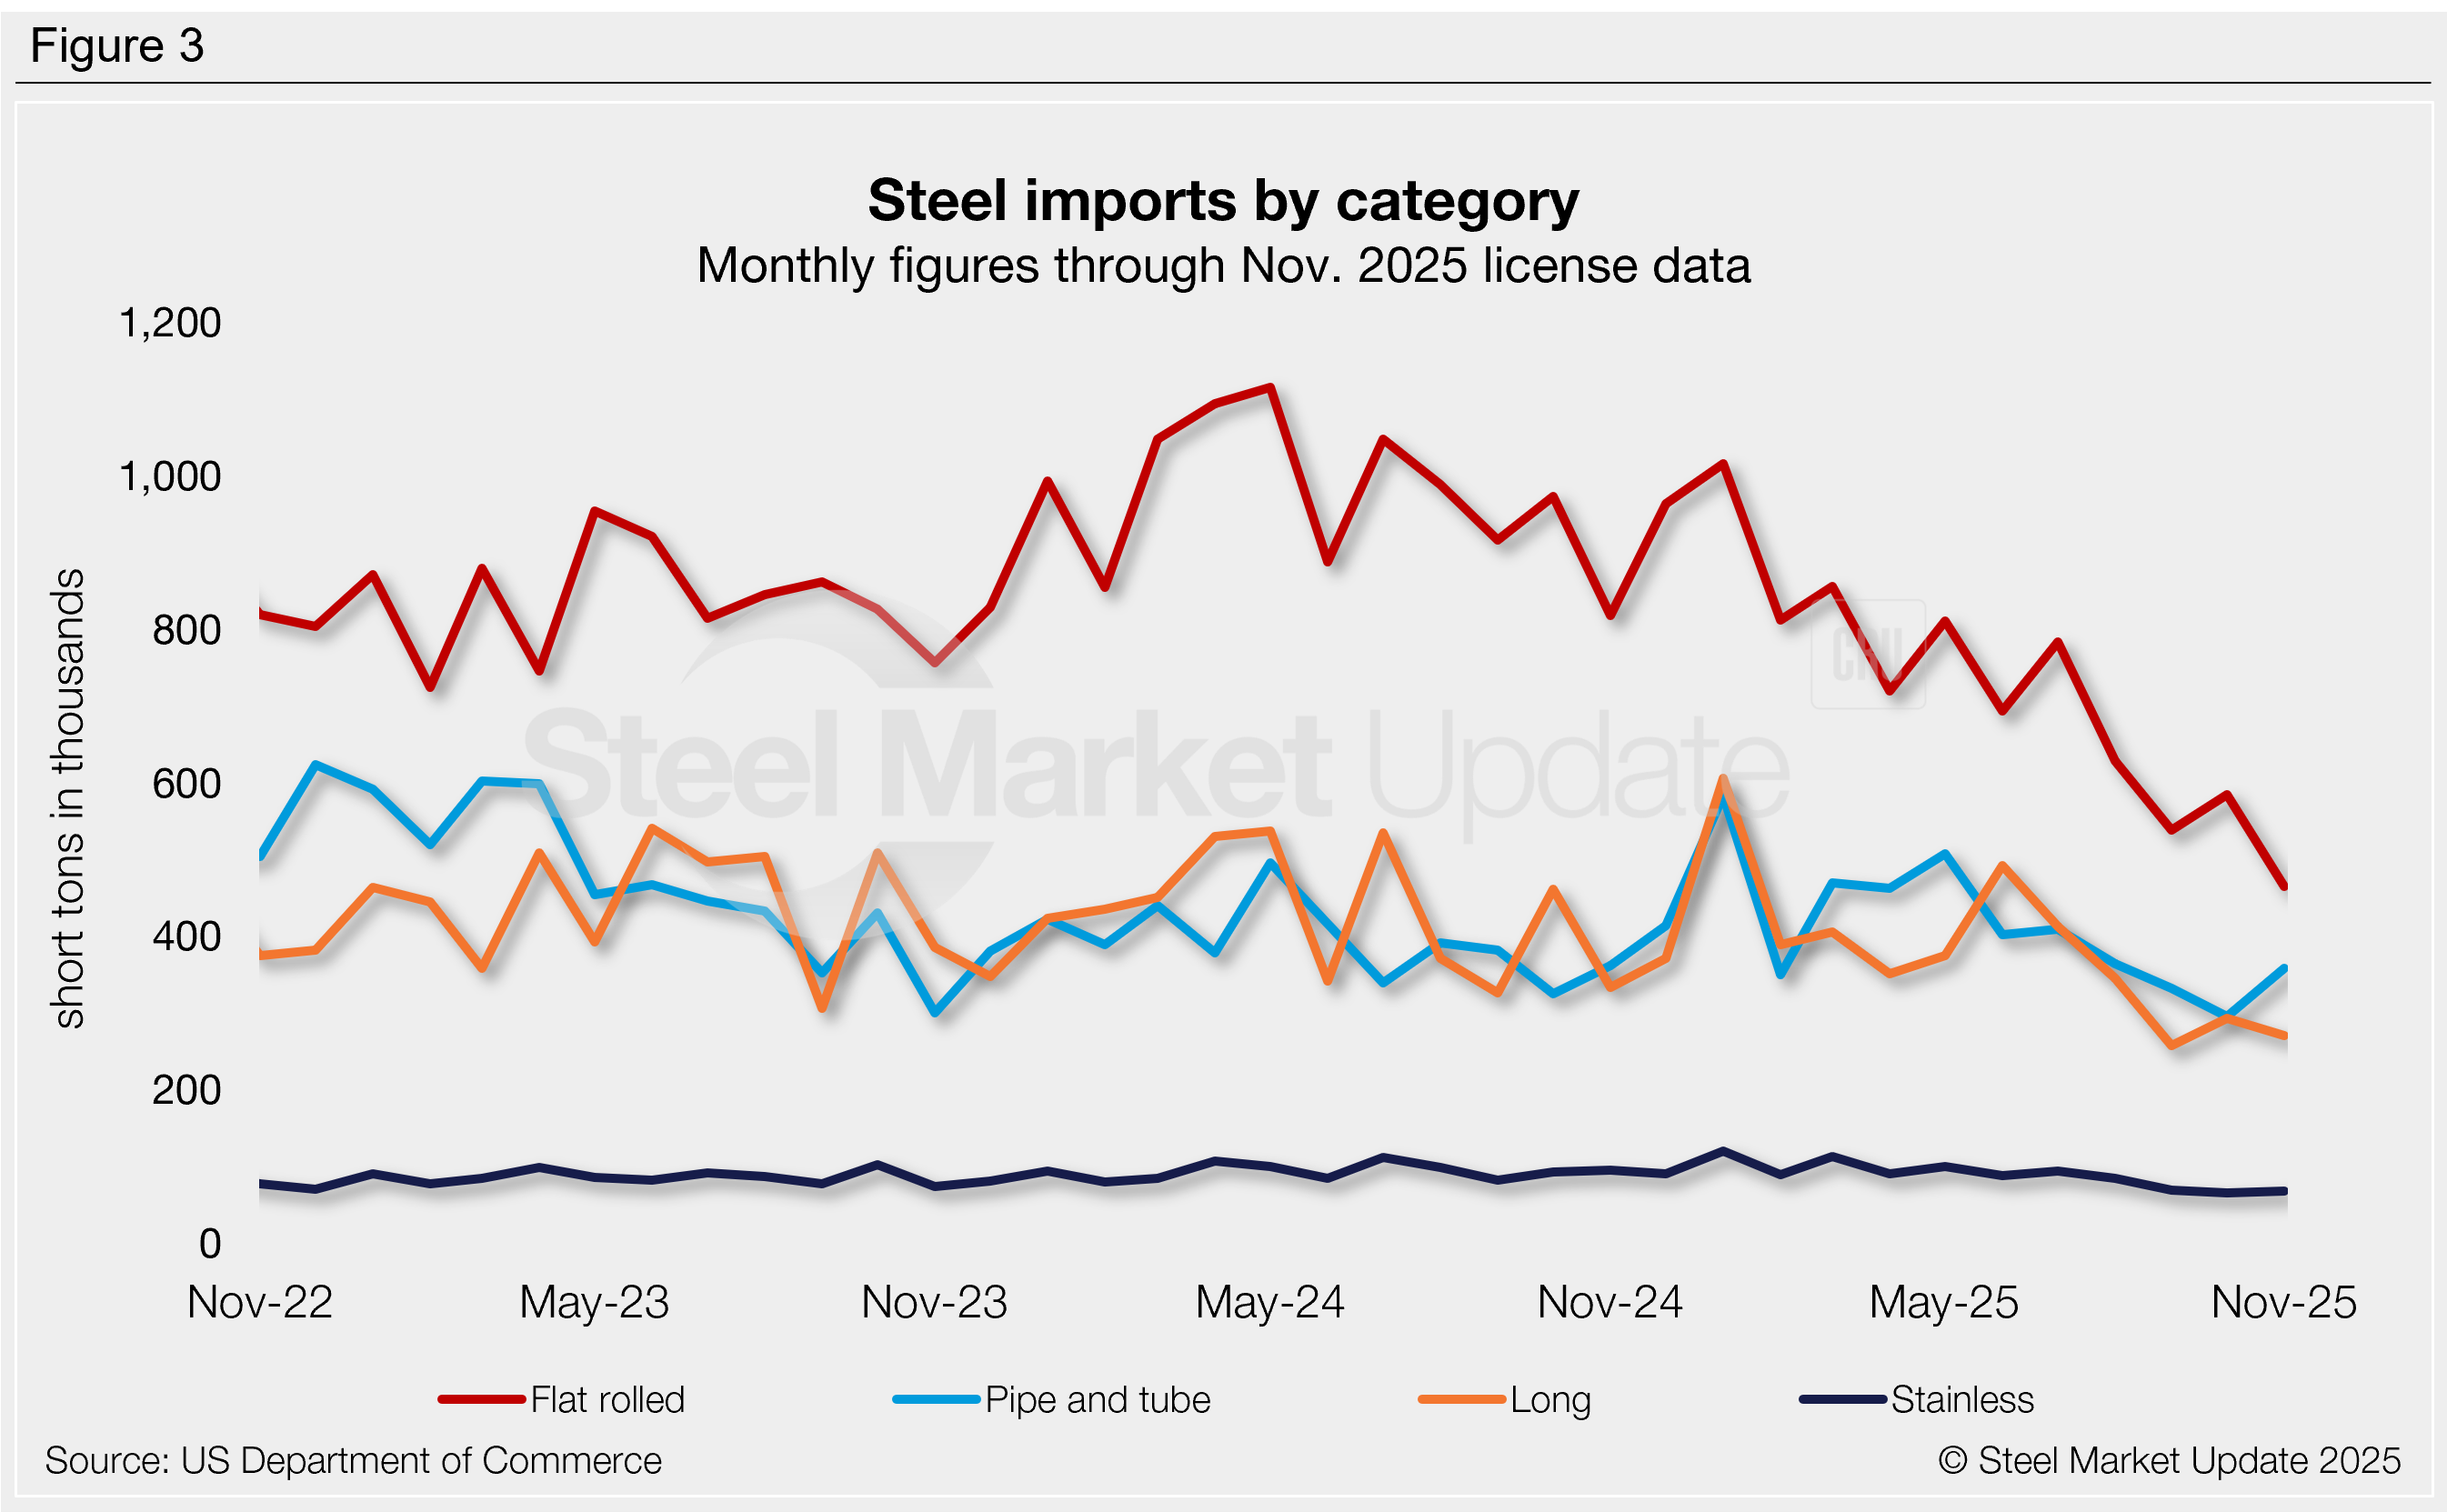
Figure 3 shows monthly imports by popular steel product categories. Notable shifts include:
- Flat-rolled imports fell 14% m/m from August to September to the lowest rate recorded in our seven-year data history. October licenses are currently back up 9%. But November licenses are down 21%, potentially a new historical low.
- Long products fell 25% m/m from August to September to a five-year low. Trade potentially rebounded 14% in October then eased 8% in November.
- Pipe and tube imports fell 9% m/m in September to an 11-month low, then declined another 11% further in October to a potential five-year low. November licenses are back up 21%.
- Stainless declined 18% from August to September to a four-year low, then eased another 5% in October to a potential five-year low. November licenses are currently up 3%.
Flat-rolled imports
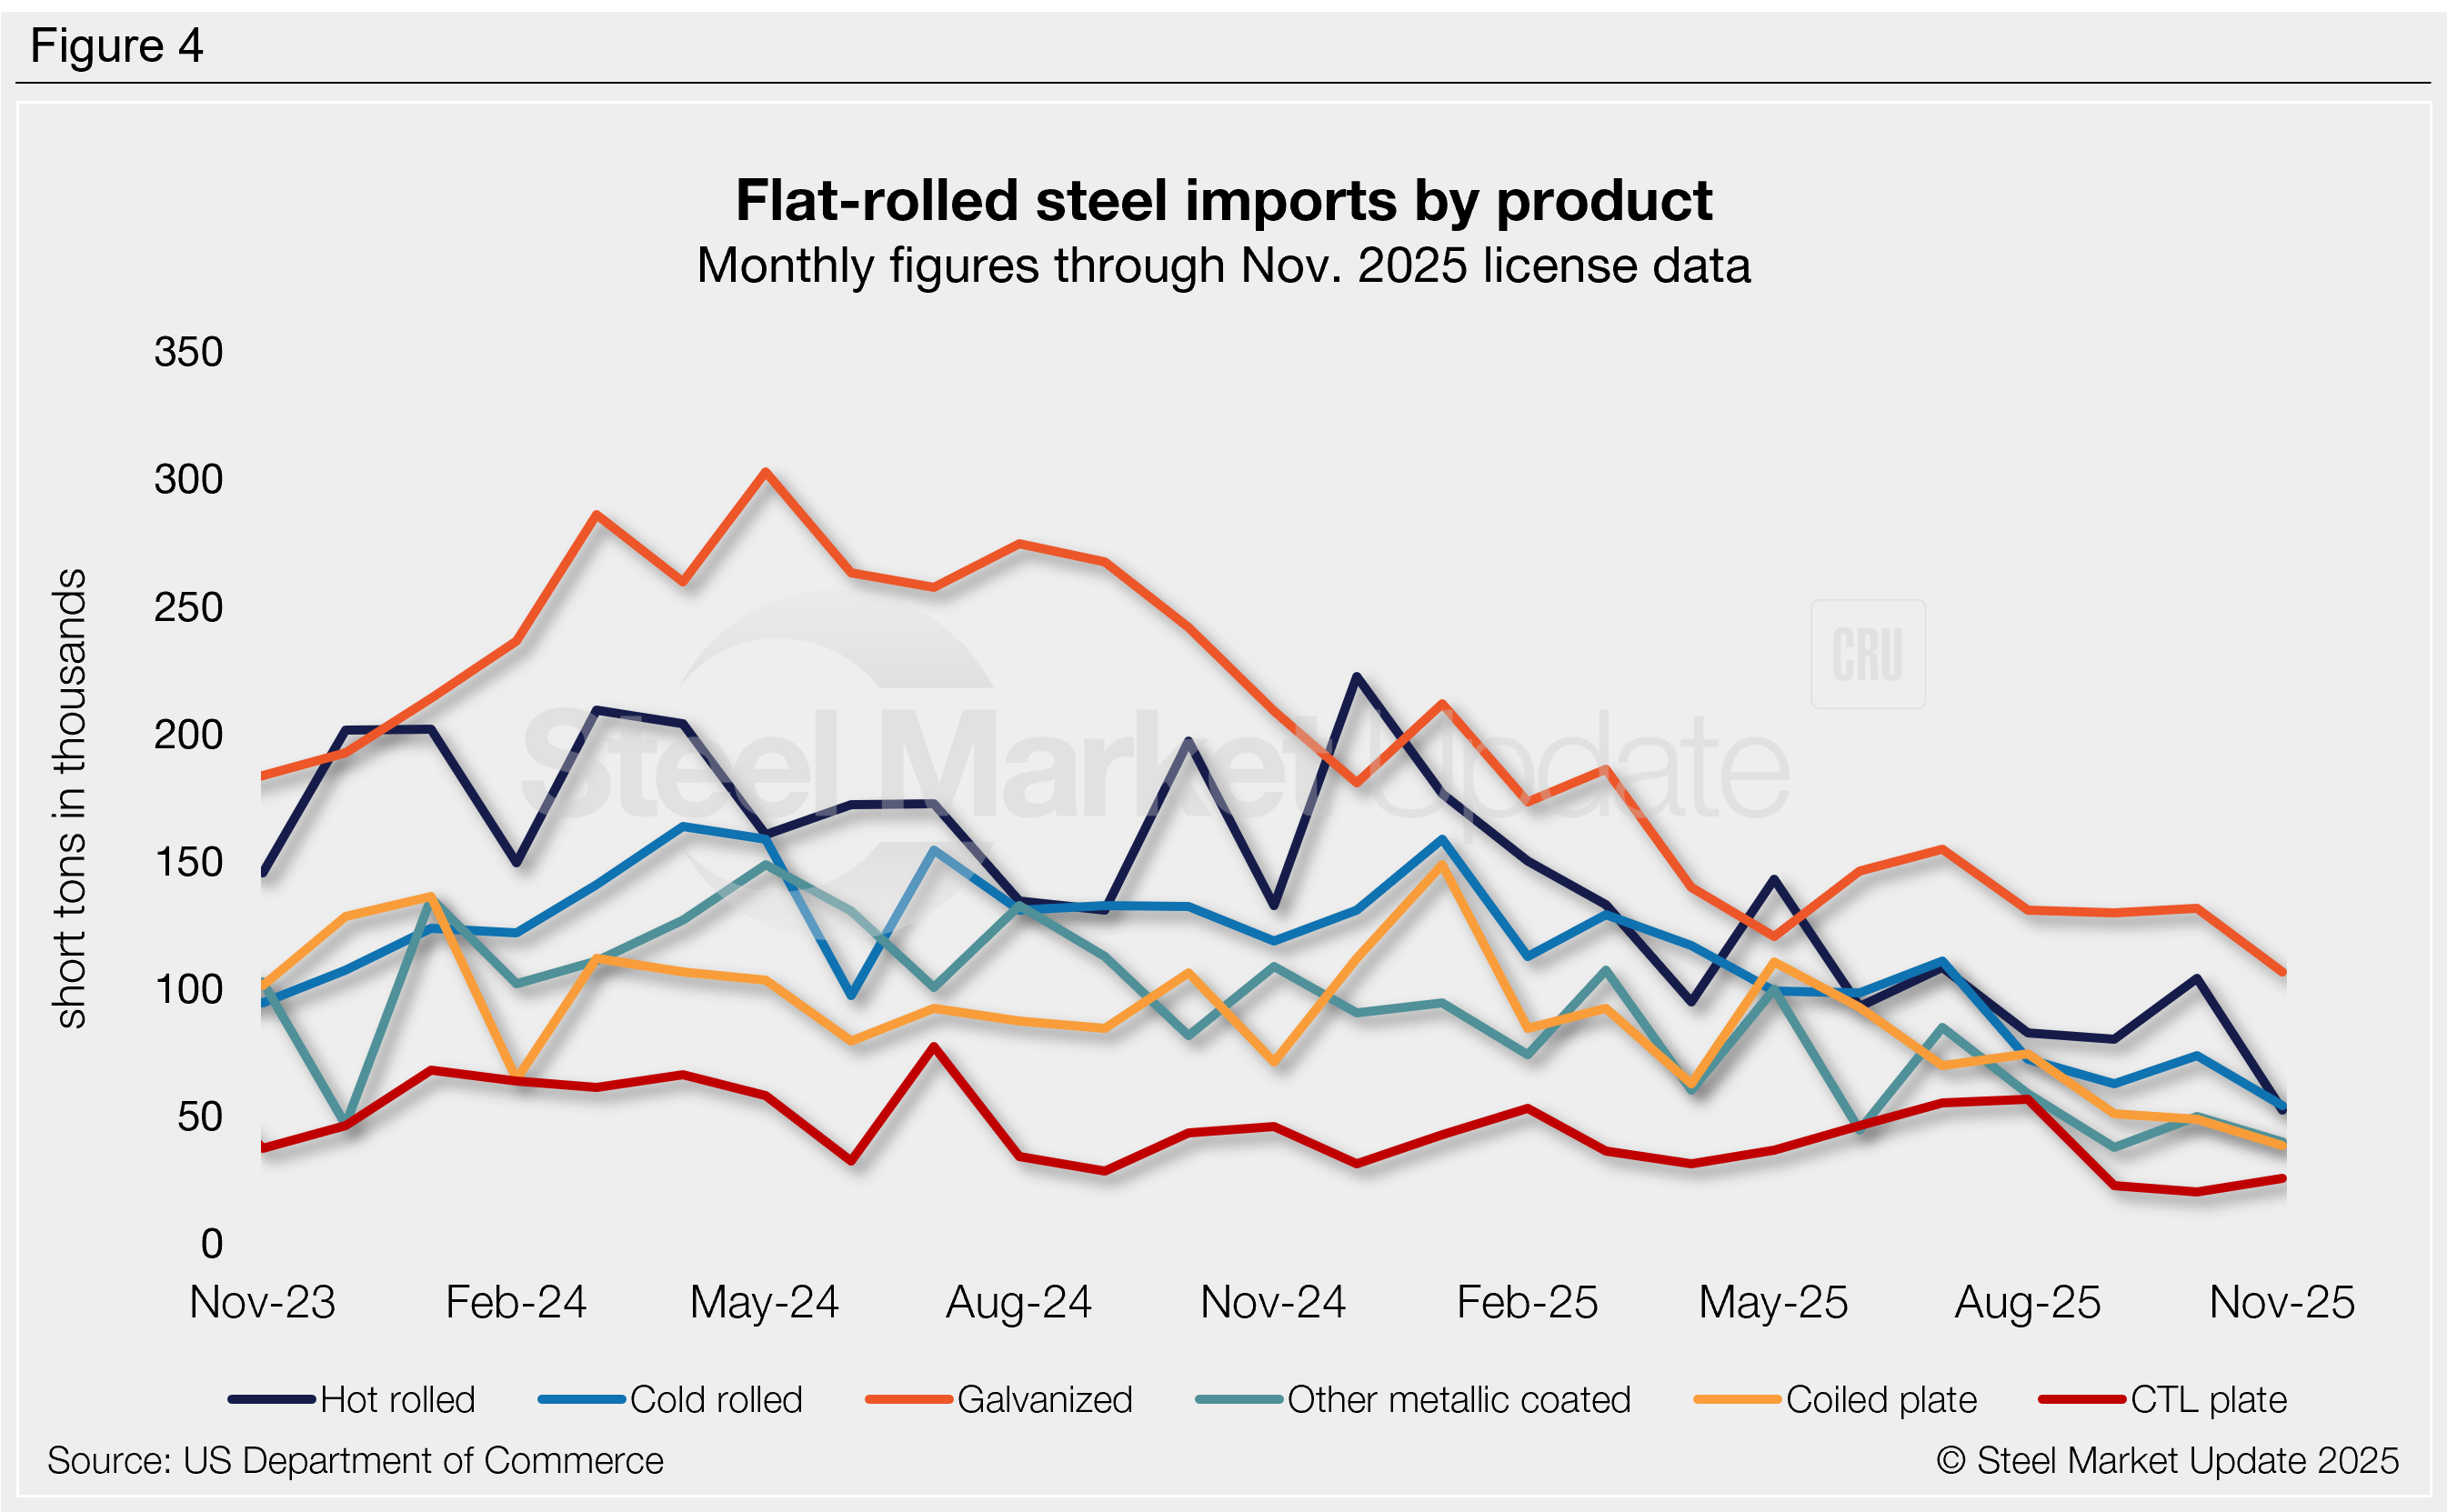
Figure 4 tracks flat-rolled imports for six popular sheet products. Most products declined from August to September aside from hot-rolled coil, galvanized, and tin plate, with many falling to multi-year lows. Movement was mixed through October. Key highlights:
- Hot-rolled coil imports eased 3% m/m in September to the lowest rate seen in our 28-year data history. October licenses rebounded 30% but fell back down 50% in November to a new record low.
- Cold-rolled coil declined 13% m/m in September to the lowest level since January 2021. License data suggests a 18% recovery in October followed by a 27% decline in November, potentially the lowest rate seen in more than 16 years.
- Galvanized slipped 1% m/m in September to a four-month low, with October licenses back up 1%. November licenses are currently down 19% from October to the lowest level seen since 2011.
- Other-metallic coated (mostly Galvalume) declined 36% in September to a near six-year low. October licenses rebounded 32%, then fell 20% in November.
- Coiled plate fell 32% m/m in September to a near-five-year low. Imports declined another 4% in October and another 21% in November, potentially the lowest rate seen since December 2009.
- Cut-to-length (CTL) plate tumbled 60% m/m in September to a near five-year low, then eased another 10% in October to the lowest rate recorded in our 27-year data history. November licenses are back up 26%.