Analysis

February 20, 2026
SMU Mill Order Index climbs further in January
Written by David Schollaert
SMU’s Mill Order Index (MOI) rose again in January, maintaining momentum from the month prior. The increase came as service center intake levels ticked up, supported by a jump in shipments, according to our latest service center inventories data.
The gain in intake and new order entries in January underscored the result, which is seasonally aligned. The increase comes as service centers likely worked to maintain inventory while readying to meet the traditional seasonal bump in demand in the new year.
But, intake, though up, was subdued (a 6.2% rise) month on month (m/m) due to a 12% increase in shipments. Still, new order entries surged by more than 23% in January vs. December, though some caution extending lead times could impact actual inventory pipeline.
Key highlights remain the continued efforts to maintain learner inventories. This is noted by just a 2% increase in inventory totals despite a decent jump in shipments m/m in January. The dynamic is an attempt to keep the service center supply in balance with demand.
Cautious buying remains at the forefront, as the downstream marketplace buys on an as-needed basis, relying heavily on contract tons. Service centers’ daily shipping rates – up 6.7% from December – were aided by an added day of shipping days, though somewhat impacted by poor weather.
The average shipping days in January were 21, up from 20 days in December.
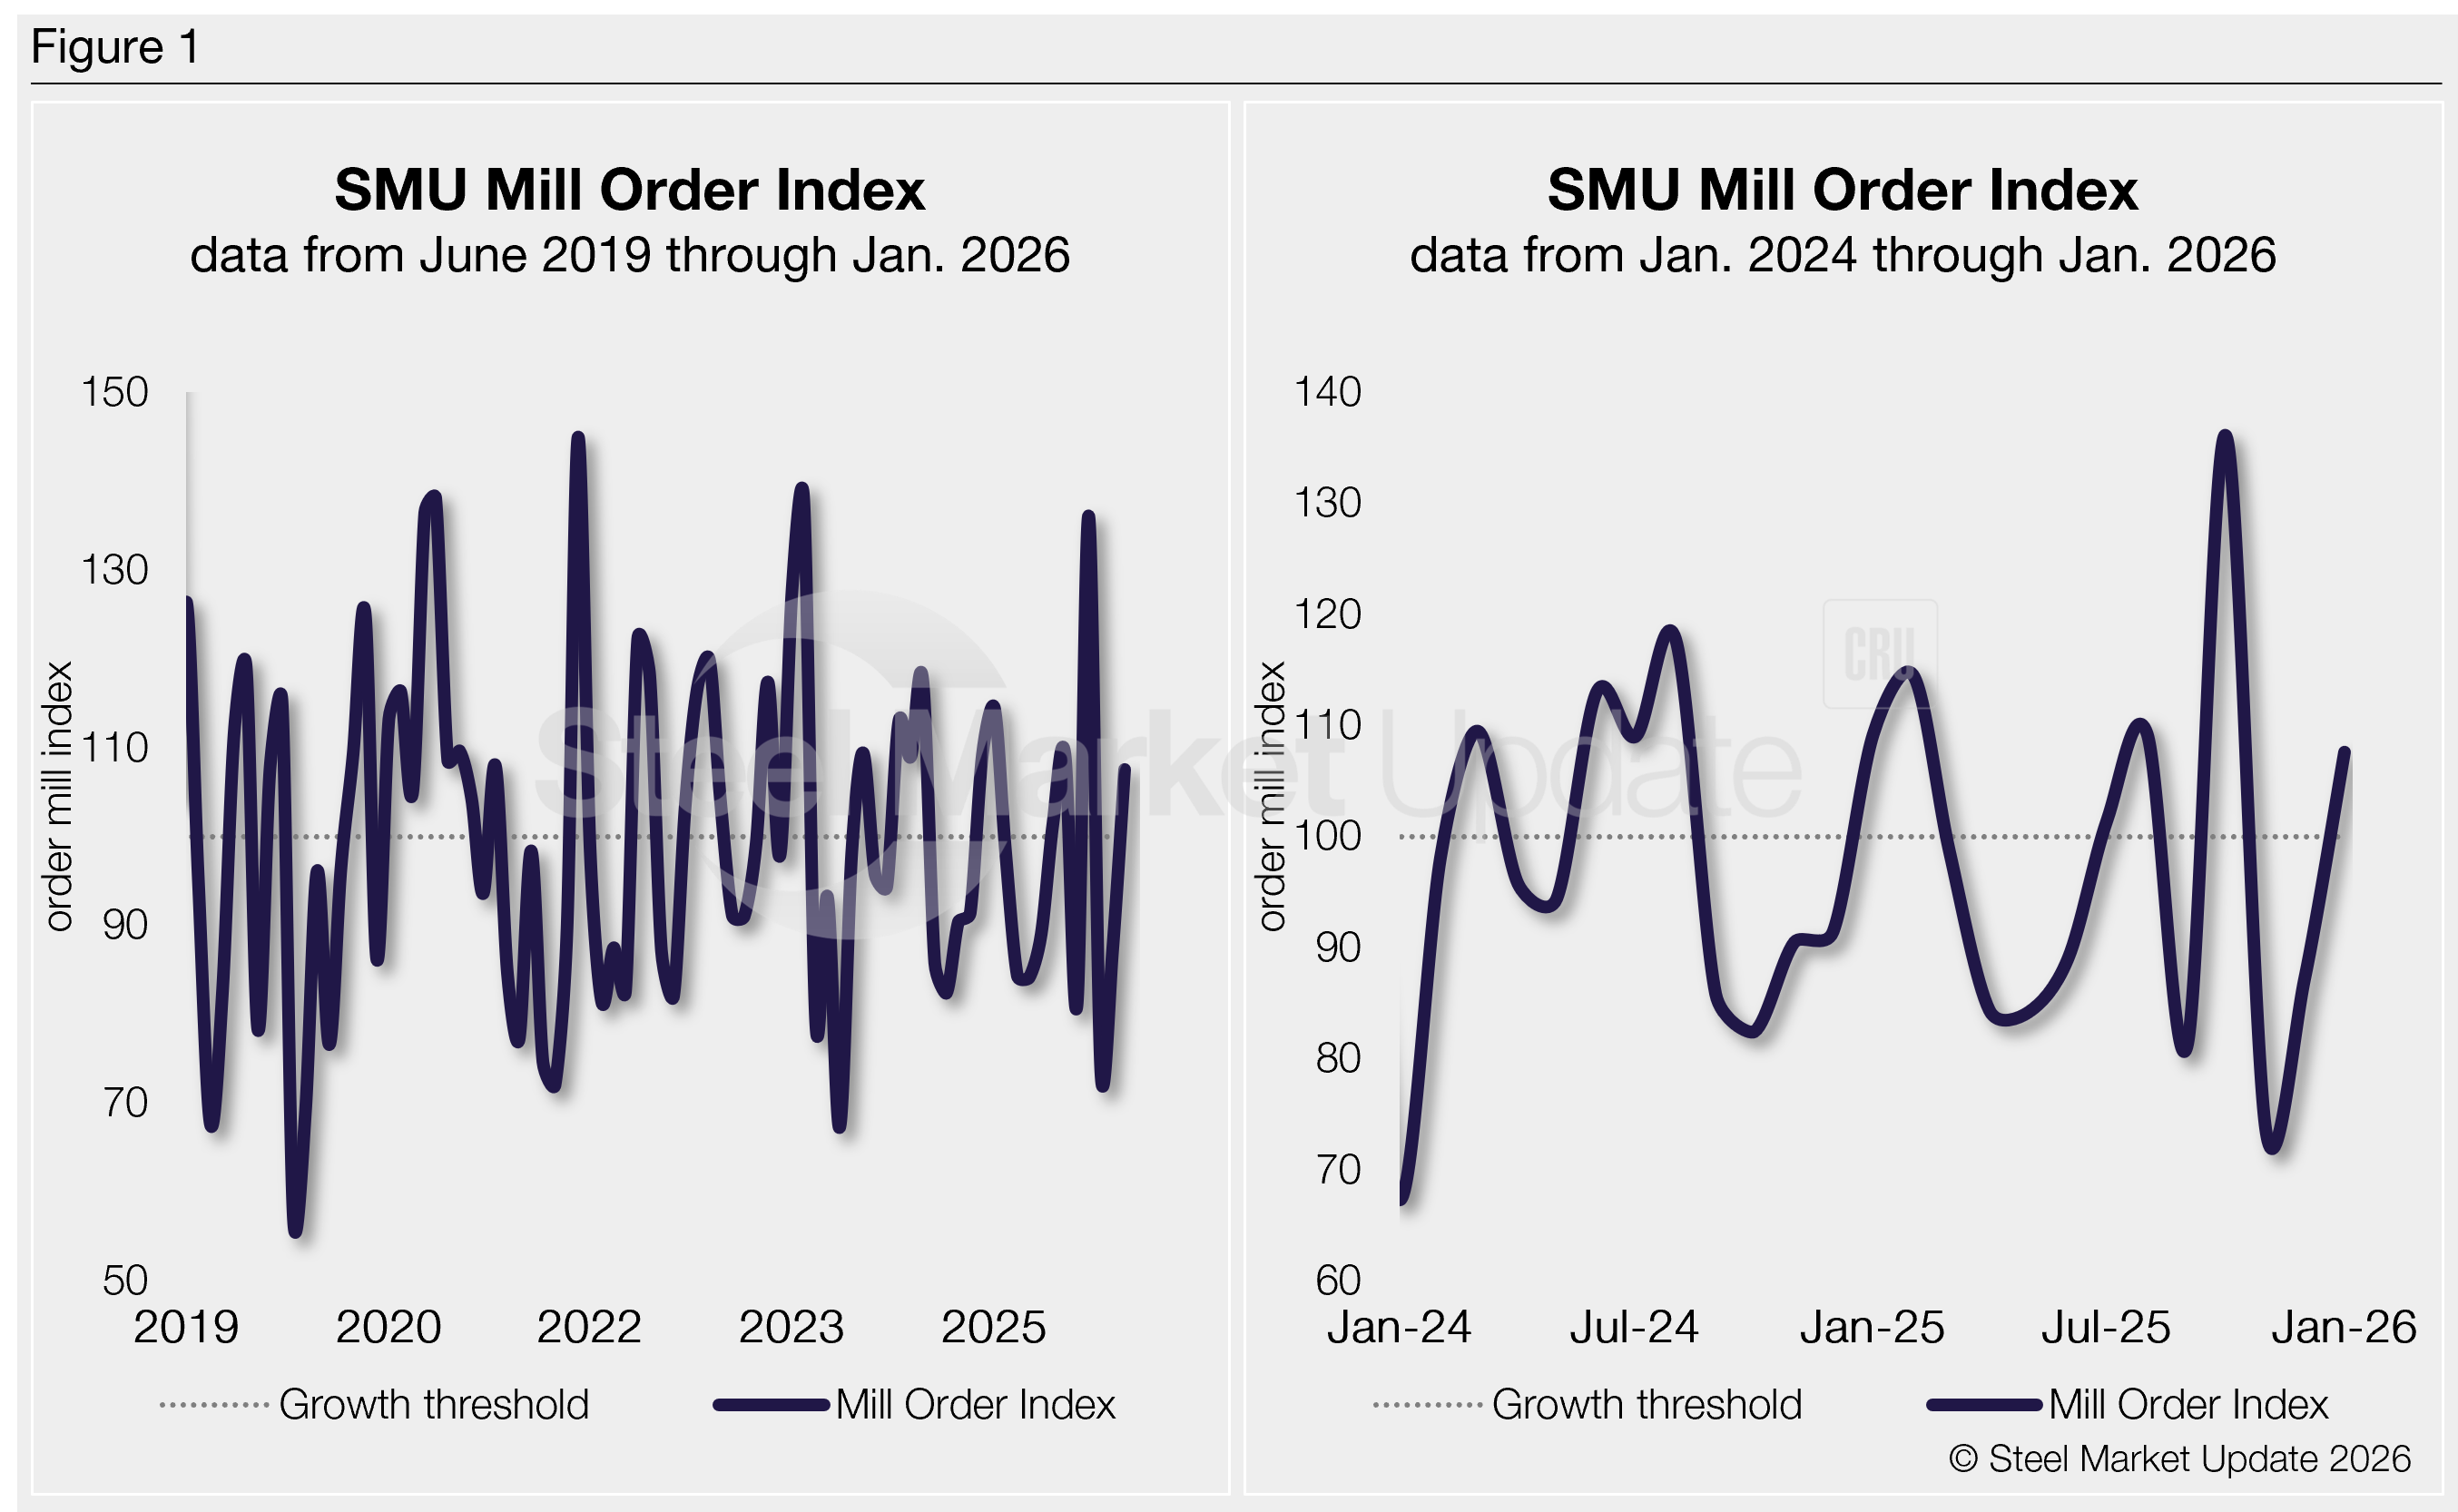
The MOI now stands at 107.6, up more than 23% from 87.1 in December. The rate was still below the typical seasonal reading, though showing improvement in back-to-back months. Still, the somewhat subdued gain may suggest service centers are still closely monitoring inventories.
Methodology
SMU derives its MOI — a relative index that evaluates the latest change in service center mill order entries — from our monthly service center inventory data. This index is a good indicator of current service center buying patterns, displaying perceived demand and lead times. This stands out because lead times typically signal upcoming moves in steel prices.
The MOI uses a base period, presently 2022-24, to establish a reference point for measuring service centers’ mill orders over time. This base period is assigned an index value of 100. Subsequent MOI values are then calculated relative to this base.
An index score above 100 indicates an increase in buying, and a score below 100 indicates a decrease.
Figure 1 shows the nearly six-year history of the index on the left and provides a closer look at the MOI readings of the past two years on the right (100 = 2022-2024 average).
Background
Although there were brief price surges — sparked by sudden mill increases following tariff announcements — overall market conditions stayed relatively stable and at times sluggish in 2025. And they were largely held back by stagnant end‑use demand (see the right‑side chart in Figure 1).
Intake volumes climbed through most of Q1’25, driven by downstream buyers accelerating purchases in anticipation of tariff‑related price hikes. The resulting jump in service‑center orders quickly pushed mill prices higher, but demand didn’t follow.
After reaching a high point last March, intake volumes began steadily softening, a trend observed since May. Service centers timed the market bottom in October, before riding it out to close 2025.
The skinny
So it’s no surprise to see intake volumes tick up in January after tapering off once the tariff-driven buying rush faded in H1 2025. With downstream customers tightly managing inventories and prioritizing contract fulfillment, service‑center shipments showed no meaningful lift.
While they saw a notable increase in October — new order entries reached a two-year high — they declined by more than 30% in November to their lowest total since April 2020. And they have since increased, though well behind y/y levels.
Data would indicate that the bump in January was indeed in line with seasonal demand rather than a fundamental shift in demand. Mills, meanwhile, are holding firm and aiming to push prices up as 2026 continues to take shape.
SMU’s MOI will likely fluctuate somewhat in February and into early Q2. The general expectation is inventories could be impacted even as new order entries rise modestly, because of some production delays in some Midwest plants. The dynamic has pushed lead times out a bit and may directly impact the supply pipeline as seasonal demand ticks up.
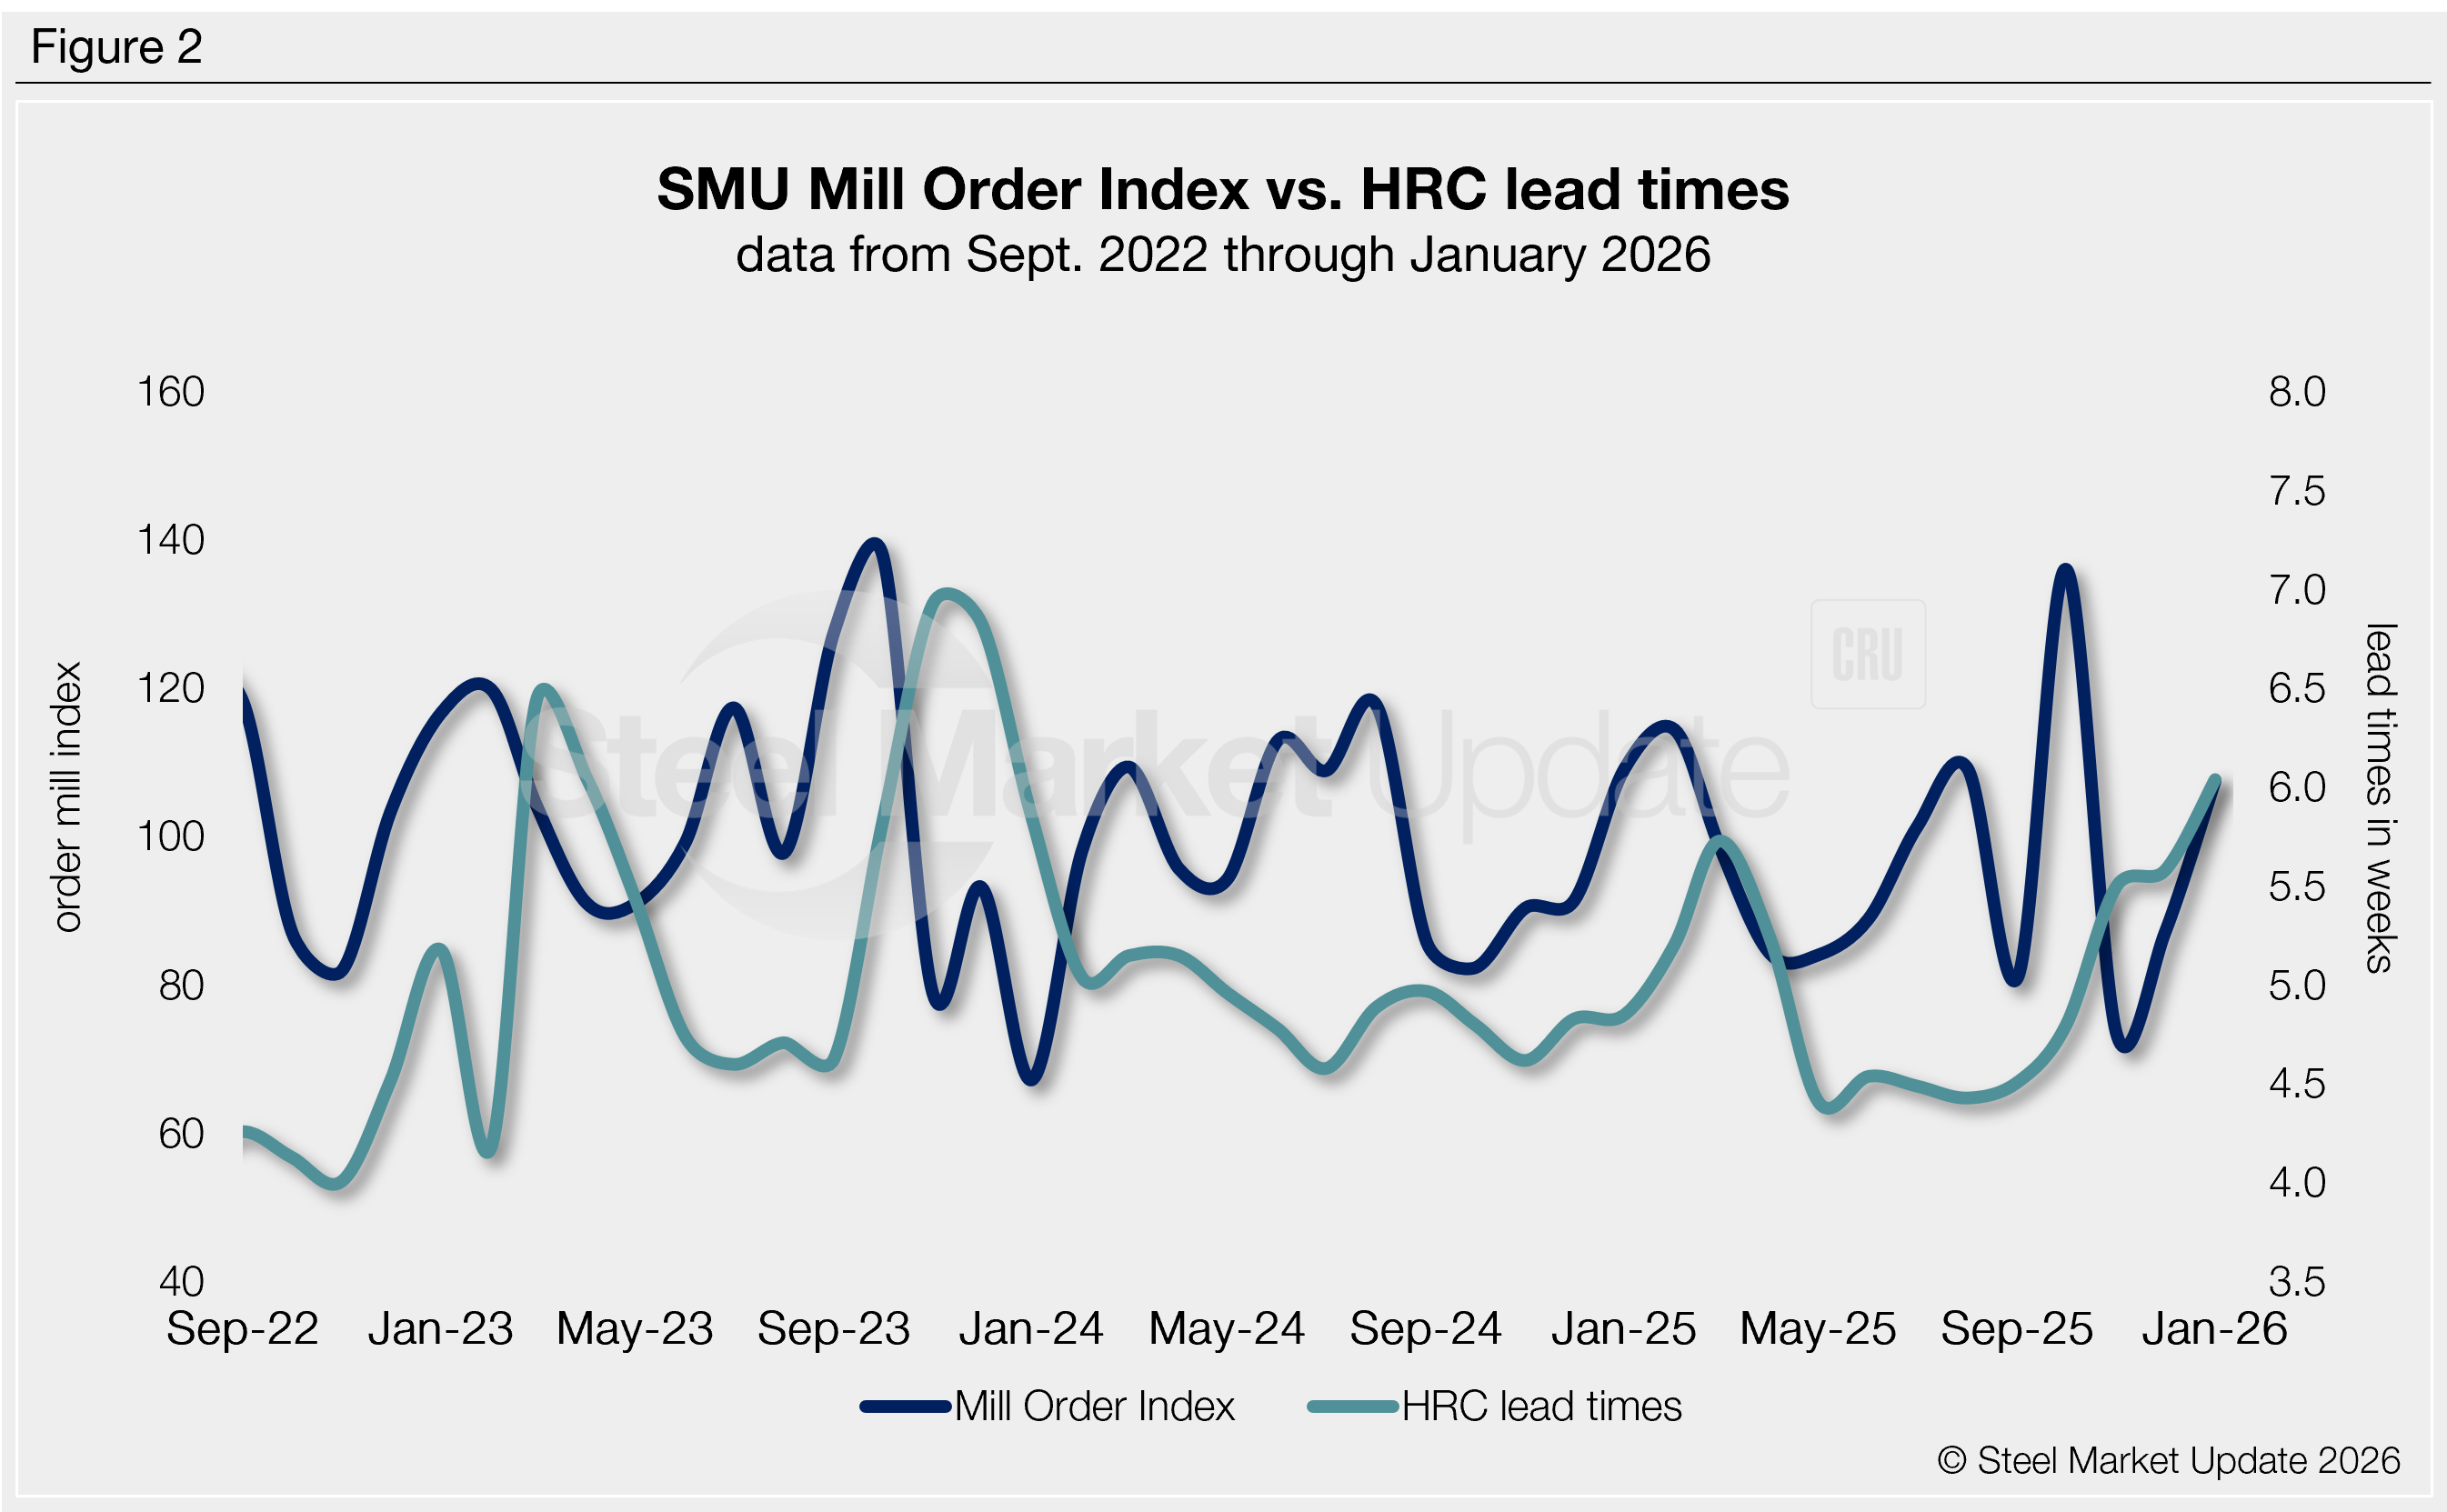
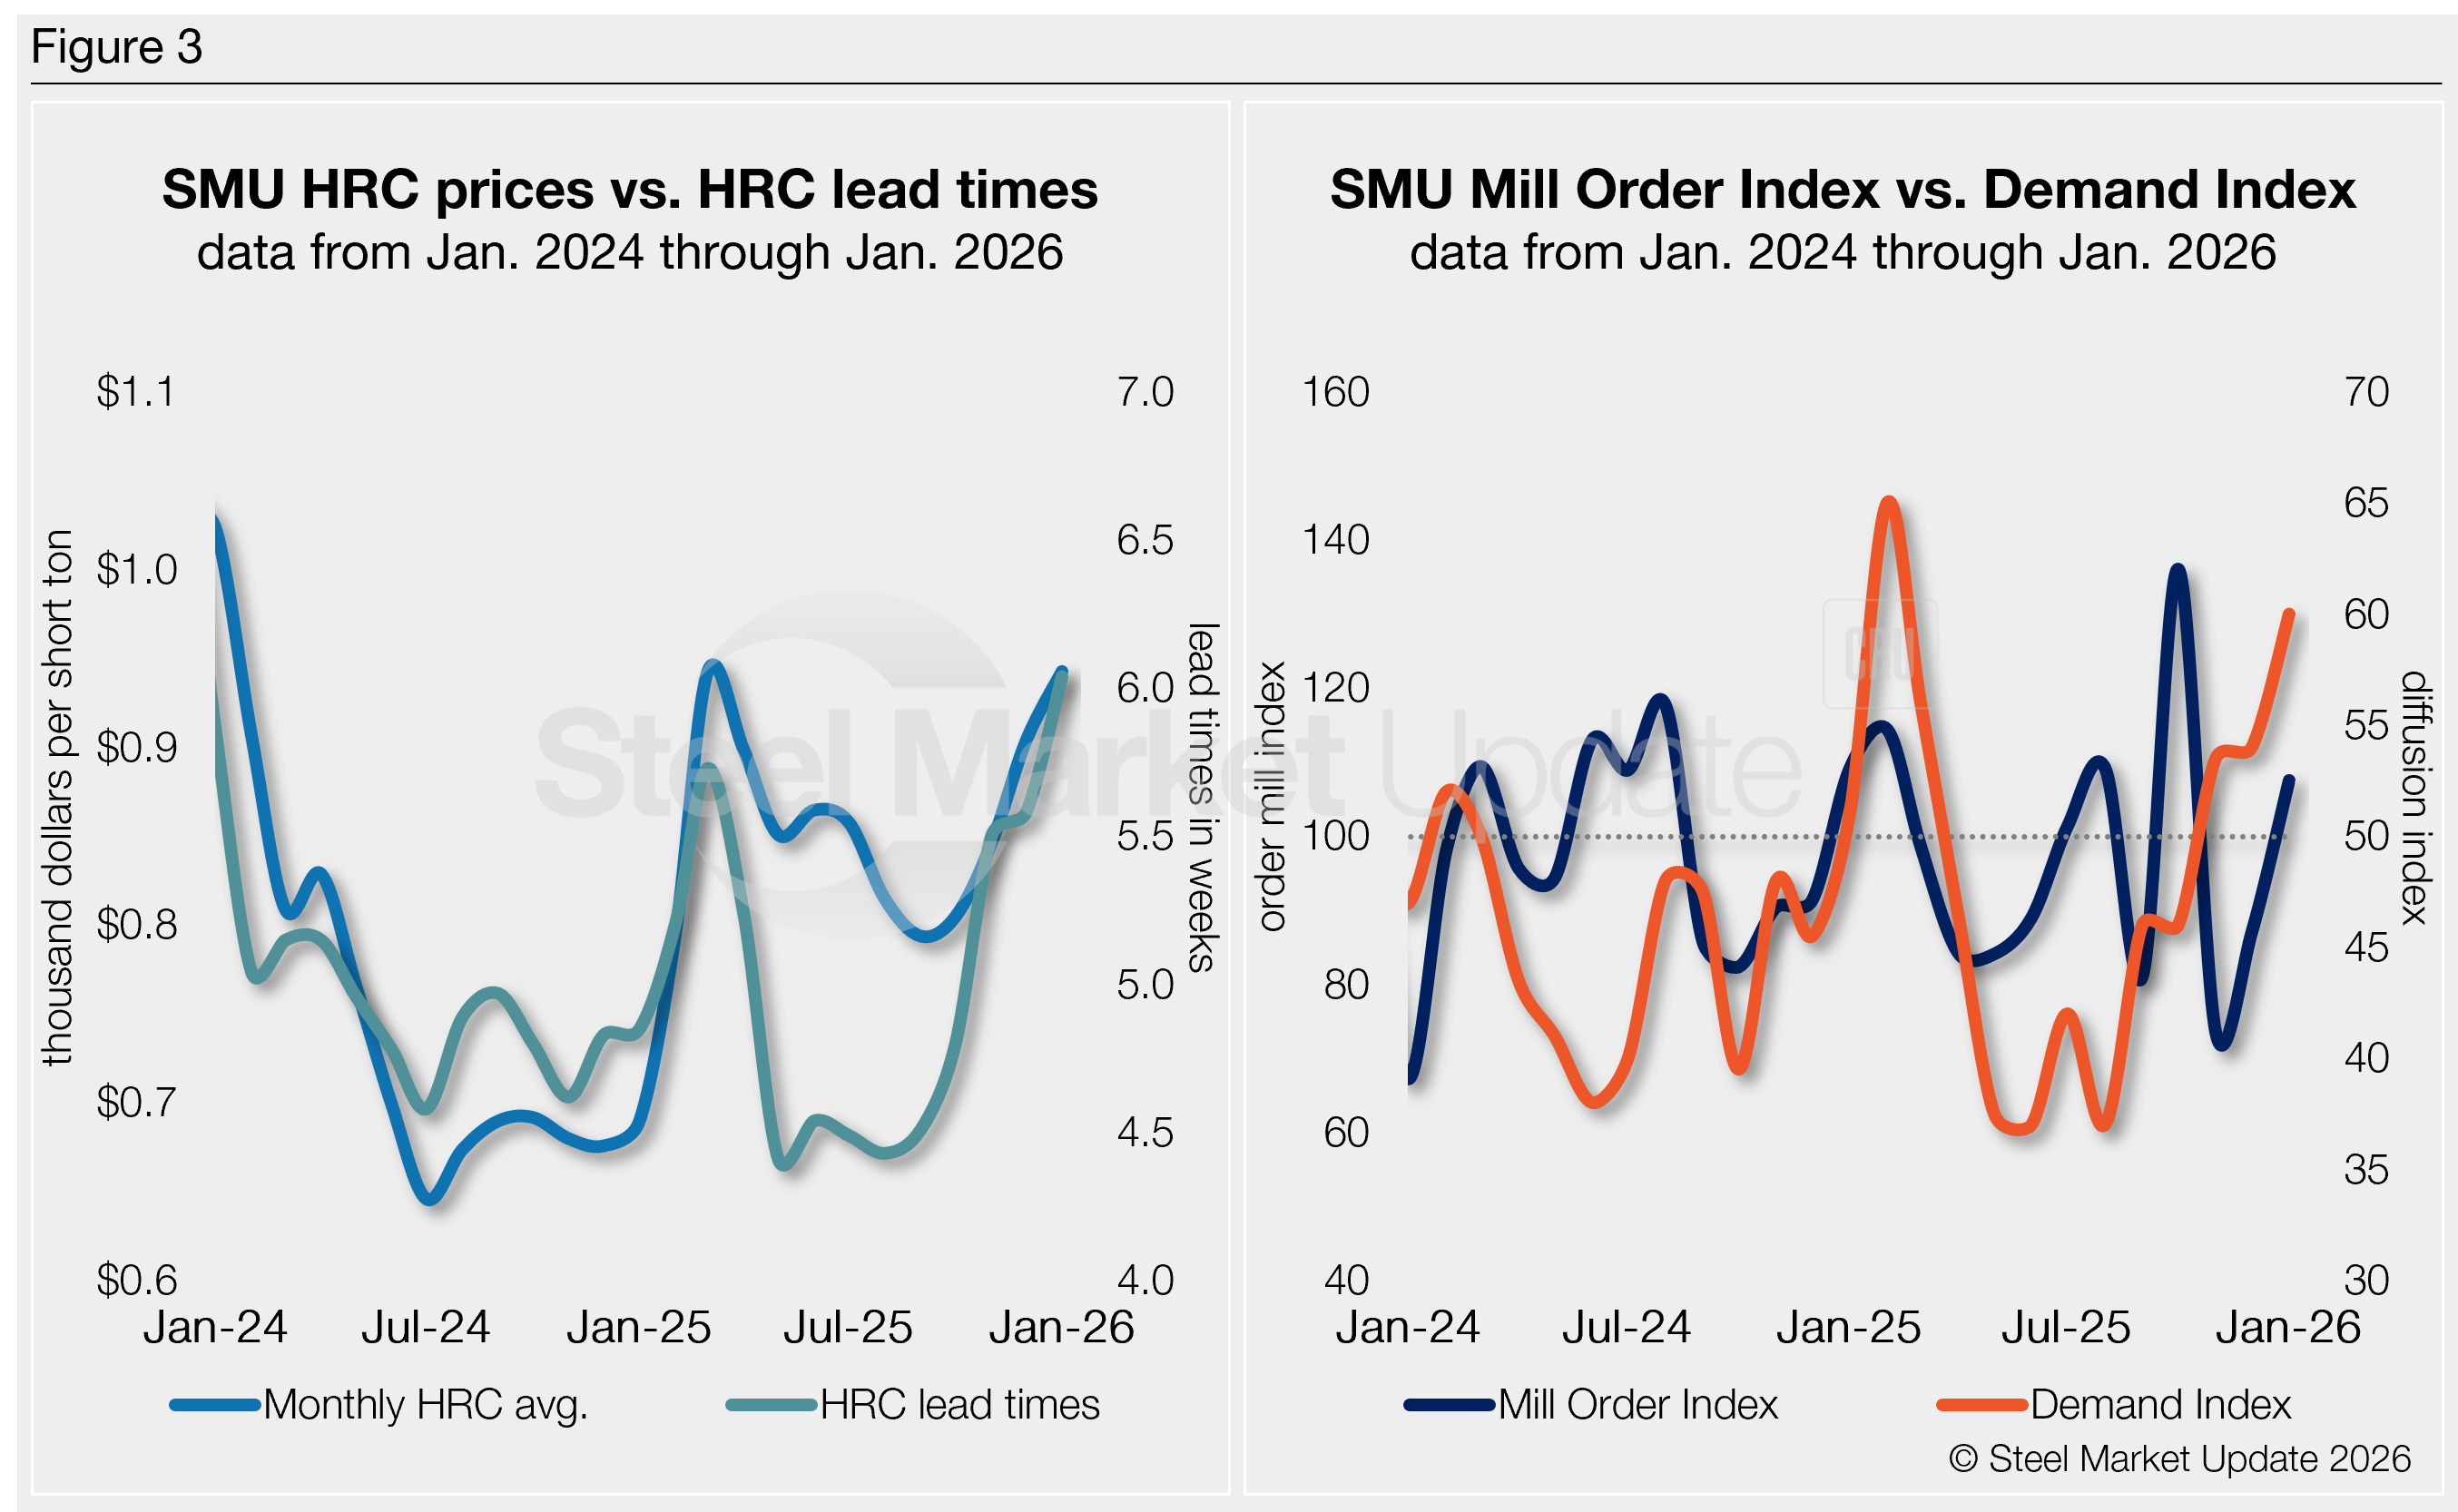
SMU’s MOI pairs well with — and has for the past five years proceeded — moves in mill lead times (Figure 2), though the latest results would indicate a divergence. And SMU’s lead times have also been a leading indicator of flat-rolled steel prices, particularly for HRC (see left-side chart in Figure 3).
Our MOI also pairs well with our Steel Demand Index (see right-side chart in Figure 3), which, for nearly a decade, has preceded moves in mill lead times. But, again, the latest data denotes a disagreement.
How it shakes out
Prices have been on the rise, now up $190 per short ton (st) since late September. And lead times have been steadily stretching out, now at 5.9 weeks on average in our latest assessment, up from 5.8 in early February.
The trend appears to denote a downstream supply chain that is in balance, though lean — and some might say inventories appear well matched to demand in January. But if lead times continue to push out, some spot buying might tip the scales, pushing prices up further in the near term.
This is likely why the mill order index is trending up, though at a steady pace, as our Demand Index is pointing up.
Maintenance schedules and poor weather across most of the US have tightened supply a bit, but market dynamics are still being aided by wide-sweeping tariffs that have largely removed import competition.
This would typically be a recipe for a very sharp price escalation — think three-to-four times $190/st. But we haven’t seen that play out just yet. Could it be an indication that demand is indeed not as robust as some might believe?
We’ll be tracking any changes closely as we move through February and inQ2.