Manufacturers/End Users

May 5, 2026
Fed indicators signal healthy manufacturing sector
Written by Brett Linton
Recently released Federal Reserve data signal that the US manufacturing sector remains resilient. Most manufacturing indicators strengthened through March and showed strong positive annual growth.
Industrial production and durable goods were at or near multi-year highs in March, while factory orders rose to a record high. Both new orders and inventories for iron and steel products remained steady yet healthy.
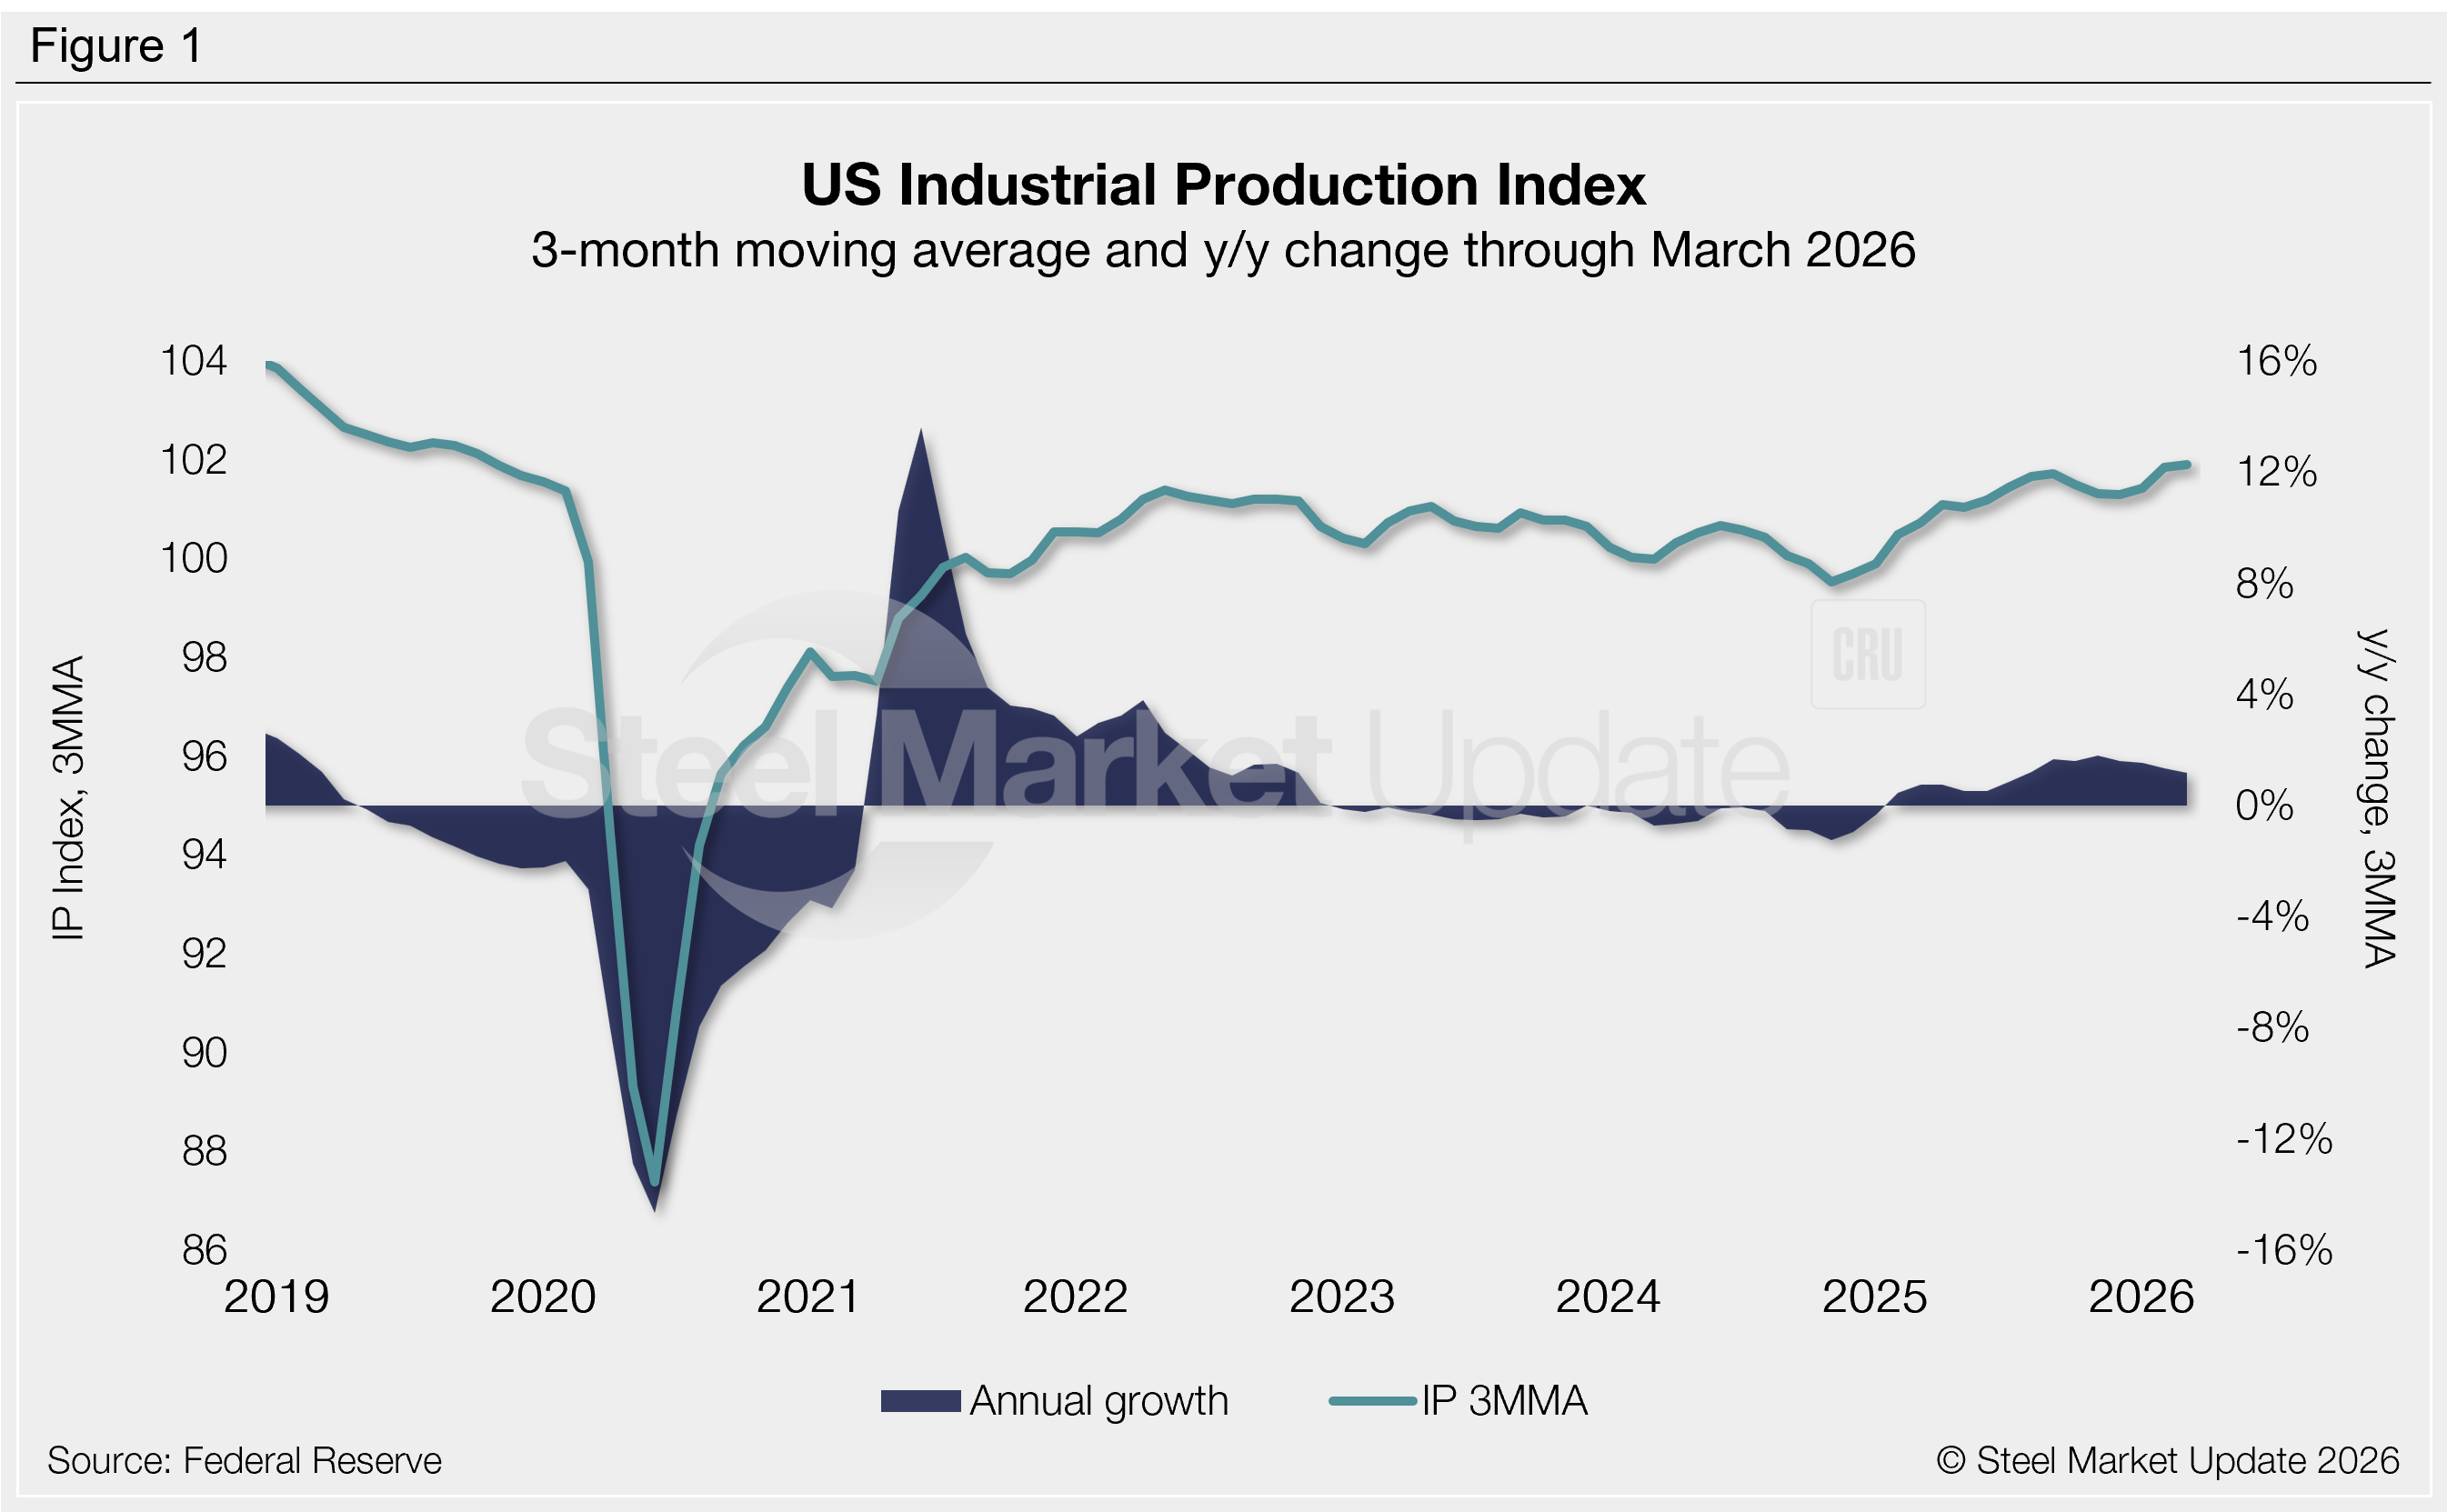
Industrial Production
The Industrial Production (IP) index measures output from factories, mines, and utilities. Figure 1 presents this index as a three-month moving average (3MMA) to smooth monthly volatility. Through March, the IP index stood at 101.9, the strongest measure recorded since late 2019. For comparison the highest level in our 33-year data history was 104.1 set in November 2018. The IP index has posted positive annual growth for the past 14 months, registering +1.2% in March.
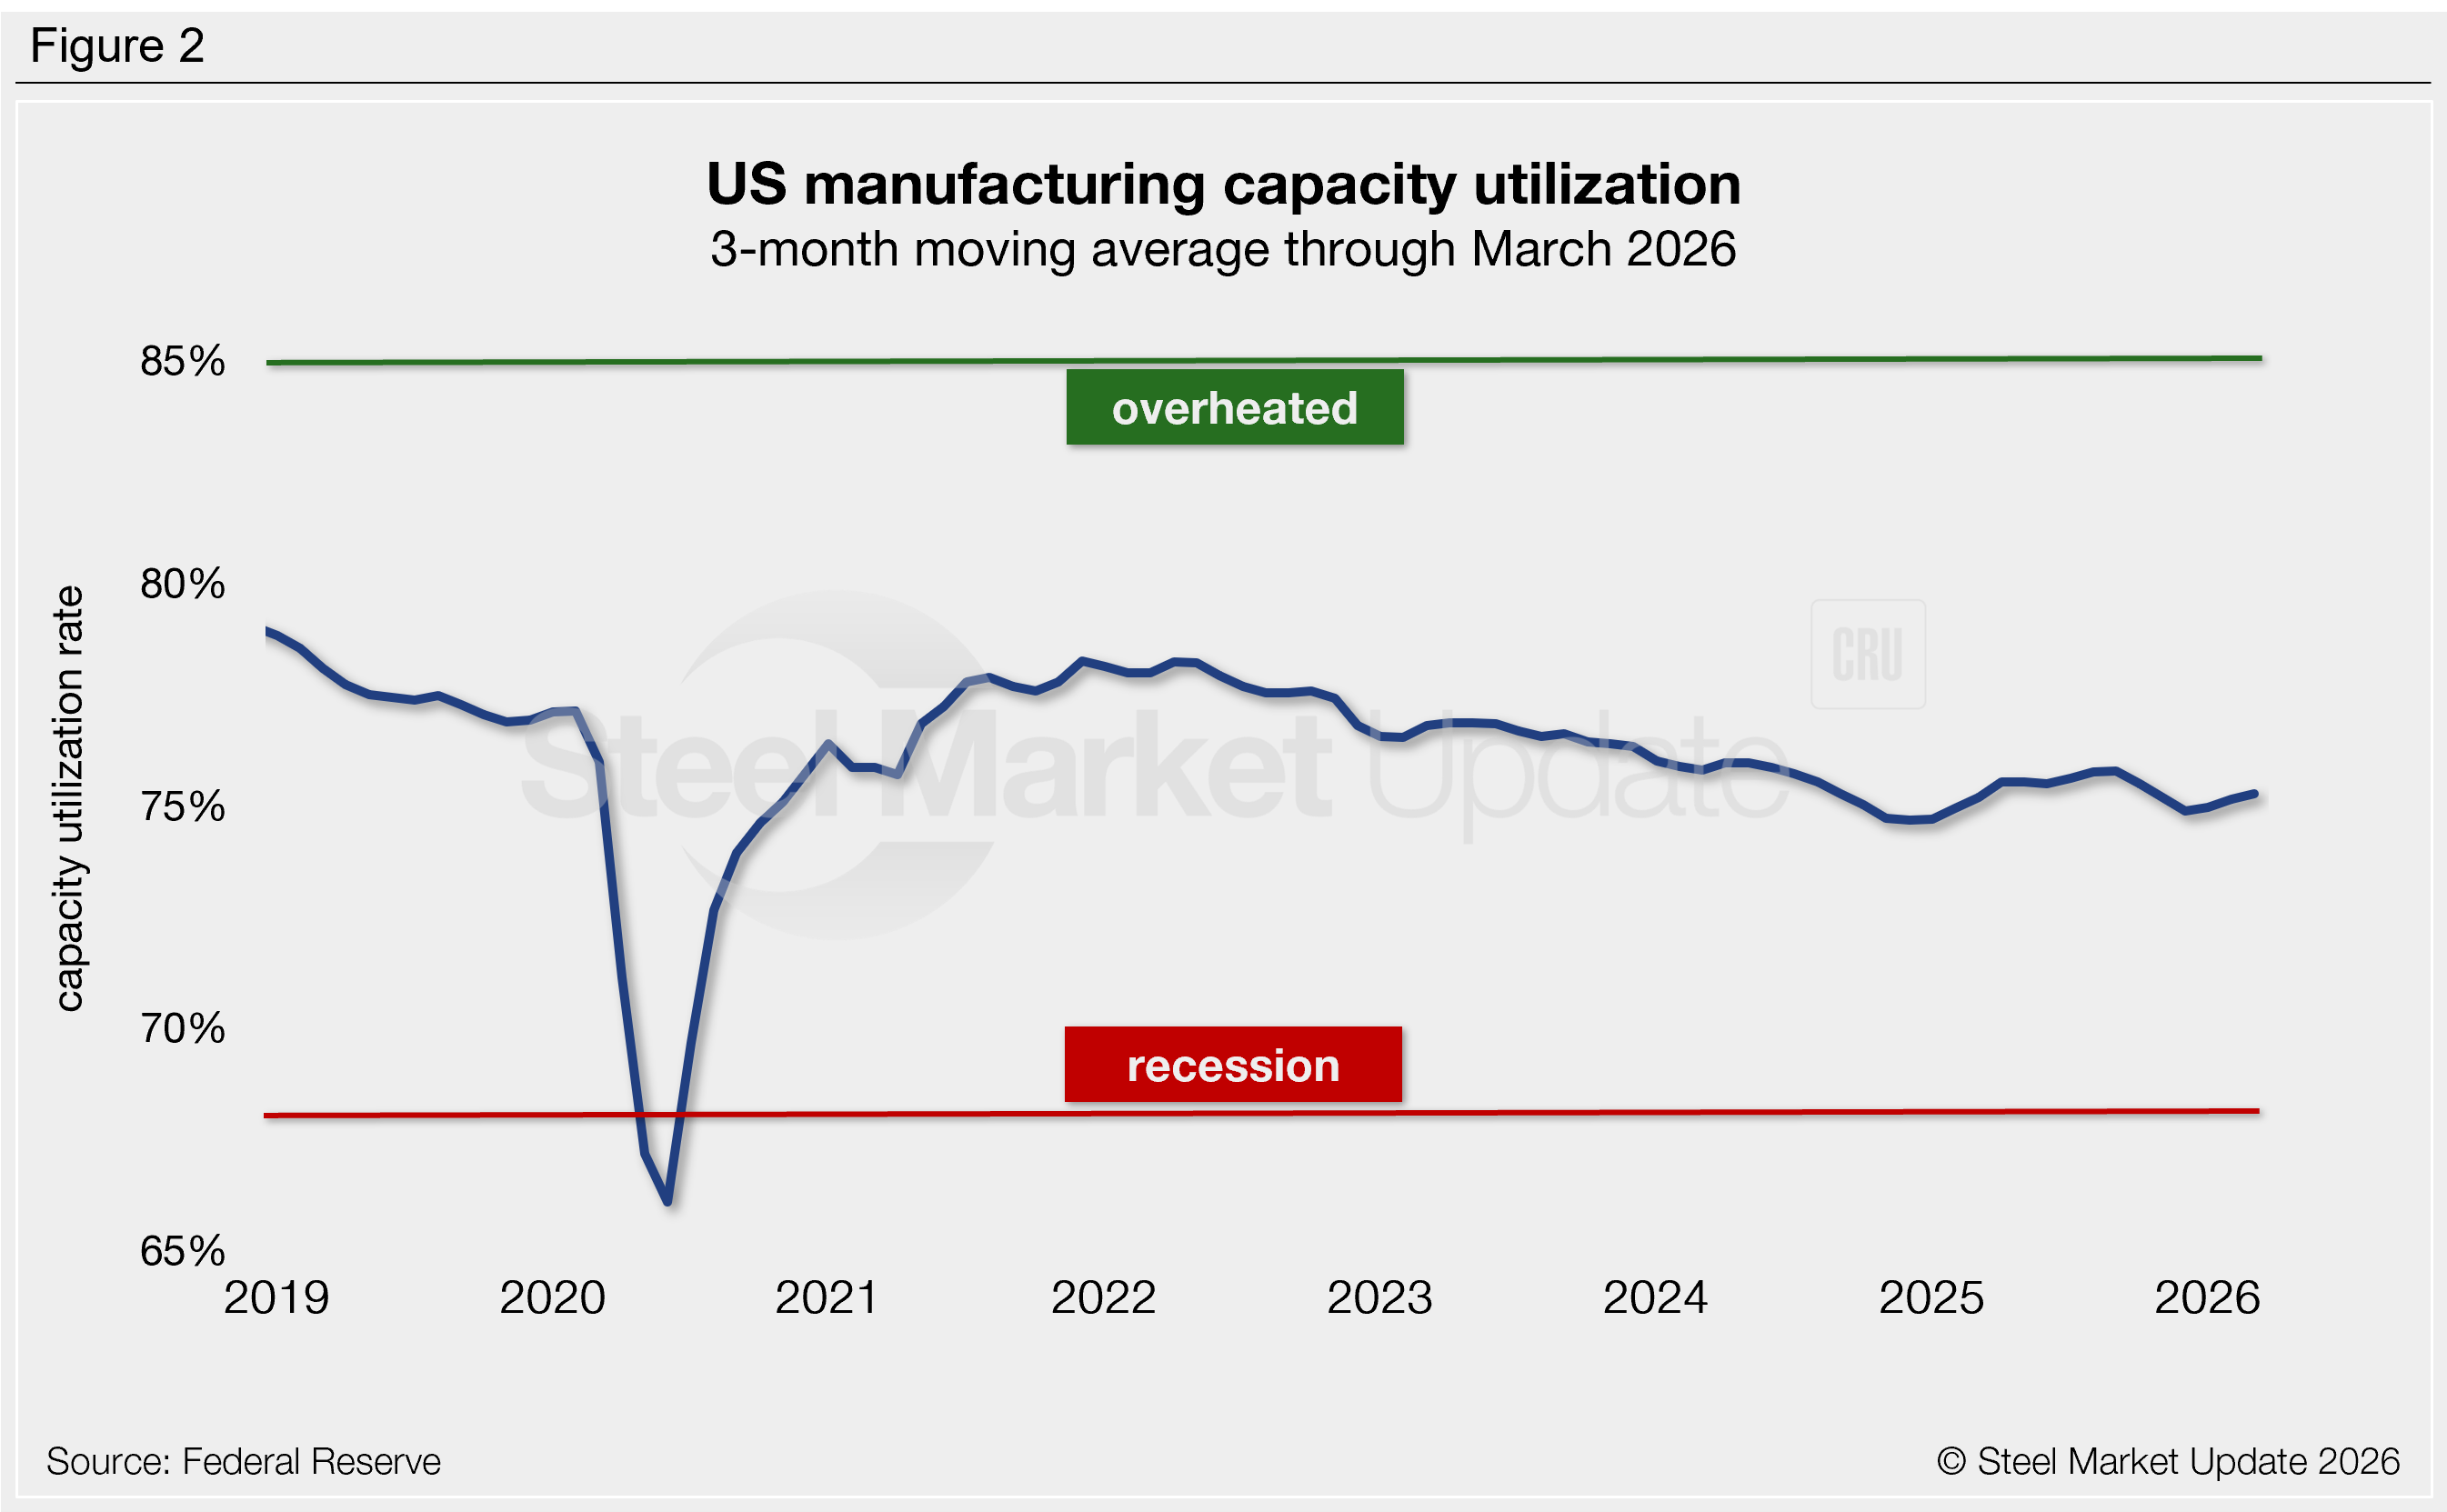
Manufacturing capacity utilization
Following the gradual decline seen from 2022 through 2024, manufacturing capacity utilization has held relatively steady for the last year and a half. It has resided well above recessionary territory since mid-2020.
The 3MMA rate has increased each of the last three months, rising to a five-month high of 75.3% through March (Figure 2). Compare this to the average capacity utilization rates of previous years (75.3% in 2025, 75.4% in 2024, 76.6% in 2023, and 77.6% in 2022. Historically, capacity utilization has generally ranged from 75–79% for more than a decade, excluding 2020.
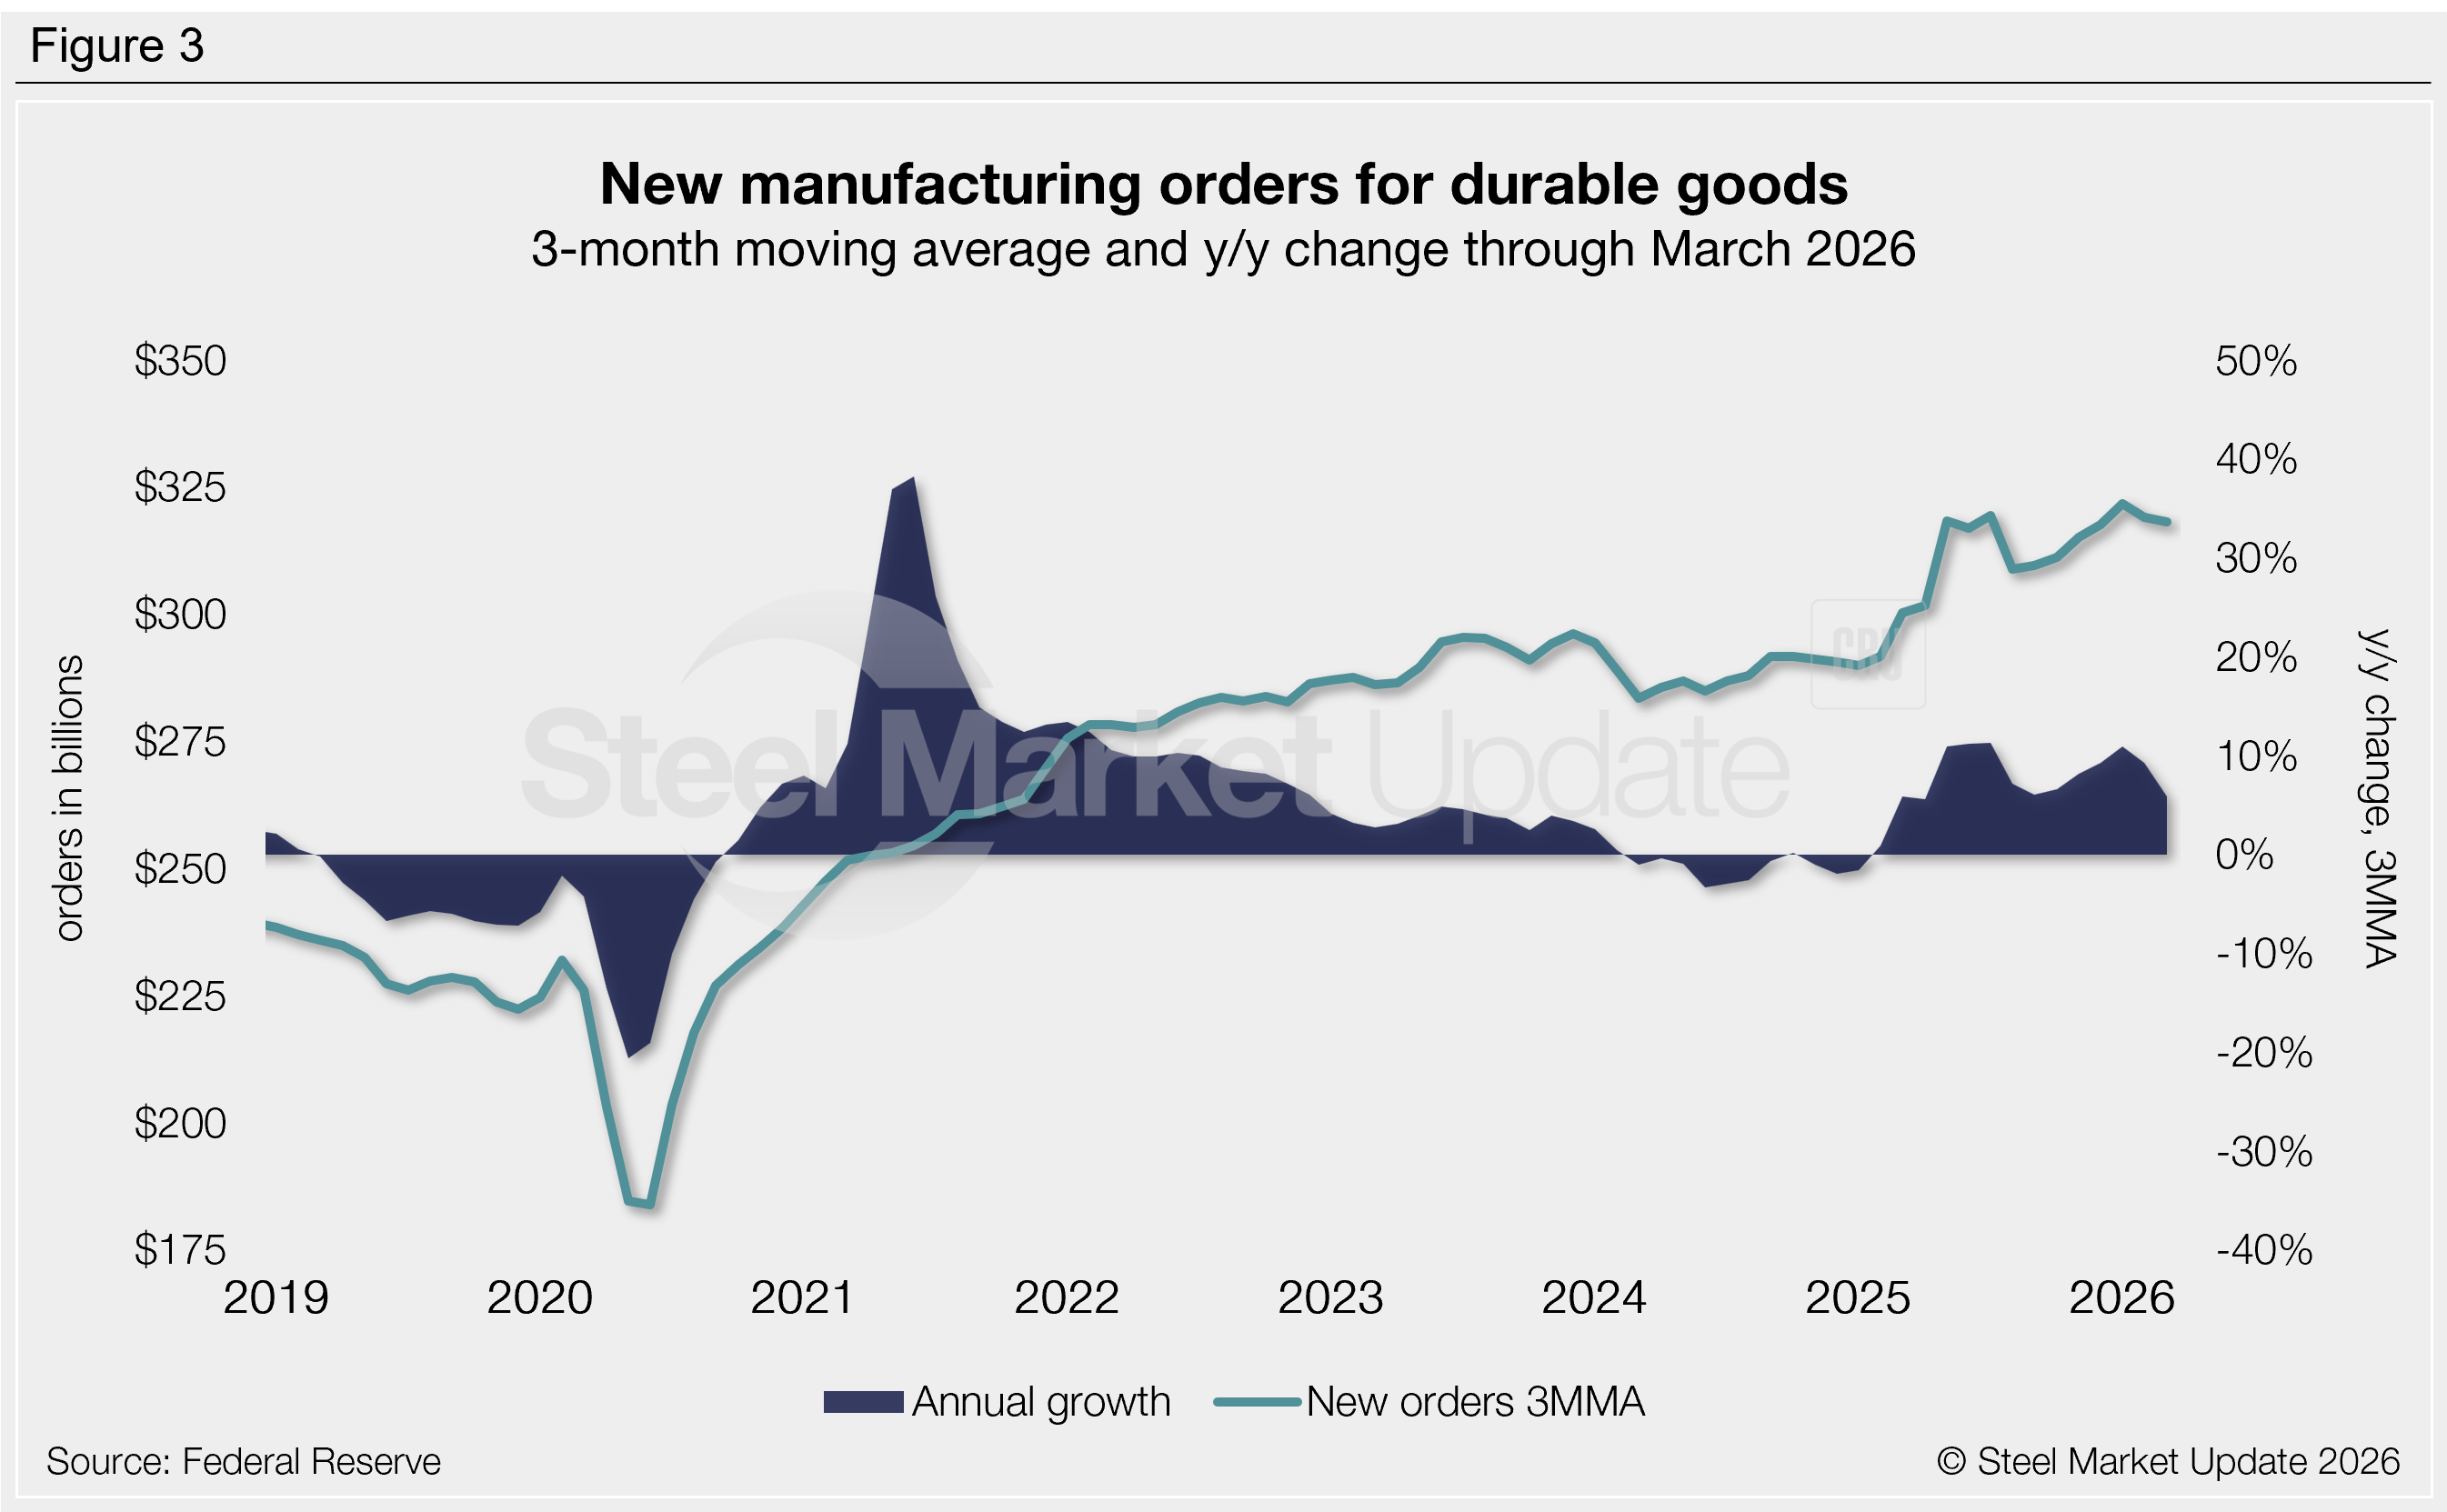
New orders for all durable goods
Durable goods new orders are an early indicator of demand for US manufactured goods. This measure continues to strengthen from the 2020 disruptions and regularly reaches record highs.
New orders marginally eased to $318.4 billion as a 3MMA through March (Figure 3), up 6.0% from March 2025. Two months prior to this, we saw new orders reach $321.9 billion, the highest rate observed in our 34-year data history.
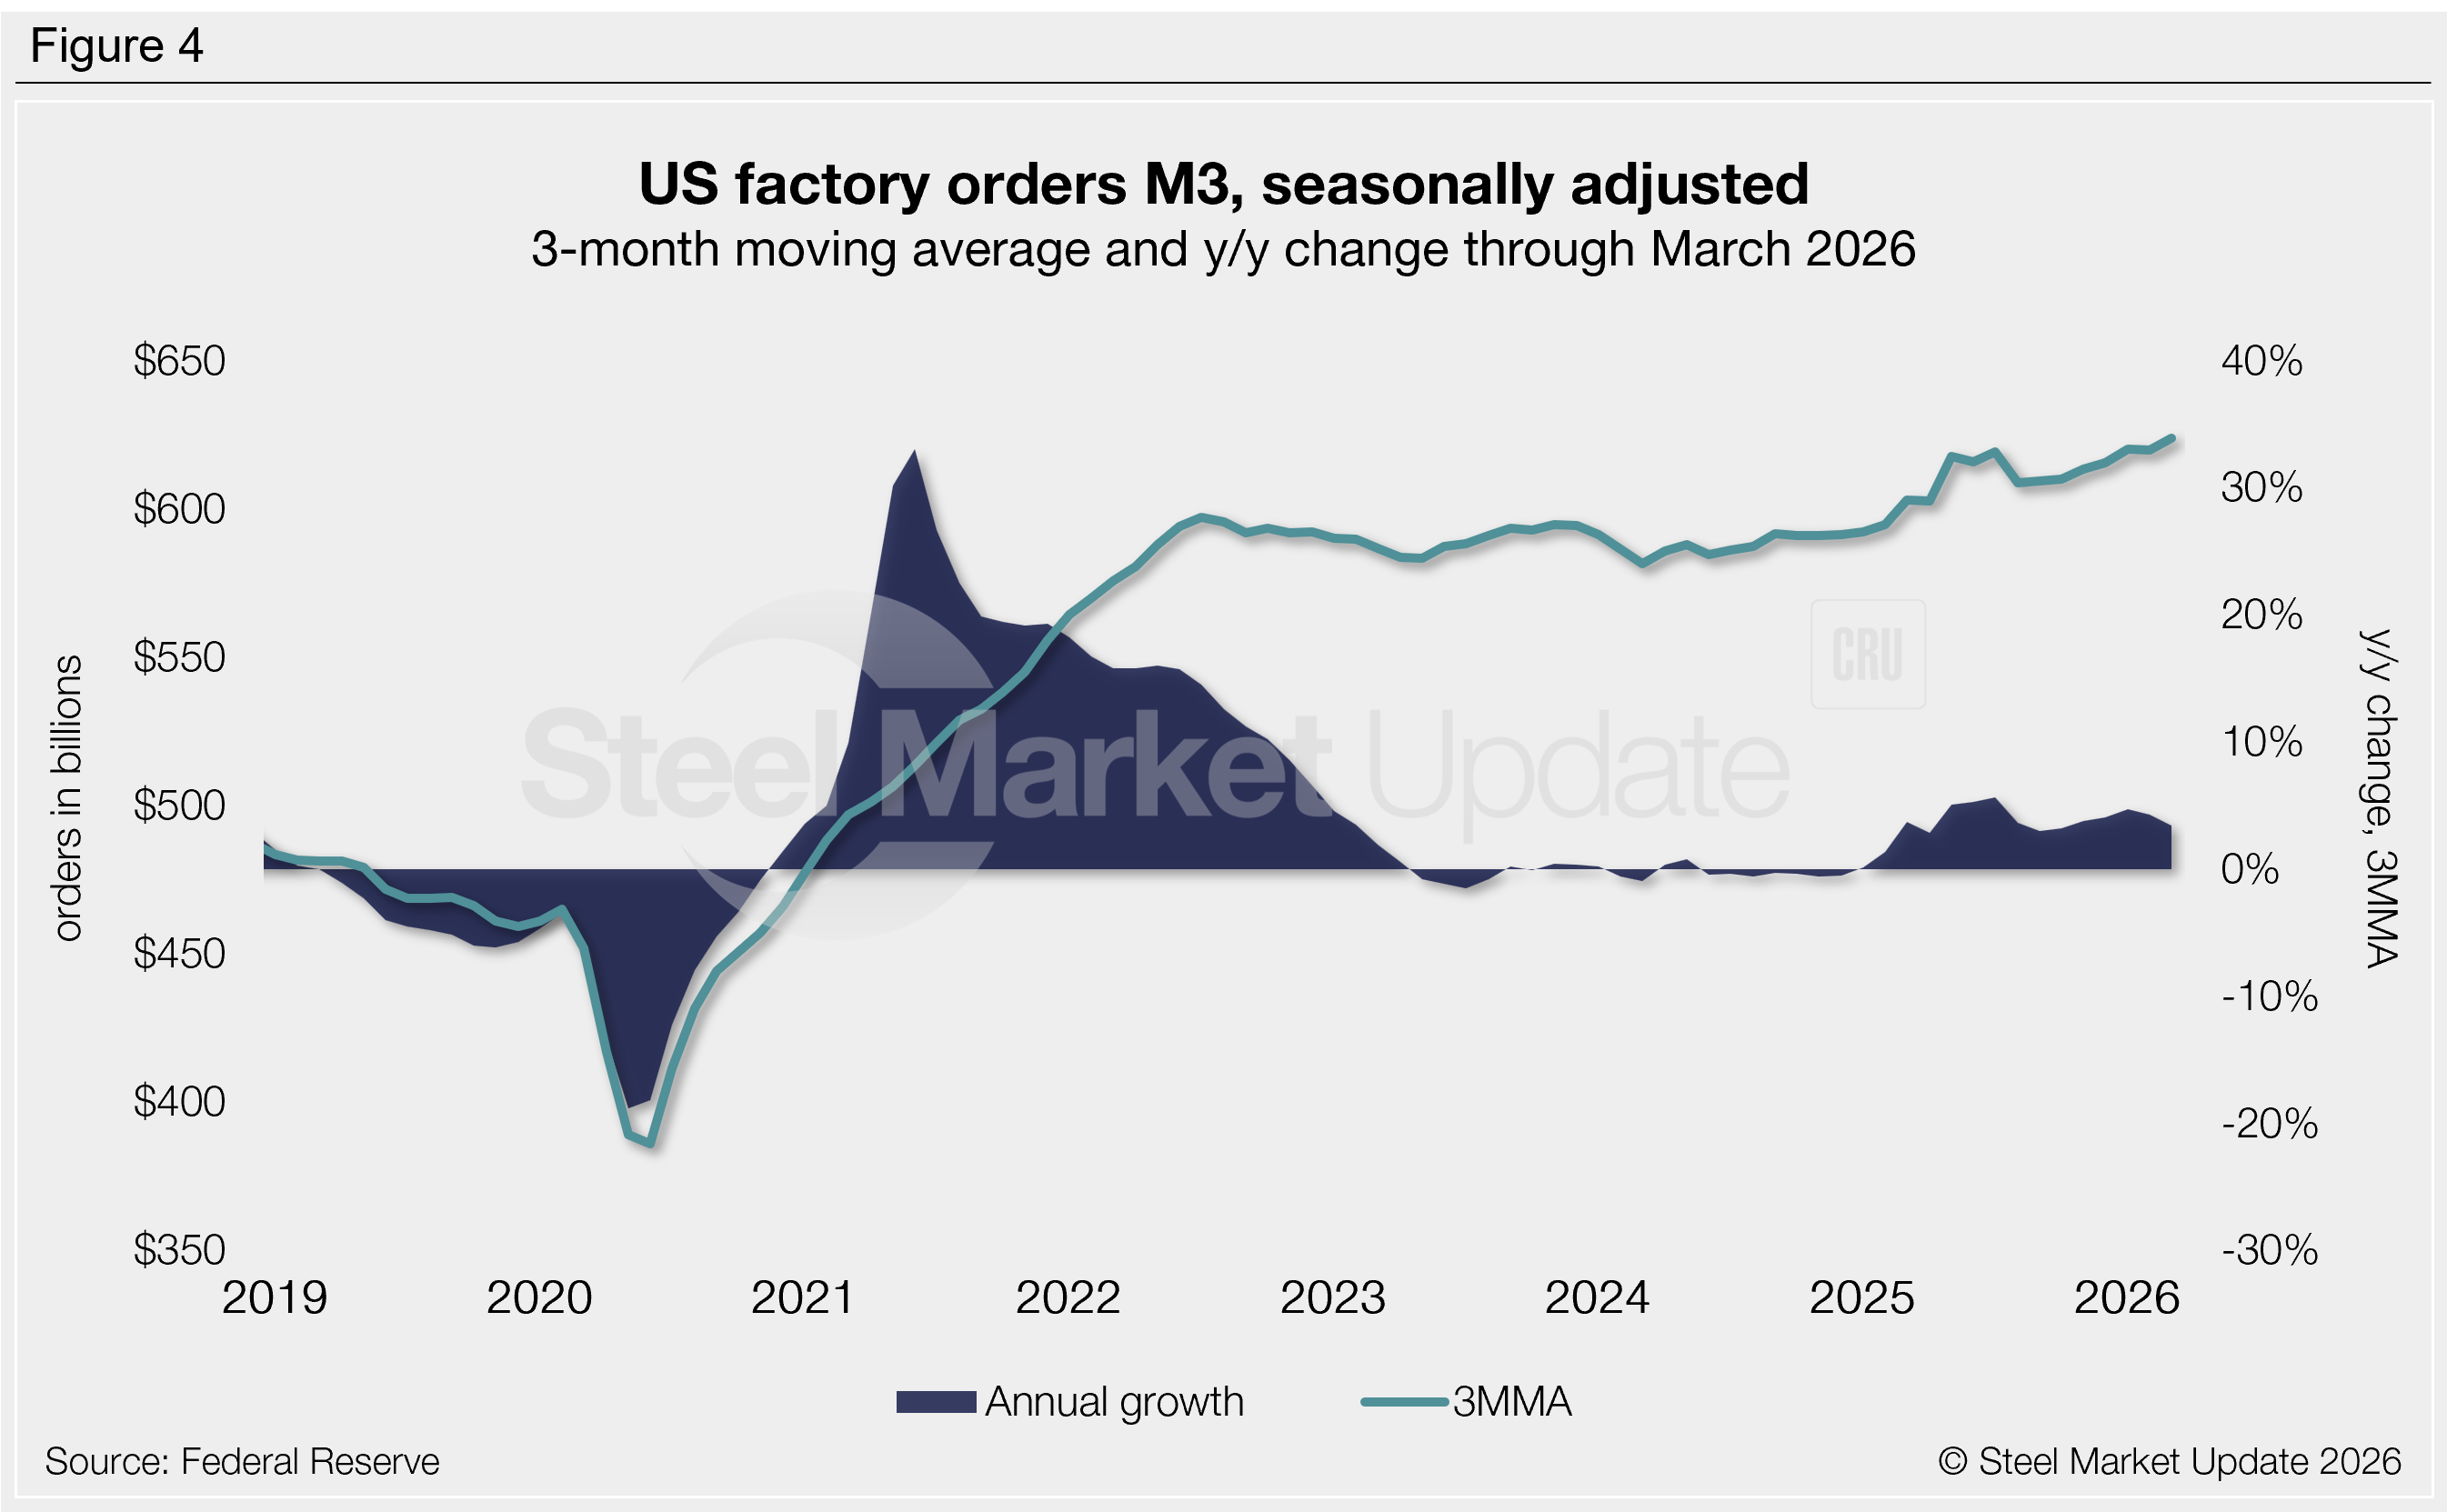
Factory orders for manufactured products
New factory orders for manufactured products also remain near historical highs, following the historically strong recovery seen in 2021 and 2022. The annual growth rate of new orders has strengthened over the past year, previously relatively stable in 2023 and 2024.
The 3MMA through March rose to a record-high $623.7 billion, up 3.4% from the same period of 2025 (Figure 4).
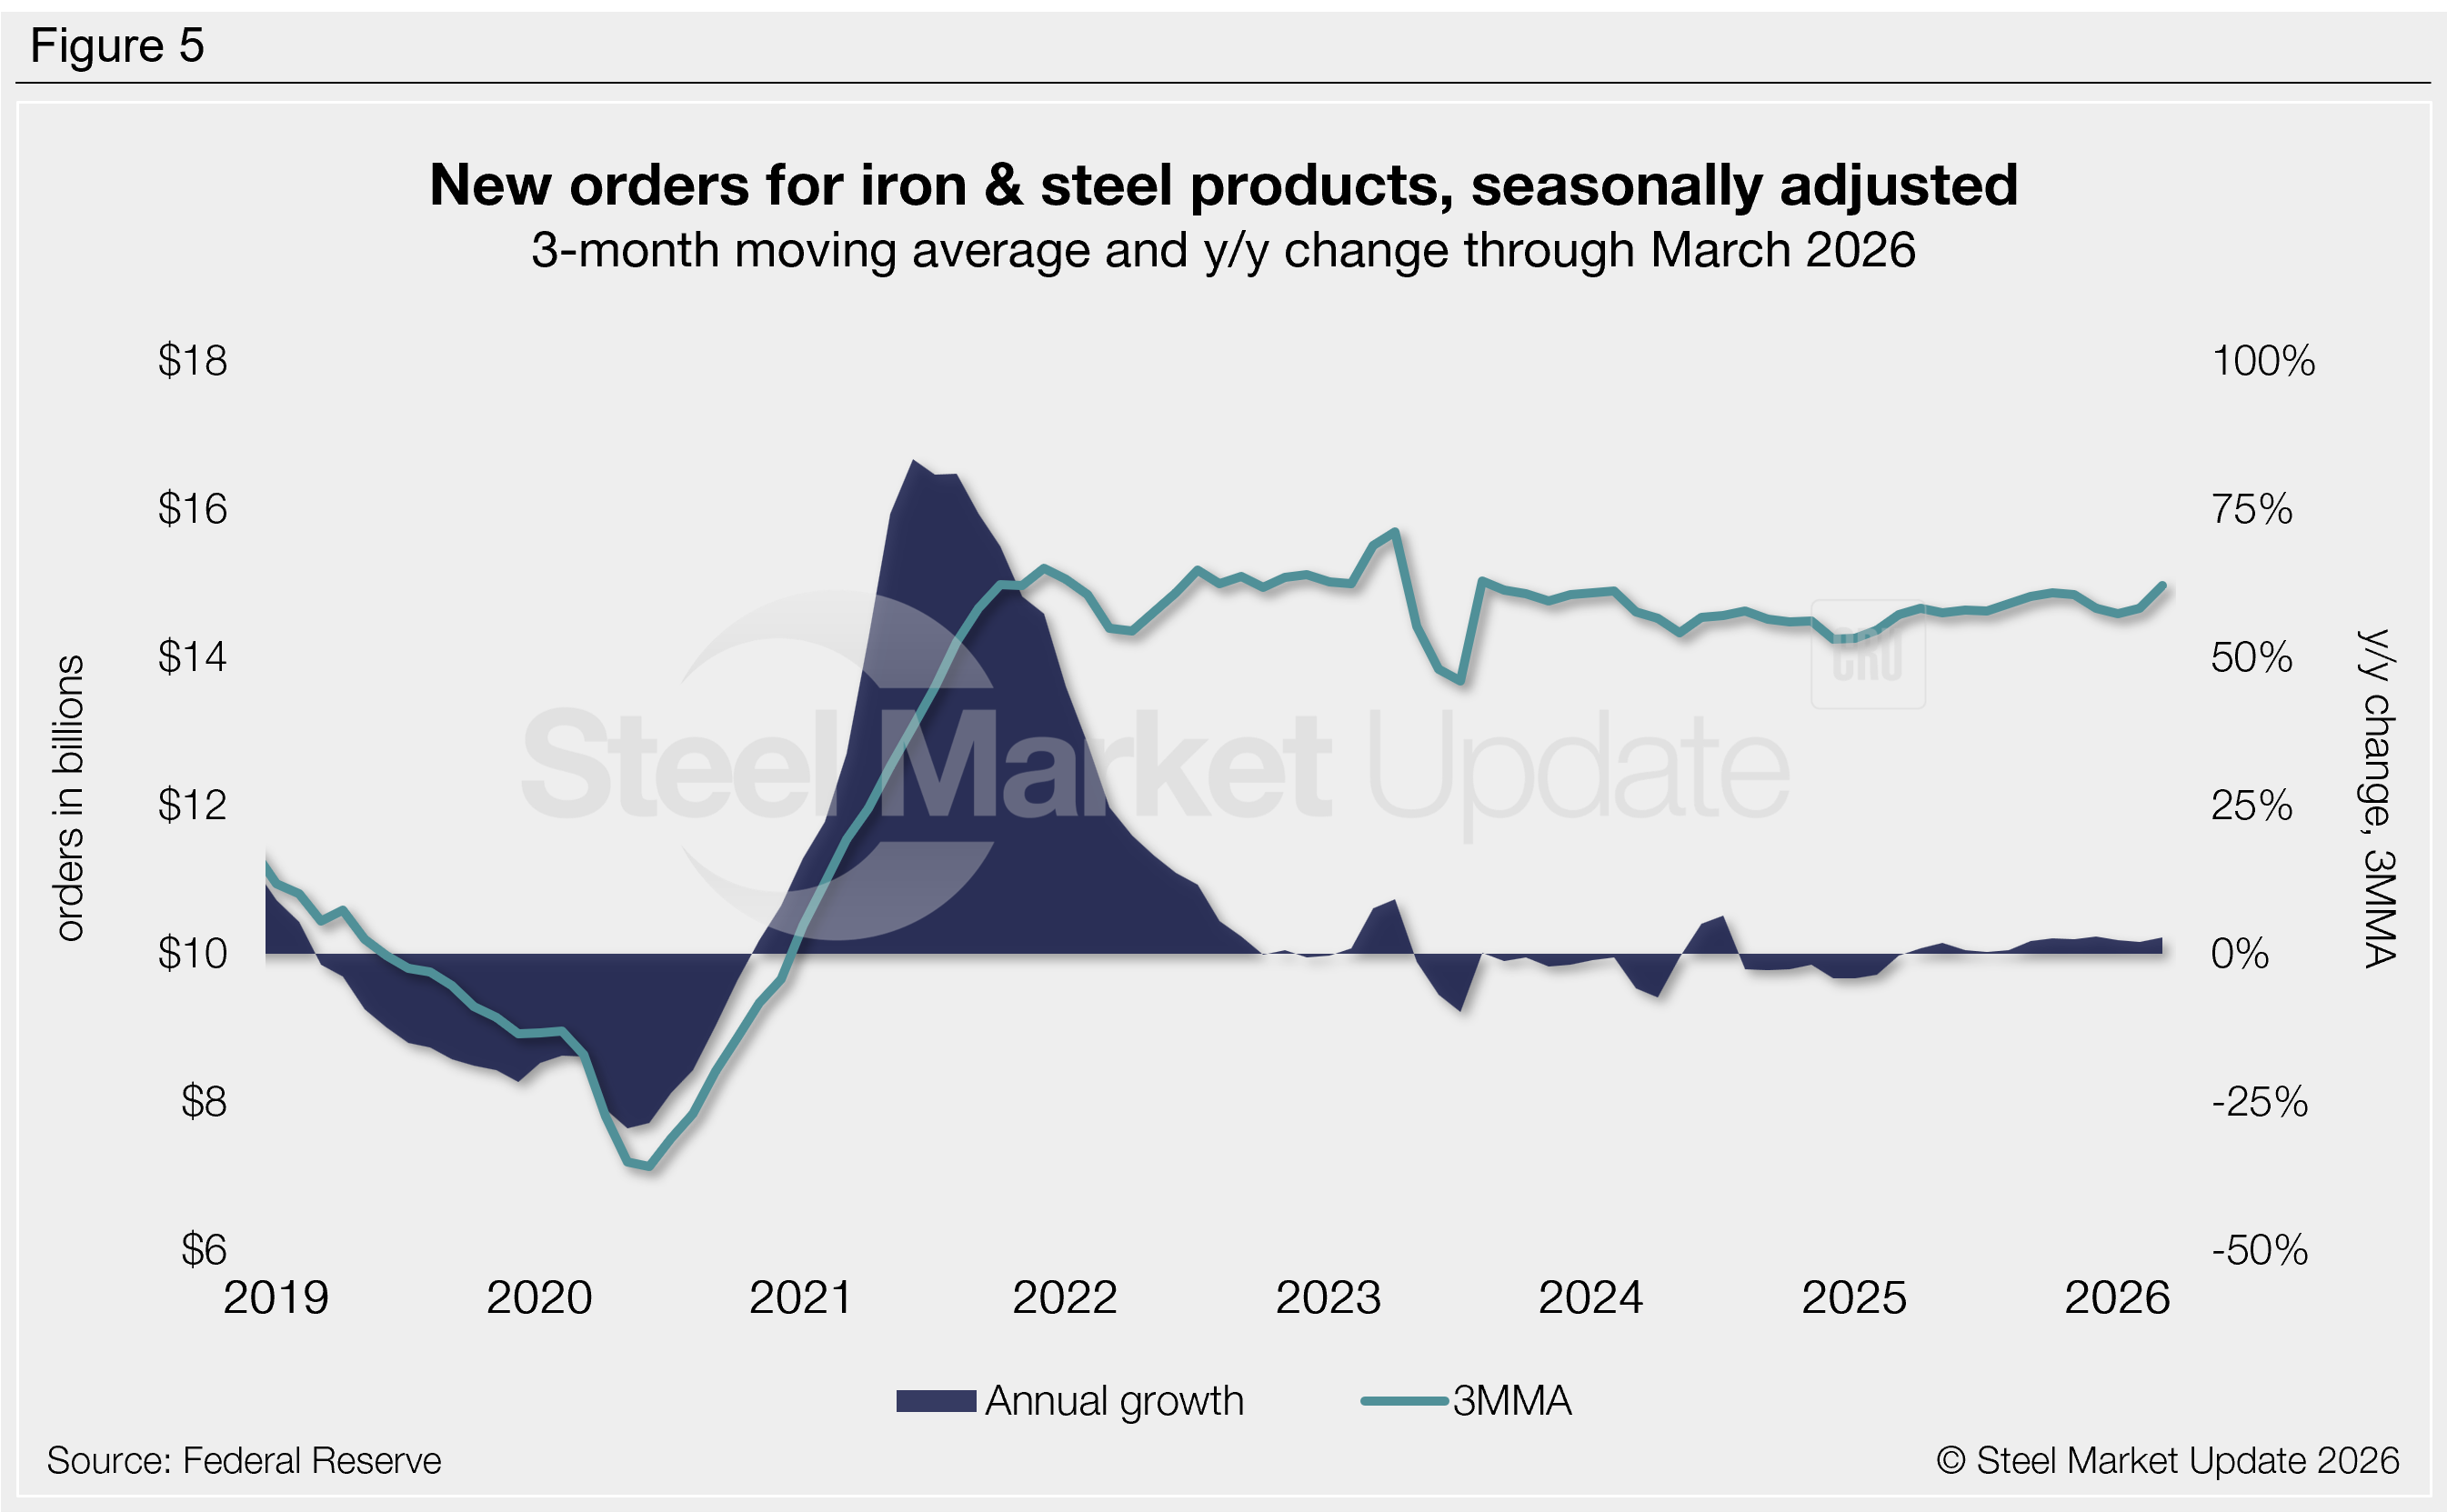
New orders for iron and steel manufacturing
Federal Reserve manufacturing data has a subsection for iron and steel products. Figure 5 shows the value of new orders for iron and steel products as a 3MMA. This measure saw remarkable growth in 2021 and 2022, reaching a record high 3MMA of $15.7 billion in April 2023.
The 3MMA through March rose to a two-and-a-half-year high of $15.0 billion. The annual growth rate has been minimal since late 2022, registering +2.7% through March, the 12th consecutive month of positive annual growth.
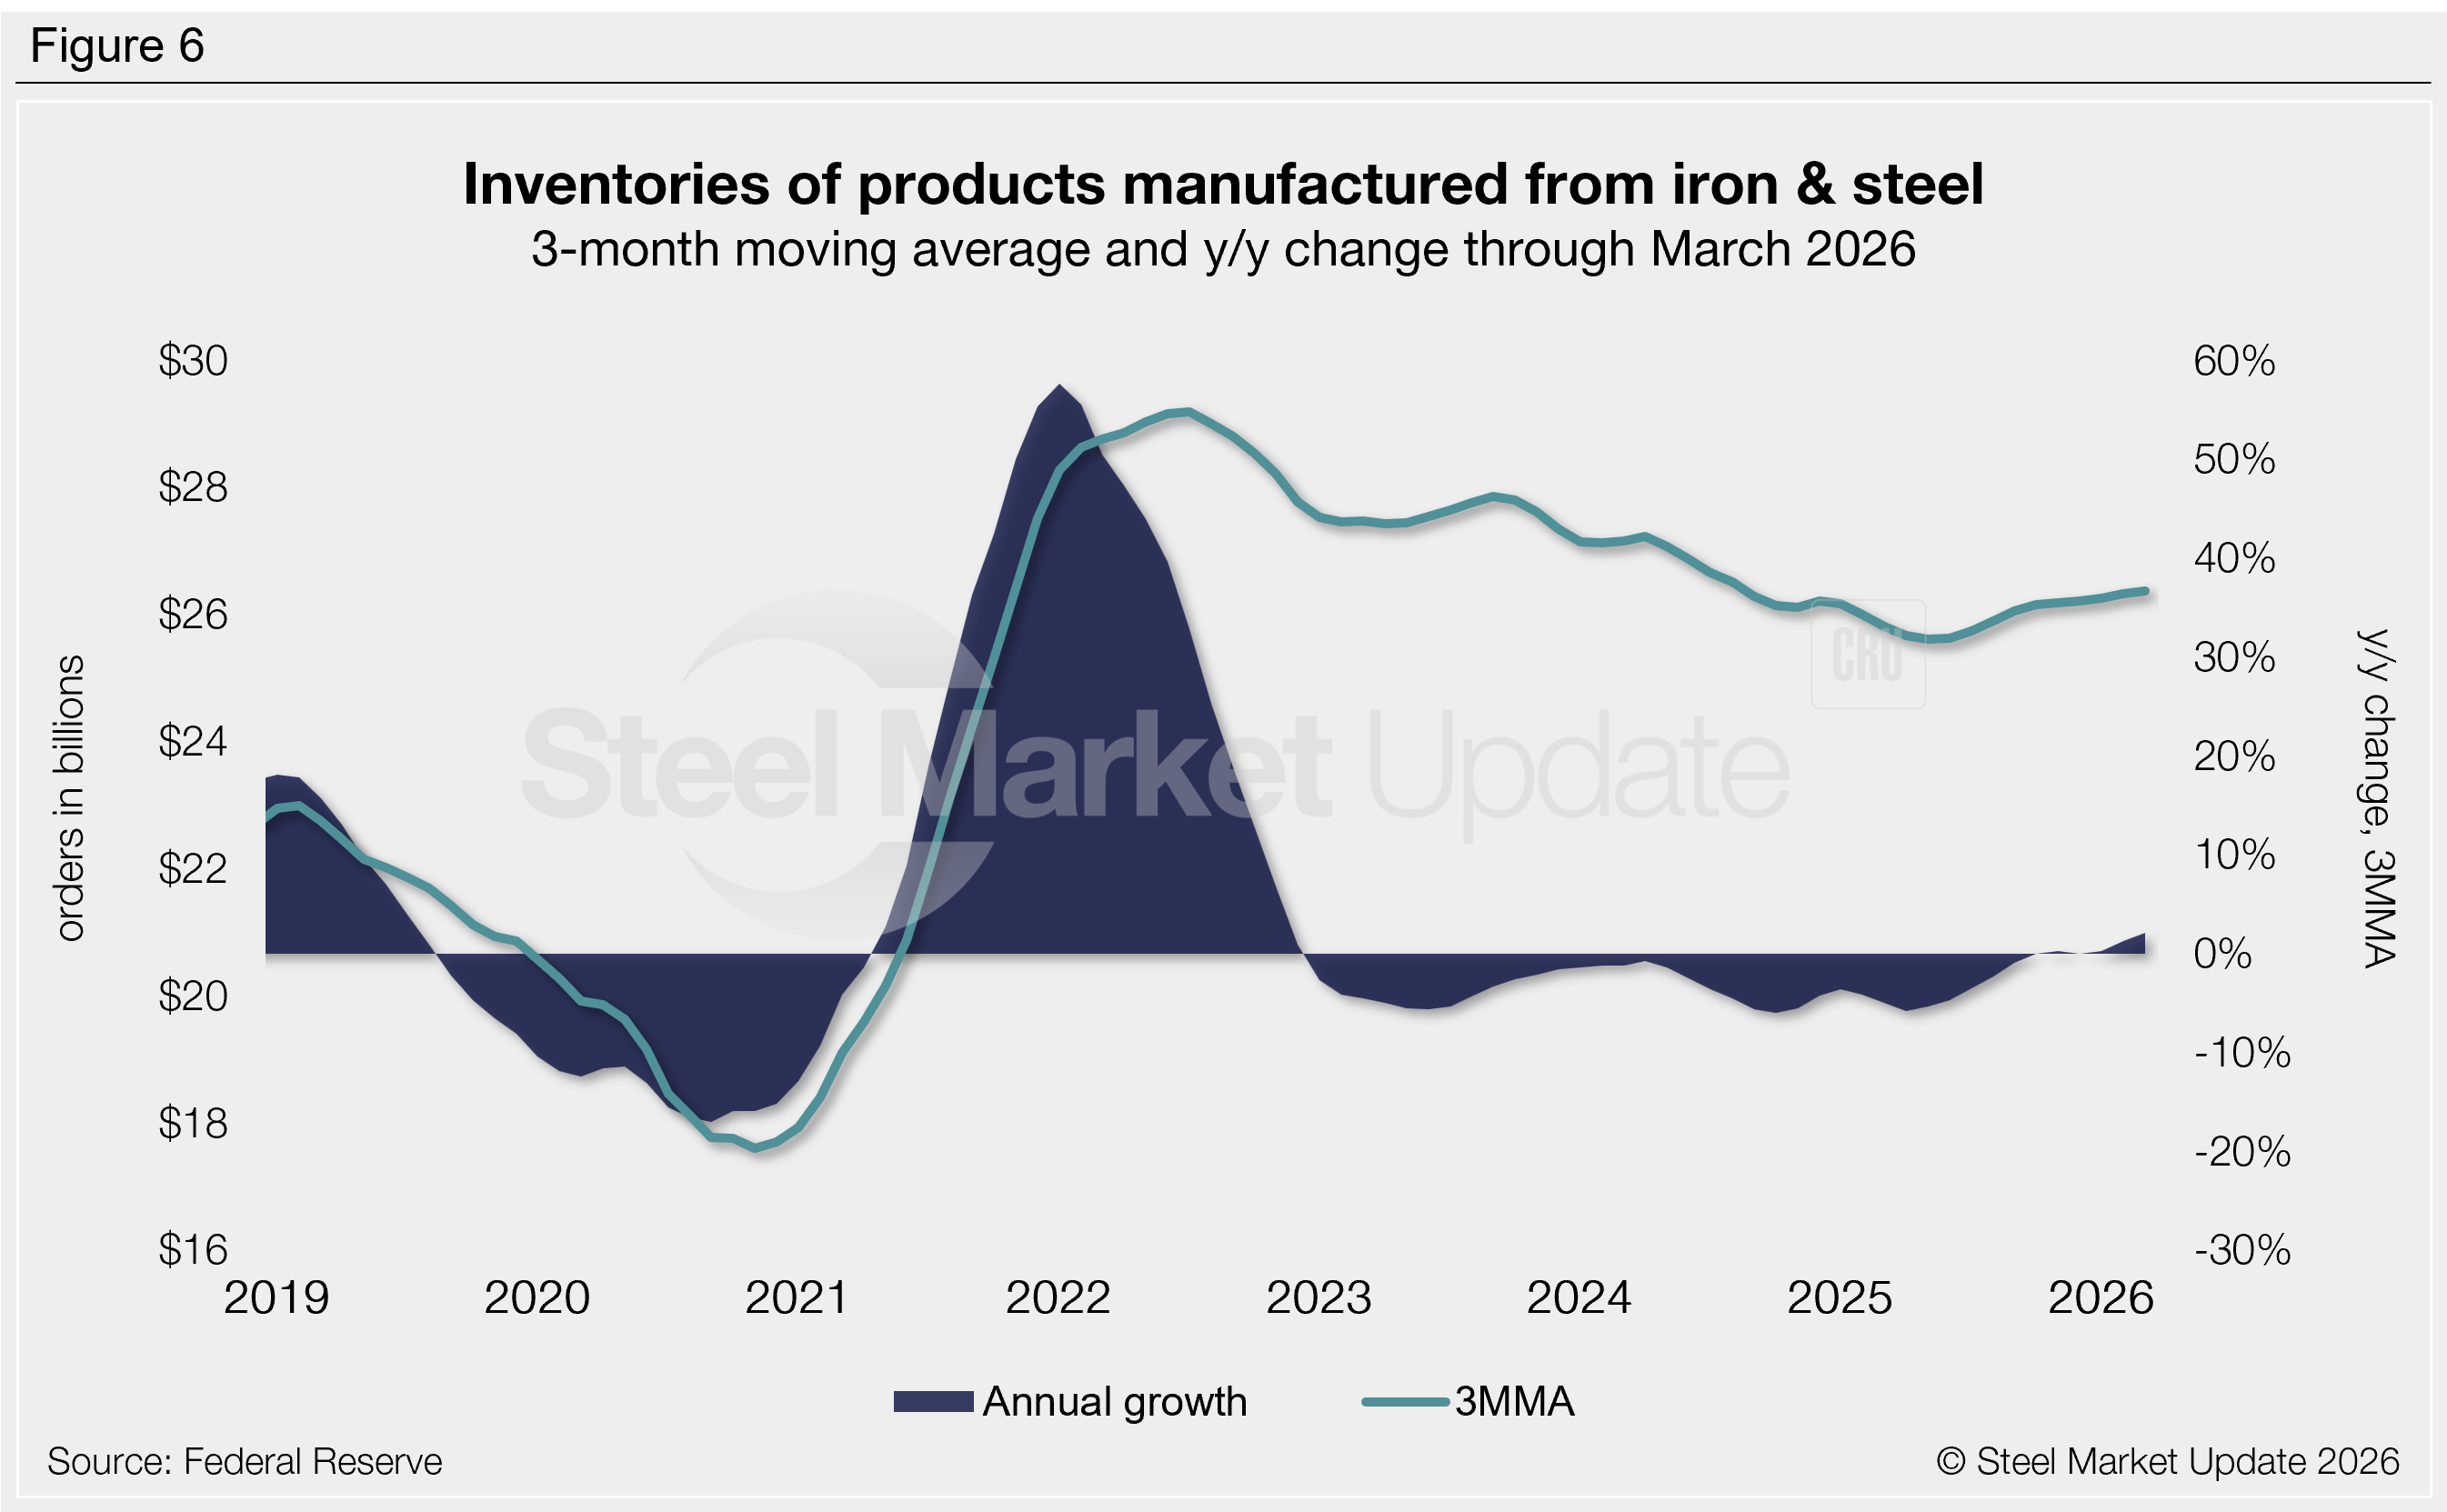
Inventories of products manufactured from iron and steel
Inventories of iron and steel products ended their multi-month streak of negative annual growth in late-2025 and have been gradually trending higher since (Figure 6).
The latest iron and steel inventory levels totaled $26.4 billion on a 3MMA basis through March, a 19-month high. This is up 2.2% compared to the same period one year prior.