Downstream Products
May 12, 2026
Heating and cooling equipment shipments increase through March
Written by Brett Linton
Total heating and cooling equipment shipments jumped 24% from February to March according to recently released Air-Conditioning, Heating, and Refrigeration Institute (AHRI) figures. This marks the second-highest shipment rate seen in the past 19 months and the largest month-to-month gain seen in four years.
Historically, shipments are strongest in the early summer months and weakest around the turn of the year, impacted by seasonal air conditioner and heat pump volumes.
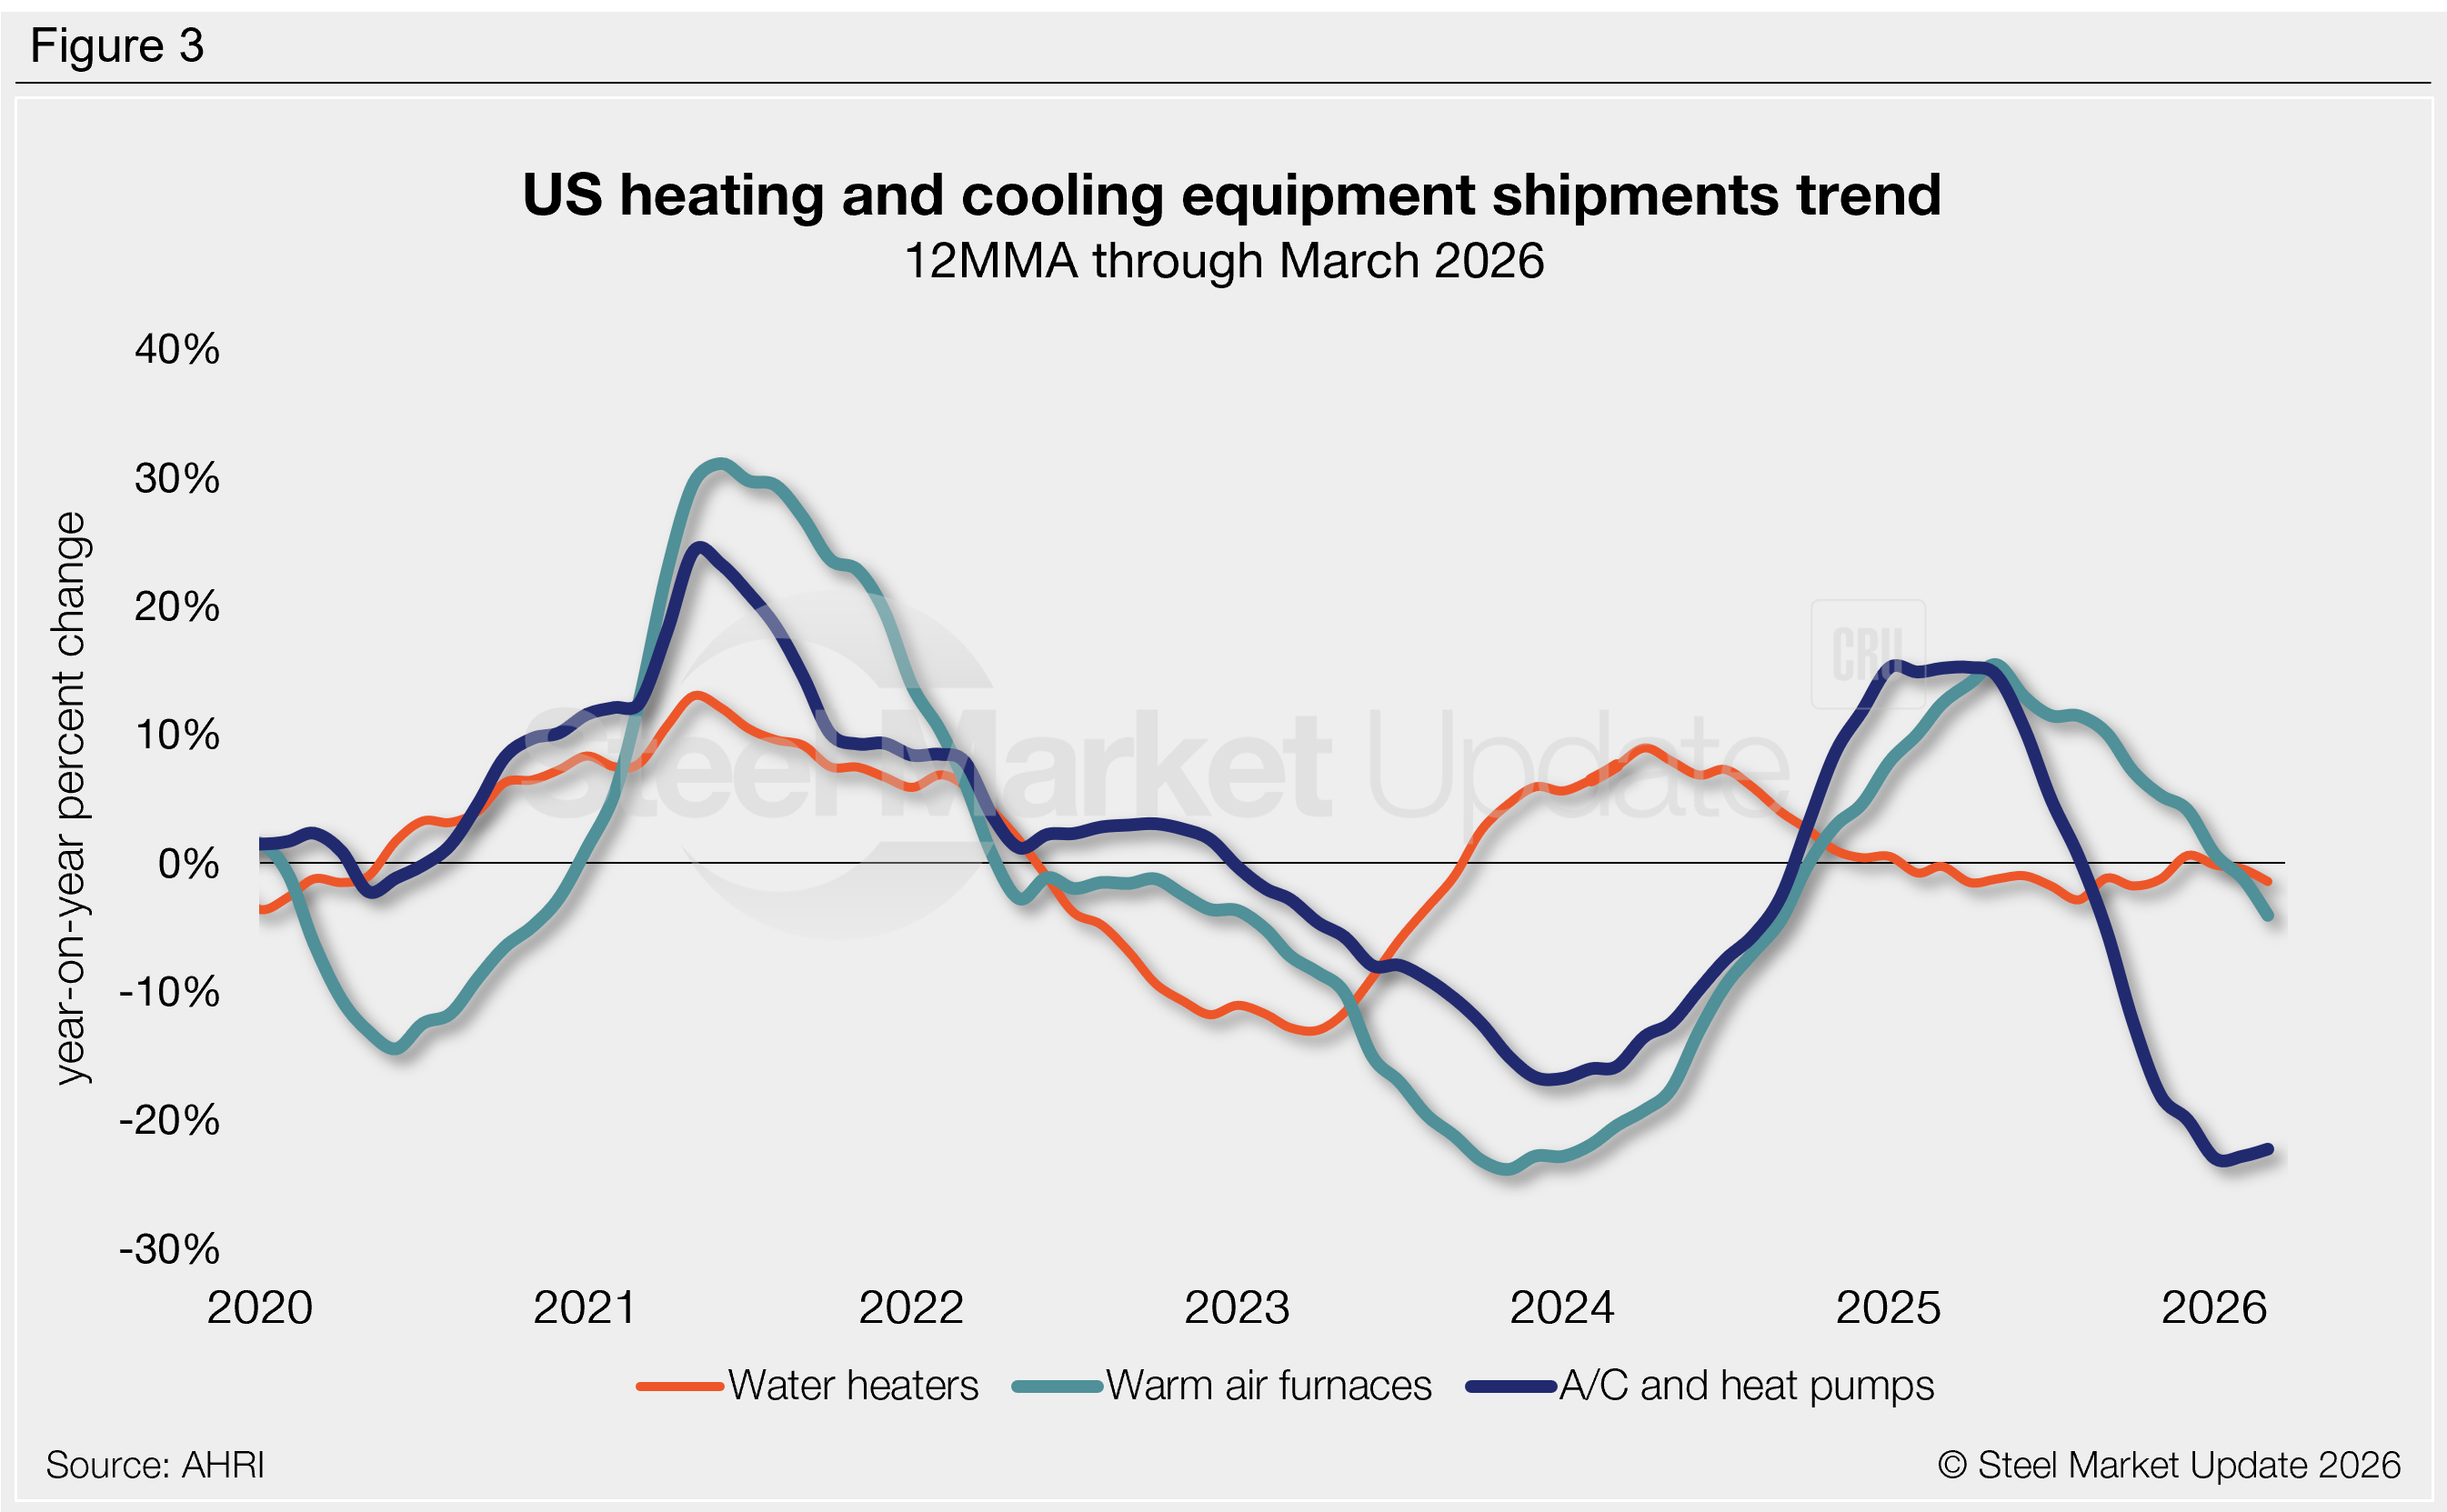
March shipments totaled 2.02 million units, down 2% compared to the same month last year (Figure 1, left). Shipments of water heaters, warm-air furnaces, and air conditioners/heat pump all increased month over month (m/m).
To smooth out seasonal movements, shipments can be annualized using a 12-month moving average (12MMA). On this basis, shipments have been trending lower for most of the past year following the two-year high of 1.89 million units seen last May. Through March, the 12MMA is down to a near-six-year low of 1.68 million units (Figure 1, right).
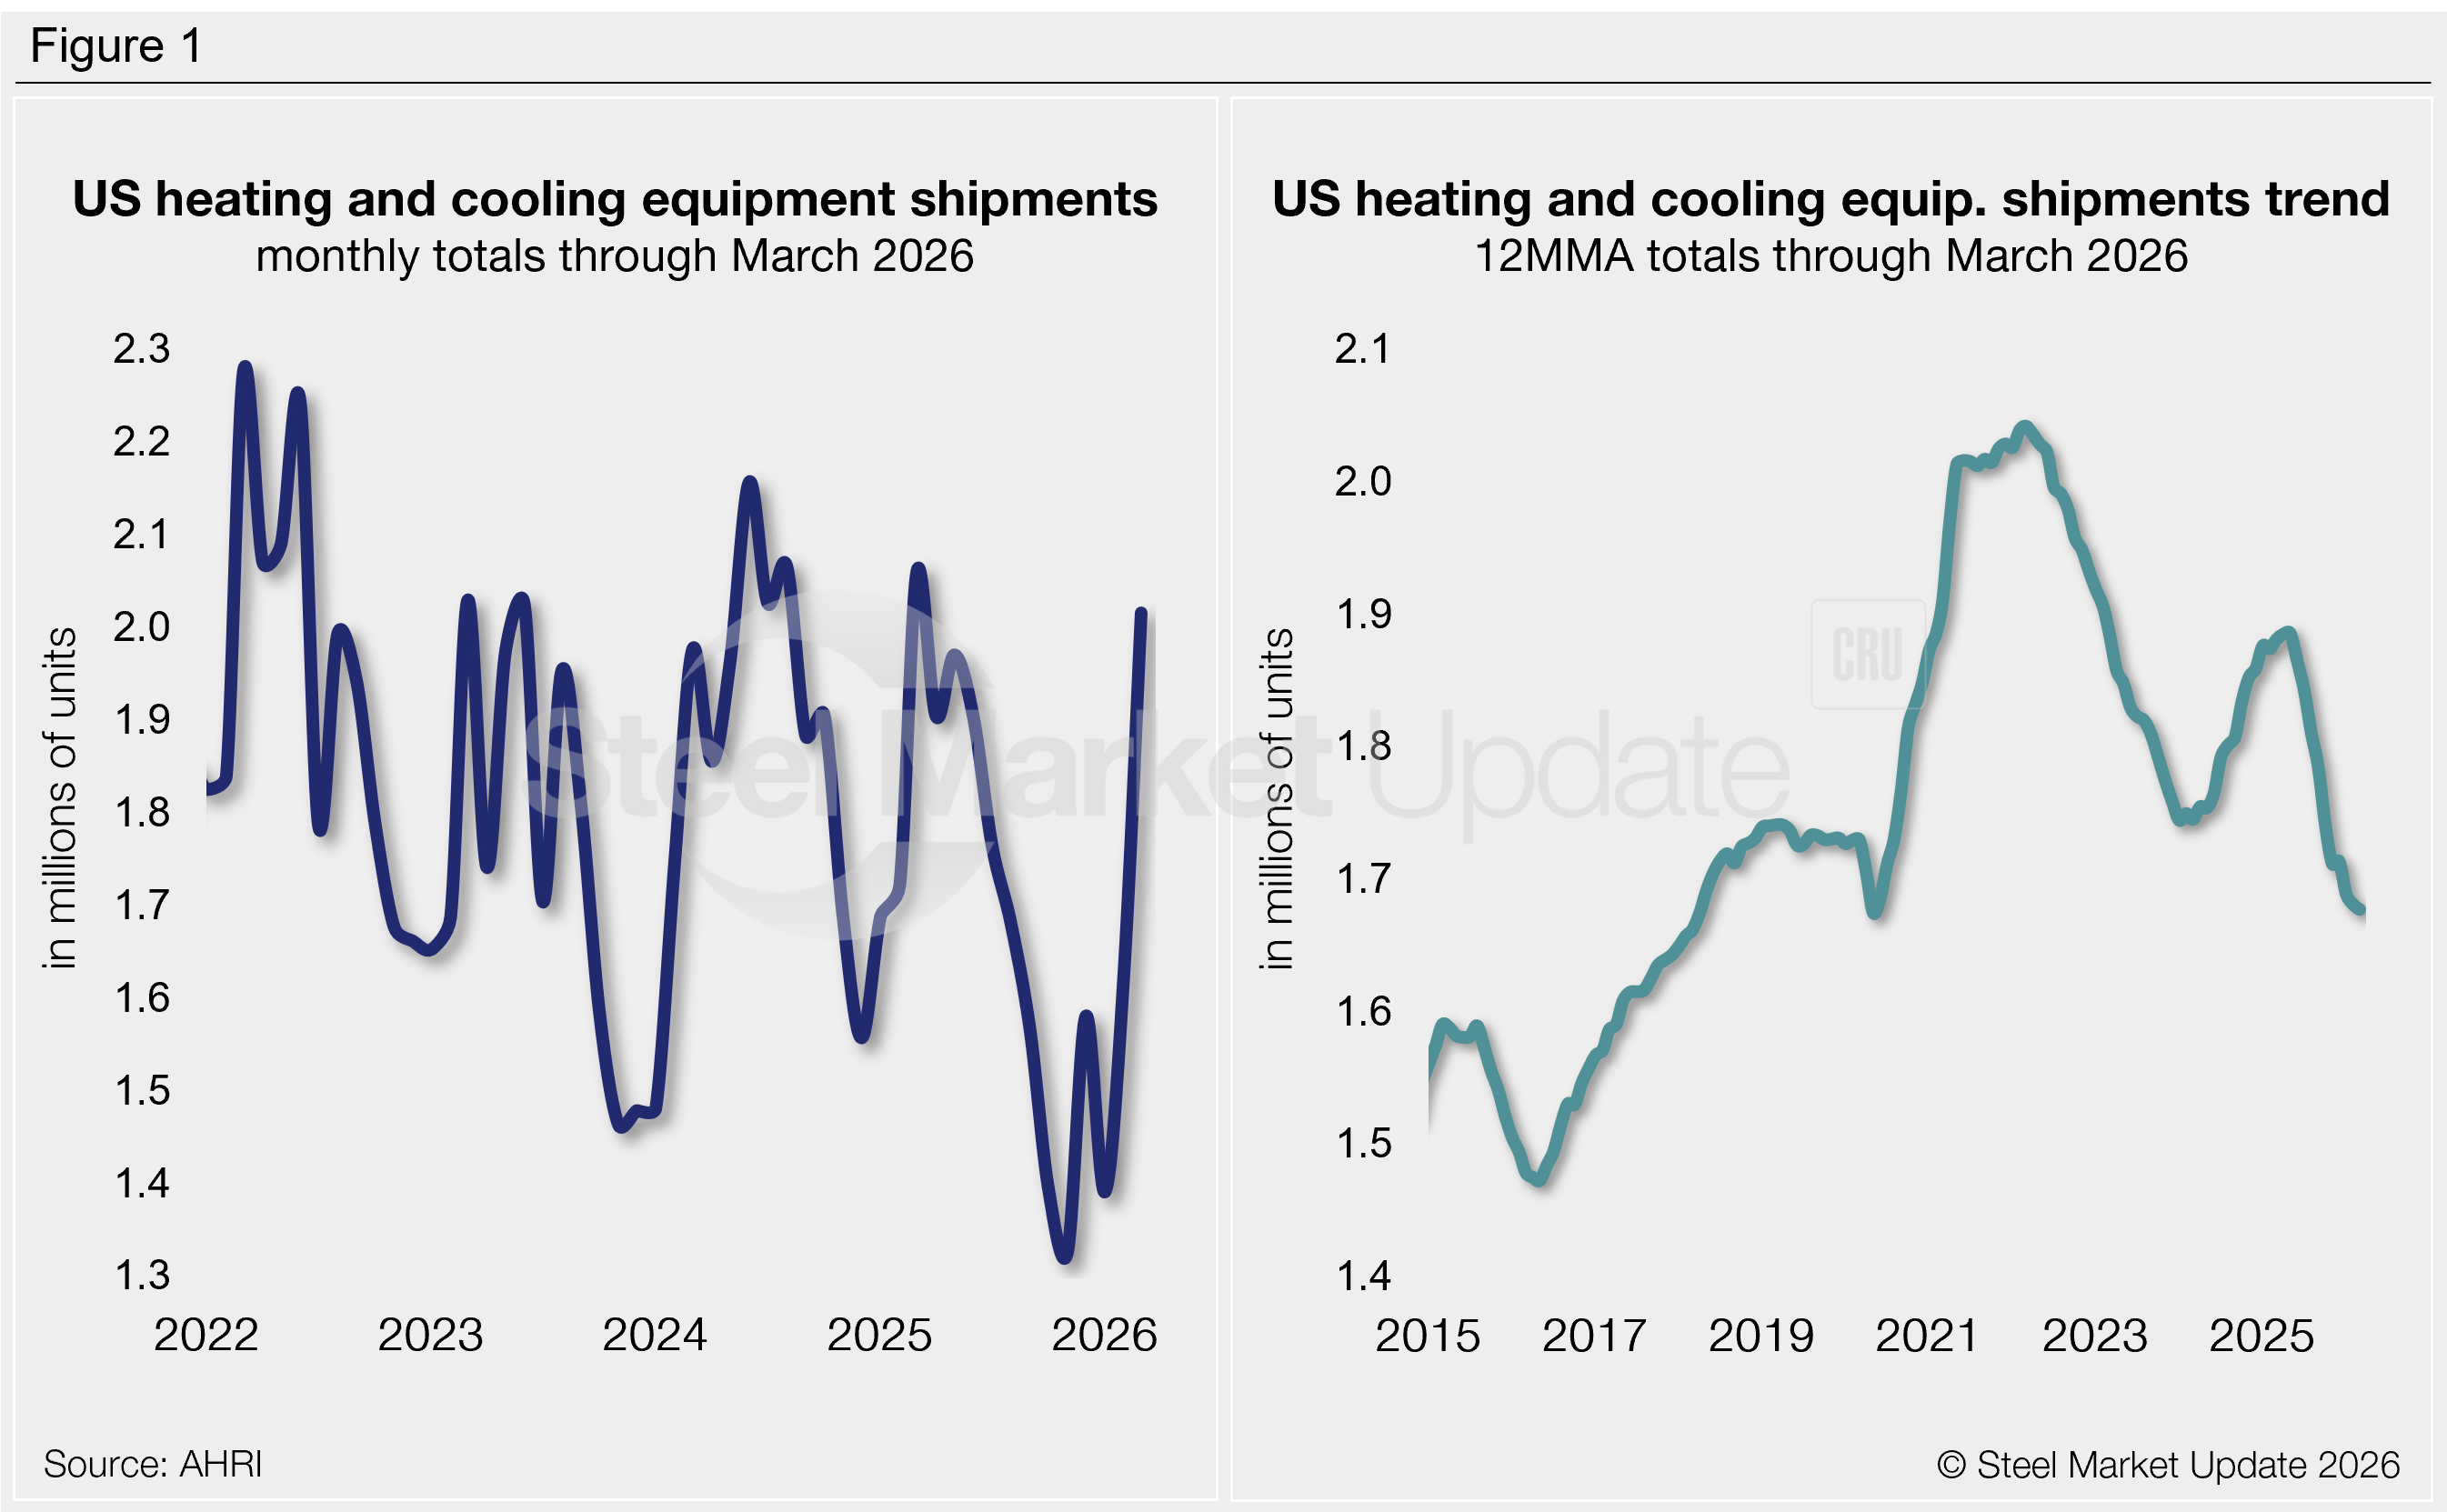
Shipments increased across all products
- Shipments of water heaters jumped 22% m/m in March to a one-year high of 903,000 units. Although trending higher, shipments were down 4% vs. this time last year.
- Warm-air furnace shipments rose for the second consecutive month in March to 256,000 units, further recovering from the near two-year low of 221,000 units set in January. Shipments were up 3% m/m but down 15% year over year (y/y).
- Shipments of air conditioners and heat pumps increased 34% m/m to 857,000 units. This marked the fourth consecutive monthly increase and was up 5% y/y. Recall that just four months prior, shipments fell to a ten-year low of 379,000 units. Note that these shipments are highly seasonal, as shown in Figure 2.
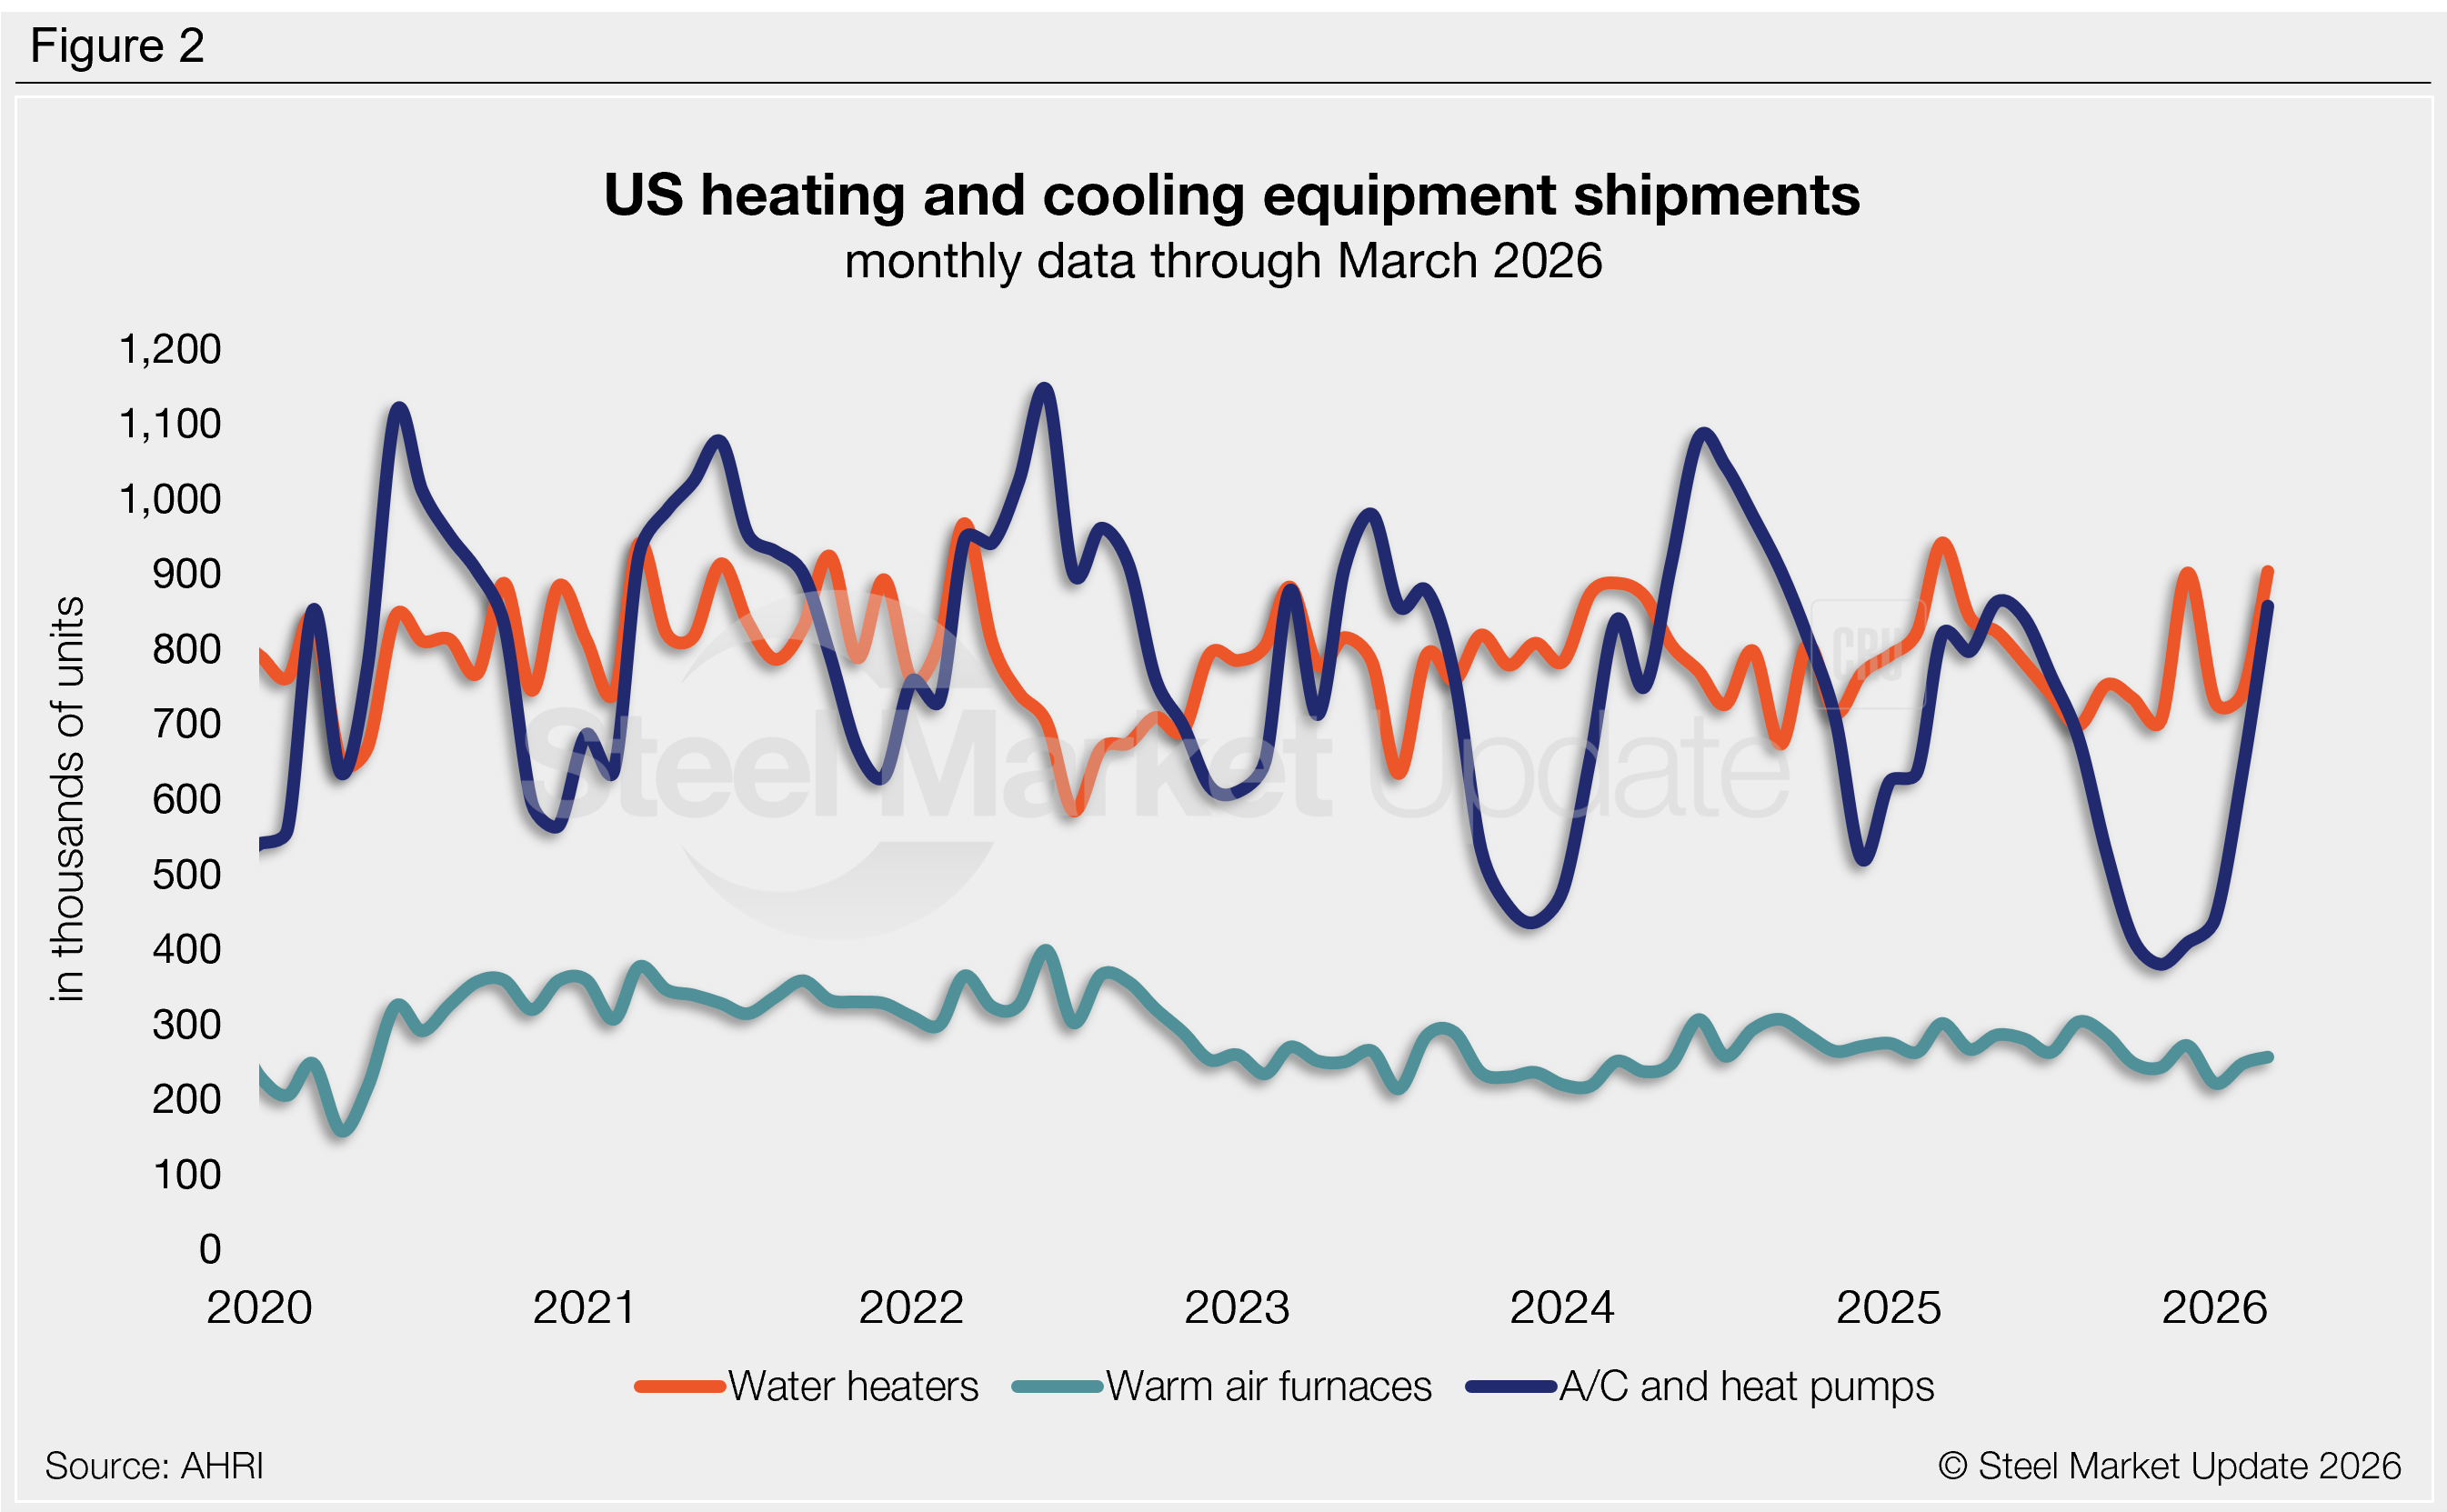
Annual comparisons
Figure 3 shows the annual growth rate of shipments by product on a 12MMA basis. From this perspective, annualized shipments are down for all three product groups:
- Annualized air conditioner and heat pump shipments were down 22% y/y, the seventh consecutive month to see negative growth. One month prior we saw the largest annual contraction rate in our 16-year data history (23%). This growth rate has been trending lower for nearly a year now.
- Annual warm-air furnace shipments were down 4% compared to the same period of the prior year. This marked the second month in a row with negative annual growth, a rate that has been trickling lower over the last year.
- Water heater shipments saw negative growth for the third consecutive month in March, down 1% y/y. This rate has trended steadily lower since peaking in mid‑2024.