
Analysis

May 21, 2026
HR Futures: Curve continues to move higher
Written by Gaby Ain
In my previous column on April 23, I posed a question: whether supply can respond sufficiently under current conditions. Since then, the US HRC futures curve has continued to move higher and further out, suggesting the market is questioning how quickly tightness can be resolved.
A month ago, the HRC forward curve (orange) was already reflecting a longer-lasting tightness scenario. The peak of the strip had shifted out to June and July, with futures breaching $1,100, and the deferred months had lifted into an approximate $1,000 band. A week ago (blue), the curve had repriced sharply, with the peak migrating to August-September area near $1,140. Today (white), the curve has strengthened again, with deferred months continuing to inch up.
CME Midwest HRC Futures Curve (5/21 in white, 5/14 in blue, 4/23 in orange)
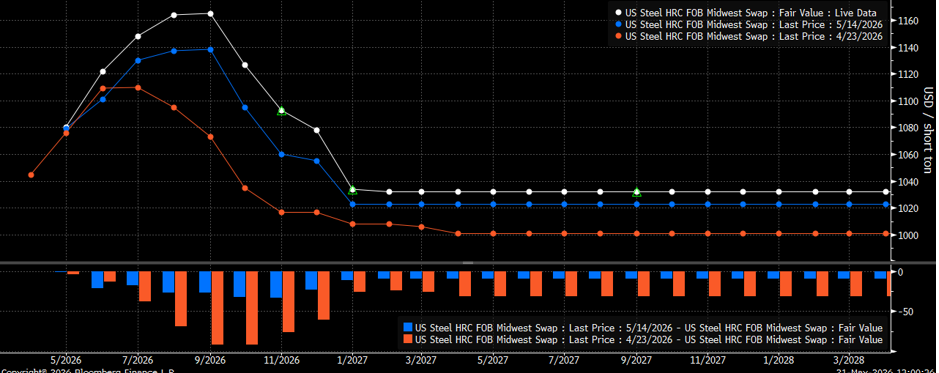
The key development is not simply that the curve has moved higher, but where the moves have occurred. Earlier in the rally, the market appeared to be pricing near-term scarcity against the expectation that eventual supply normalization would cool conditions. Recently, however, deferred pricing has continued to lift, and the peak continues to get pushed out. That suggests the market is reassessing not just tightness, but how quickly normalization can occur.
That reassessment is notable because domestic production continues to rise. Raw steel output is reaching multi-year highs, with utilization close to the max rate of 84.8%. Historically, production at these levels would typically begin easing lead times, rebuilding inventories, and anchoring deferred pricing stable or lower. So far, that has not occurred. Lead times remain extended, inventories have not meaningfully rebuilt, and the curve is ratcheting upward.
This contradiction has made the distinction between headline and effective supply increasingly important. Steel is being produced, but much of that output appears committed through contracts or delayed. As a result, flexible spot tons remain much tighter than aggregate production data alone would suggest.
Imports are the other key piece. Historically, extended lead times and elevated pricing eventually attracted foreign tons, helping impose discipline on domestic rallies. Today, that ceiling is far less visible. Imports are still present and have recently increased, albeit from very low levels, but they are not responding with the same speed, confidence, or scale. The 50% Section 232 tariff environment, AD/CVD exposure, melt-and-pour restrictions, geopolitical disruptions, and the capital risk of booking tons into an uncertain trade environment have impaired the import response function.
Demand has also played a role. Conditions are not universally strong, and this is not the broad-based demand environment seen during the post-pandemic surge of 2021. However, demand has remained firmer than market expectations. Activity has been sufficient to keep inventories lean even as domestic production rises. Demand doesn’t need to be booming; it only needs to exceed the system’s ability to replenish the marginal spot ton.
CME HRC Money-Manager Positioning
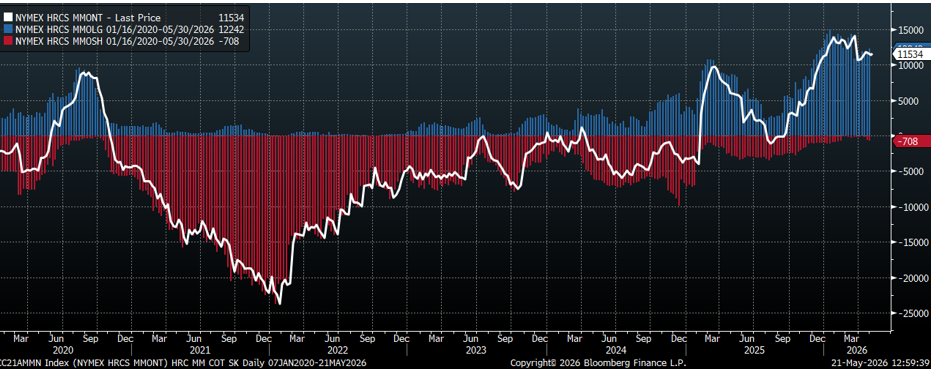
CME HRC money-manager positioning adds another layer. Despite the move higher in prices and the futures curve, positioning does not appear euphoric. Recent data show an increase in short positions, while longs have only moved modestly higher. That indicates some skepticism around the rally’s durability.
In prior cycles, higher prices solved higher prices through increased production, import influx, inventory rebuilding, demand destruction, etc. Those mechanisms are still present but appear to be operating with more friction. That may be the defining characteristic of this cycle: slow, rigid. Supply elasticity has weakened, and the system may be requiring higher prices for longer than previously expected. None of this means the market is immune to downside risks or cannot correct. But it suggests the timing and scale of supply relief remain less certain than in prior cycles.
Disclaimer: The content of this article is for informational purposes only. The views in this article do not represent financial services or advice. Any opinion expressed by Flack Global Metals or Flack Capital Markets should not be treated as a specific inducement to make a particular investment or follow a particular strategy, but only as an expression of his or her opinion. Views and forecasts expressed are as of date indicated, are subject to change without notice, may not come to be and do not represent a recommendation or offer of any particular security, strategy or investment. Strategies mentioned may not be suitable for you. You must make an independent decision regarding investments or strategies mentioned in this article. It is recommended you consider your own particular circumstances and seek the advice of a financial professional before taking action in financial markets.