

Product
February 4, 2013
SMU Construction Analysis: CPIP
Written by John Packard
 Written by: Peter Wright
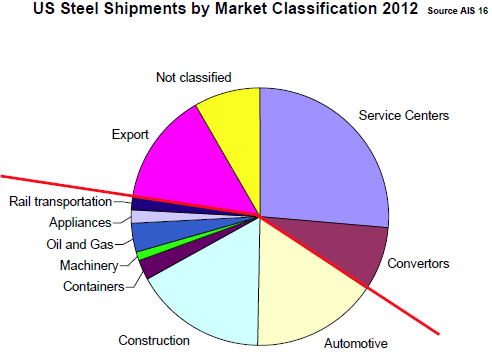
Raw steel production in 2012 was 97.8 million tons, up by 3.5 million tons from 2011. Steel mill shipments direct to the construction industry in 2012 were 15.6 million tons, (Figure 1). Shipments from service centers and converters to the construction industry are not classified but by proportion are about 12 million tons. In addition, steel consumption in the production of transportation equipment for construction products, off highway equipment, cranes, etc. is considerable. Therefore the total impact of construction on domestic steel demand is in the order of 30 million tons per year or about 30 percent of total steel mill shipments.
 In-order to forecast steel demand it is necessary to examine steel consumption by market segment and to project the performance of each. For example the two major consumption sectors, automotive and construction, have been performing very differently since the recession and therefore have to be forecast separately along with the other minor segments.
The Commerce Department releases construction expenditure data by market on the first working day of each month, referred to as “Construction put in place” or CPIP. This in turn has to be considered by sub sector since sectors do not move synchronously and are affected by supply and demand fundamentals and sources of financing. CPIP is reported for multiple project types within the categories, “Private” and “State and Local.”
Monthly data is notoriously erratic and frequently the media do back flips over a single data point when in reality they should be considering a three month moving average, (3MMA). In the case of construction, seasonality is also a very prevalent influence on monthly and quarterly data therefore to remove this effect it is useful to consider a rolling 12 months and to use this to calculate the year over year growth rate, (12MMA).
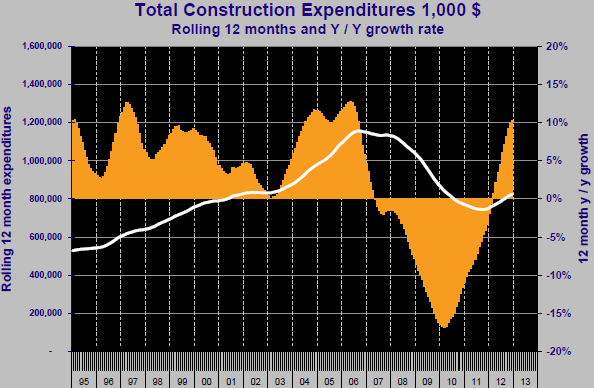
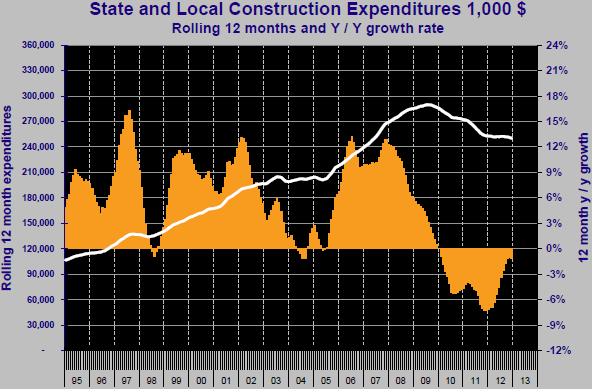 Figures 2, 3 and 4 show the rolling 12 month expenditures and annualized growth rate for, total, privately financed and state and local government financed construction respectively. Total construction is growing at an annual rate of 10.3 percent, very good news for future steel consumption but the difference between the two sources of finance is extreme as shown in Figures 3 and 4. Privately financed construction is growing at an annualized rate of 16.1 percent and had 12 consecutive months of positive growth in 2012. Publicly financed work contracted 1.1 percent in 12 months through December and has contracted every month since February 2010.
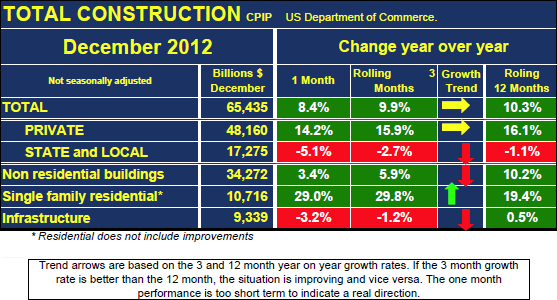
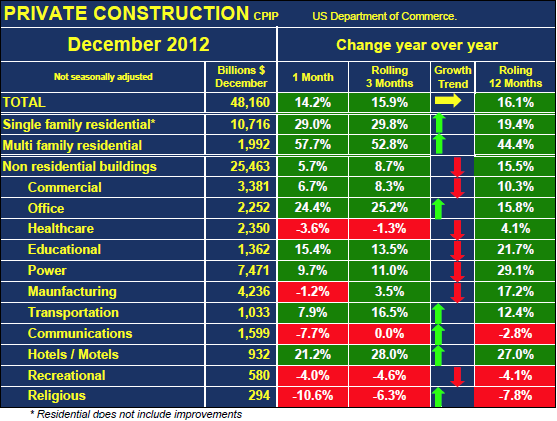
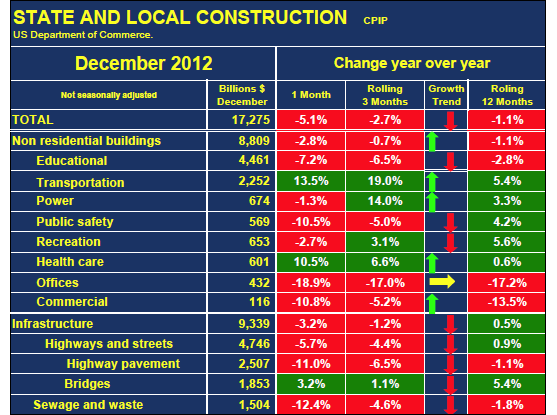
Table 1 gives a breakdown of total construction into public, private and identifies three of the major categories. These are non residential buildings, single family residential and infrastructure. The growth trend arrows reflect the difference between the 3 and 12 month year over year growth rates. If the 3 month rate is > 12 month rate the situation is improving and vice versa.
The growth rate of private construction has slowed. From a forecast point of view we need to consider both commercial property prices and vacancy rates which are both improving though not dramatically. The growth rate of this sector will likely continue at around 15% at least through 2013. Table 2 shows the detail of private construction by project type. Residential construction is the highlight of this sector, particularly multi-family which grew at an annualized rate of 44.4% in 2012. This we believe to be key to the economic recovery as it indicates that personal deleveraging is waning and consumer wealth in terms of household equity is recovering. This will drive personal consumption in 2013 and beyond, will power the economic recovery and promote the growth of steel consumption.
Public construction continues to contract though the rate of contraction has slowed in the last nine months based on the 12 MMA. Table 3 shows the detail of public construction by project type with major subdivision into non residential building and infrastructure. There are two considerations in forecasting the performance of this sector through 2013 and beyond. The tax receipts of both state and local governments have recovered to pre-recessionary levels but the lost revenue since the recession and the increasing levels of entitlement obligations means that states, in particular, will be short of discretionary wealth for many years to come. Publically funded non residential building construction will therefore not recover any time soon. Infrastructure is also primarily funded by state and local government but the future performance of this sector is clouded by attitudes in Congress. In all probability, given the negative publicity that has surrounded the decline of our infrastructure, the Federal Government will step in and provide stimulus funding but the timing of such is very unclear at present.
The bottom line for steel suppliers to the construction industry is that companies should focus on privately funded work and use Table 2 as an indicator of activity level by project. Publicly funded non residential building is dead and companies should watch for a shift in attitude in Washington regarding future activity in the infrastructure sector.


