

Product
August 22, 2013
The Chicago Fed National Activity Index & Steel Consumption
Written by Peter Wright
Indicators Suggest No Significant Growth in Steel for the Balance of 2013
The Chicago Fed National Activity Index (CFNAI) and steel consumption.
The following is an abridged version of the Chicago Federal Reserve statement plus graphical analysis by Steel Market Update. The index is a weighted average of 85 indicators of national economic activity drawn from four broad categories of data: 1) production and income; 2) employment, unemployment, and hours; 3) personal consumption and housing; and 4) sales, orders, and inventories. A zero value for the index indicates that the national economy is expanding at its historical trend rate of growth; negative values indicate below-average growth; and positive values indicate above-average growth.
When the CFNAI-MA3, (three month moving average) value moves below –0.70 following a period of economic expansion, there is an increasing likelihood that a recession has begun. Conversely, when the CFNAI-MA3 value moves above –0.70 following a period of economic contraction, there is an increasing likelihood that a recession has ended. When the CFNAI-MA3 value moves above /+0.70 more than two years into an economic expansion, there is an increasing likelihood that a period of sustained increasing inflation has begun.
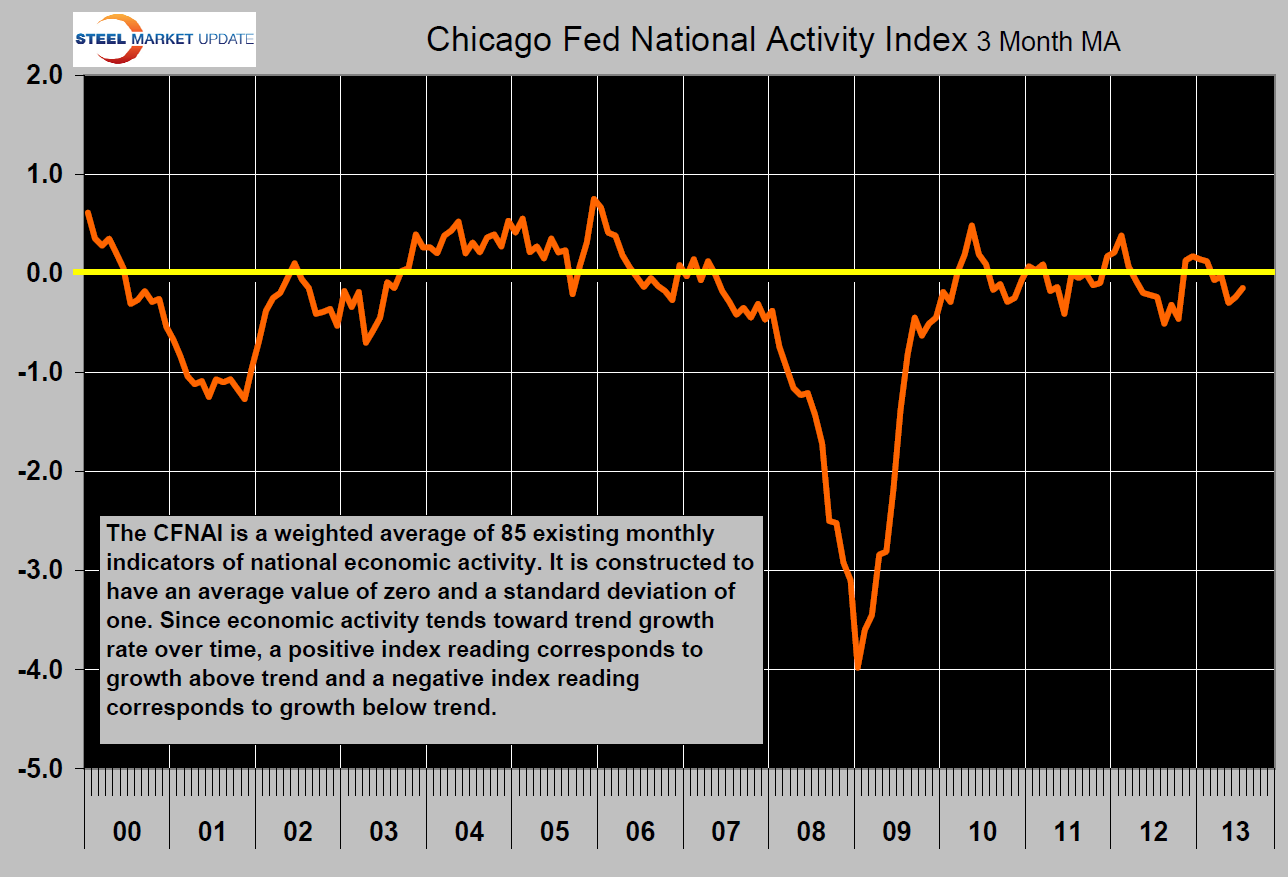 The (CFNAI) edged up to –0.15 in July from –0.23 in June, (Fig 1). Three of the four broad categories of indicators that make up the index increased slightly from June, but only two of the four categories made positive contributions to the index in July, (Fig 2). The CFNAI-MA3, increased to –0.15 in July from –0.24 in June, marking its fifth consecutive reading below zero. July’s CFNAI-MA3 suggests that growth in national economic activity was below its historical trend. The economic growth reflected in this level of the CFNAI-MA3 suggests subdued inflationary pressure from economic activity over the coming year.
Thirty-eight of the 85 individual indicators made positive contributions to the CFNAI in July, while 47 made negative contributions. Fifty-three indicators improved from June to July, while 32 indicators deteriorated.
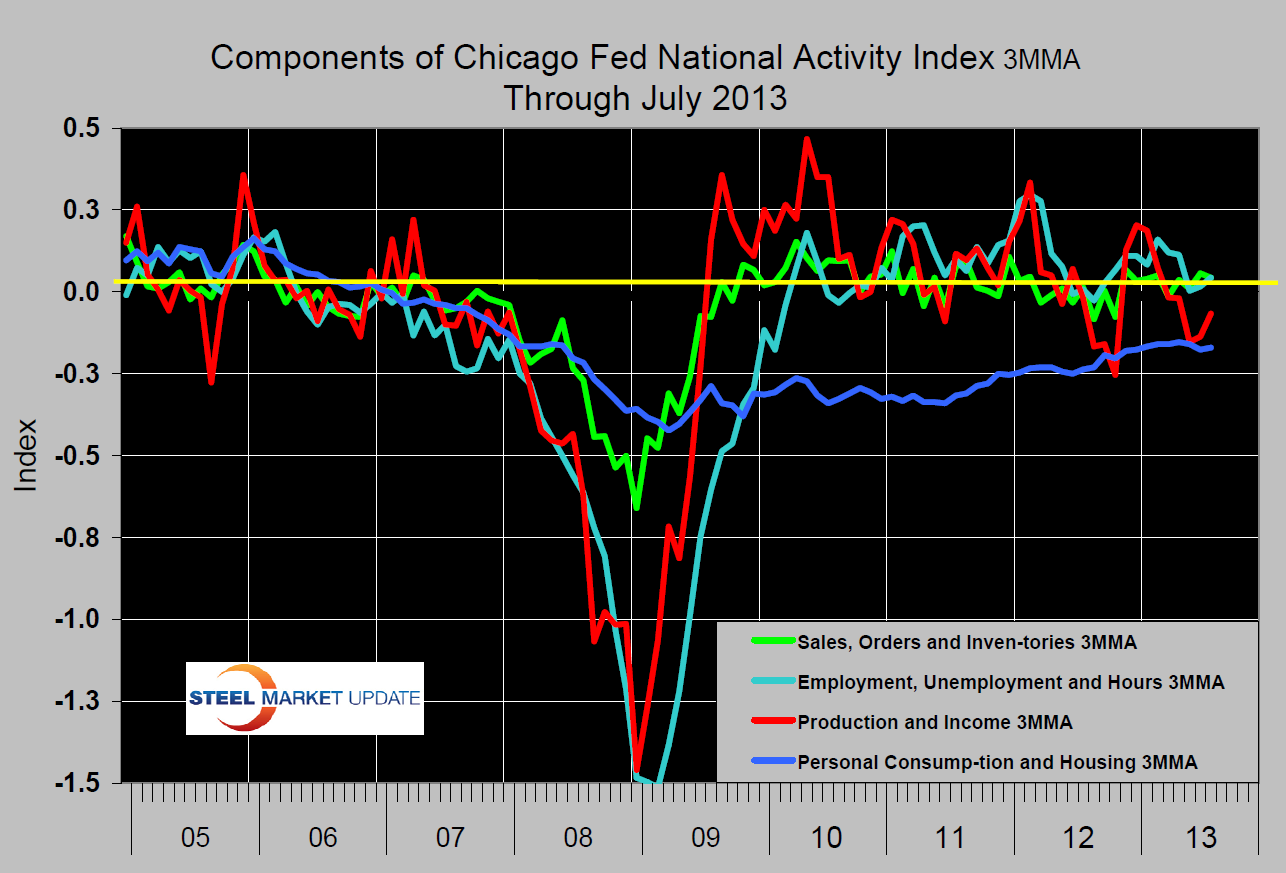 The contribution from the sales, orders, and inventories category to the CFNAI increased to +0.04 in July from –0.07 in June. The Institute for Supply Management’s Manufacturing Purchasing Managers’ New Orders Index rose to 58.3 in July from 51.9 in the previous month. The contribution from the consumption and housing category to the CFNAI moved up to –0.15 in July from –0.20 in June. Housing permits increased to 943,000 annualized units in July from 918,000 in June, and housing starts rose to 896,000 annualized units in July from 846,000 in the previous month. Employment-related indicators contributed +0.06 to the CFNAI in July, up slightly from +0.05 in June. The unemployment rate fell to 7.4 percent in July from 7.6 percent in June, but nonfarm payrolls rose by 162,000 in July after increasing by 188,000 in the previous month. Production-related indicators contributed –0.10 to the CFNAI in July, down from –0.01 in June. Manufacturing production decreased 0.1 percent in July after rising 0.2 percent in June, and manufacturing capacity utilization ticked down to 75.8 percent in July from 75.9 percent in June.
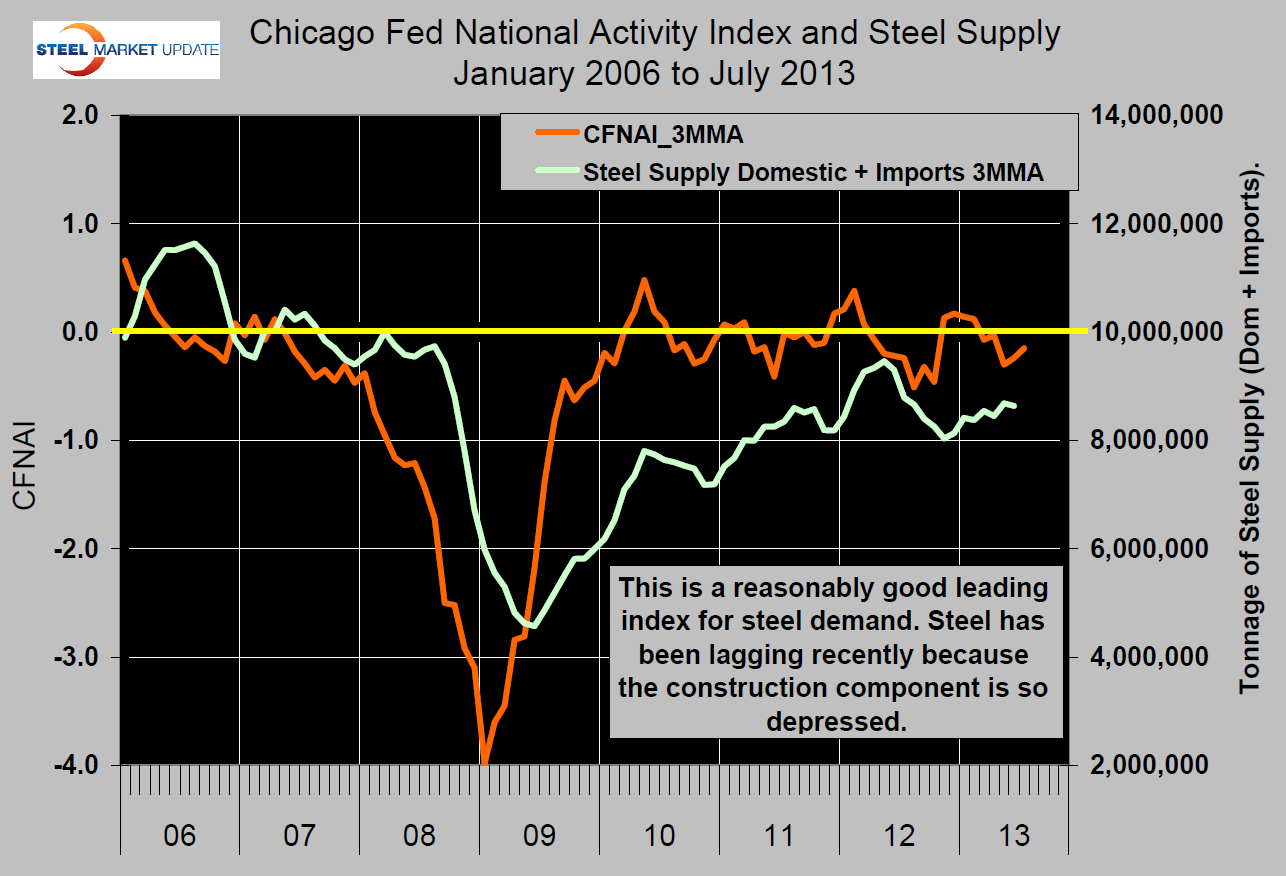 The CFNAI has been a reasonably good leading indicator for steel demand, (Fig 3) with a lead time of about six months. Steel has not recovered to meet the expectations of this relationship because of the drag of construction activity; however the indicator suggests no meaningful growth in steel demand for at least the rest of the year.


