Market Data

August 26, 2013
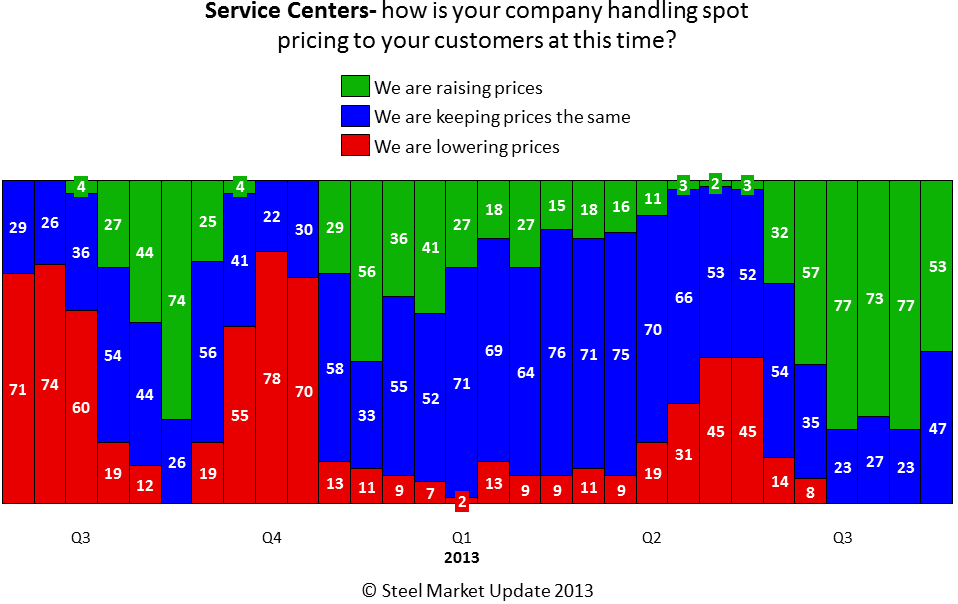
Service Center Spot Resale Prices Begin to Stabilize
Written by John Packard
The percentage of service centers raising spot flat rolled steel prices dropped according to our most recent analysis of the flat rolled steel market. With flat rolled price ranges and averages stagnating at relatively high levels (compared to the lows for the year) distributors’ pricing appears to be leveling off as well. The service center spot markets continue to be highly competitive and are one of the key factors watched by SMU as we analyze whether prices will rise, fall or remain the same from here.
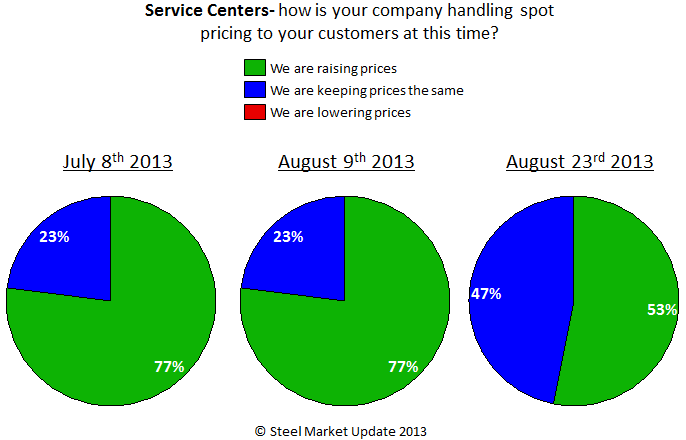 Manufacturing companies also noted that a cyclical peak may have occurred at the beginning of August and now prices appear to be treading sideways and the percentage of service centers asking for higher spot pricing has begun to shrink. The percentage of distributors asking for price increases went from 52 percent at the beginning of August to 41 percent this past week. The majority (52 percent) of the manufacturing companies indicated spot price offers as being the same as what was seen at the beginning of the month. A number of manufacturing companies pointed out in the comment section of our survey that they were not in the market for spot tons. One end user told us, “We are not seeing any change because we are not in the market. I would imagine that unless a steel buyer has been in a cave for the last three months, they are not buying either.” While a second one commented with, “If we did have the balance of the year covered already and I had to purchase today my price would be up about $3.00/cwt. Glad I am not buying.”
Here is what our service center spot pricing graphic looks like at this time: