

Prices
September 10, 2013
Hot Rolled Imports by Port & Country of Origin
Written by Peter Wright
Hot rolled sheet imports July 2013 and YTD by source and port of entry: This is one of an expanded series of analyses, exclusive to the Steel Market Update that is designed to provide a much more comprehensive view of actual volume by product. This will enable a steel buyer or manager to see exactly what came into his immediate vicinity and where it came from. This series of reports includes hot rolled, cold rolled, HDG and other metallic coated, (mainly Galvalume). We will publish these in the same format in four consecutive issues of the Steel Market Update. All volumes are in short tons.
Once our new website comes online this report will be available to our Premium members.
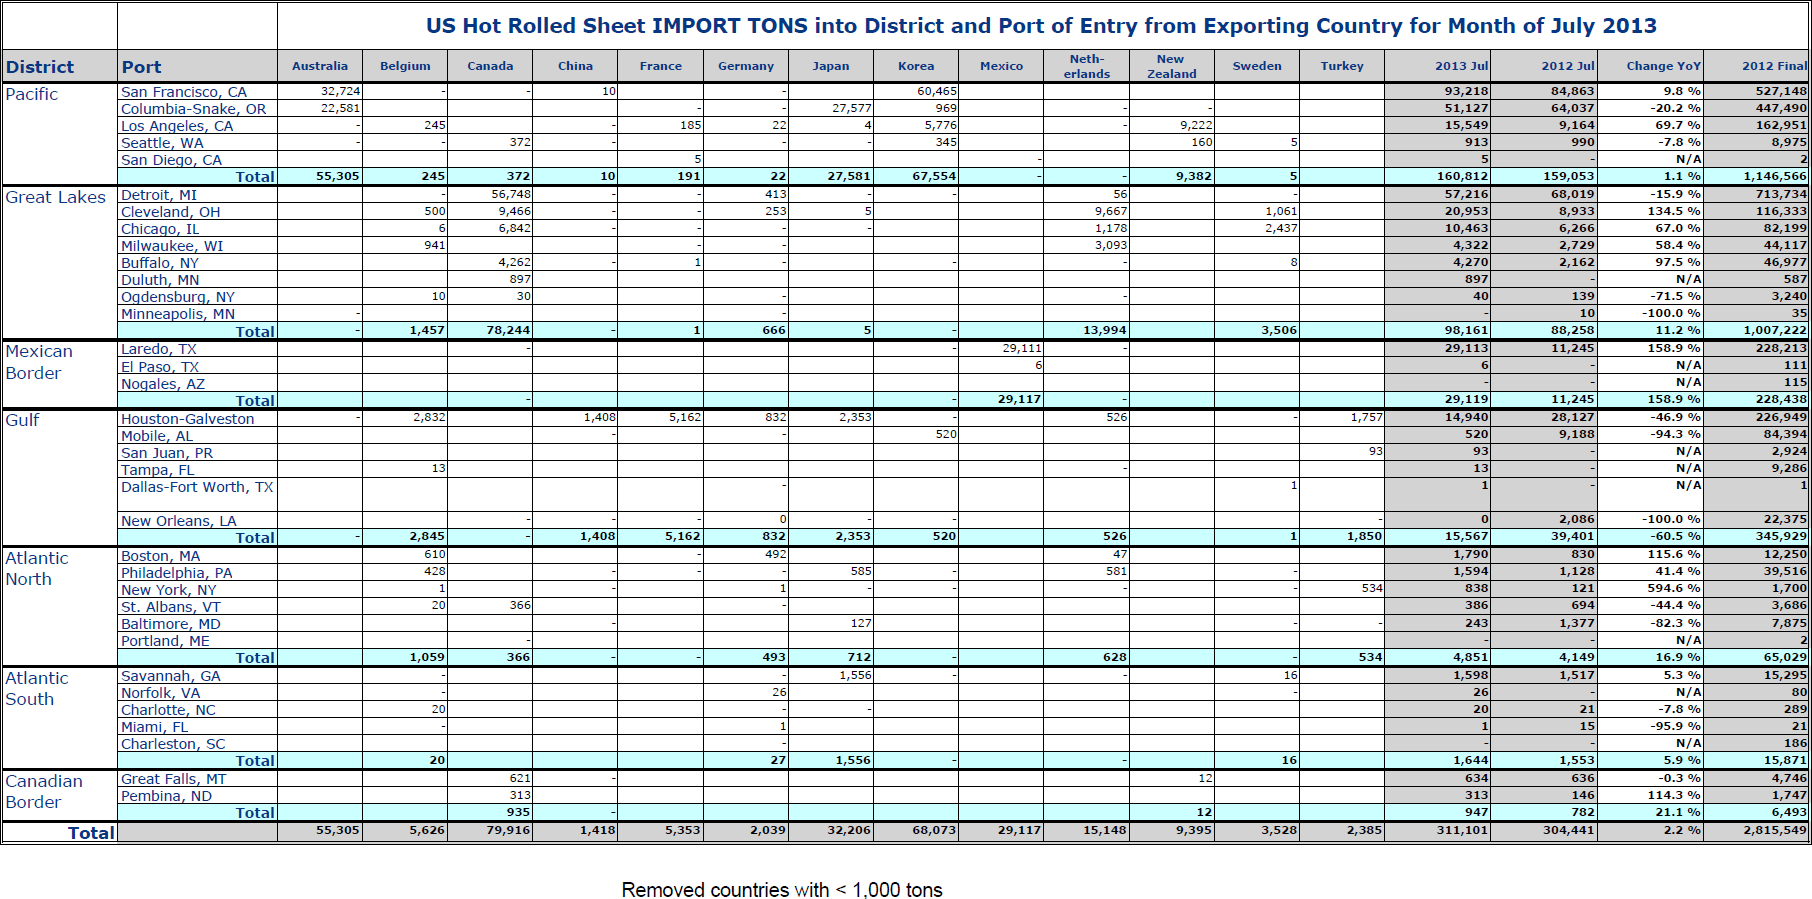
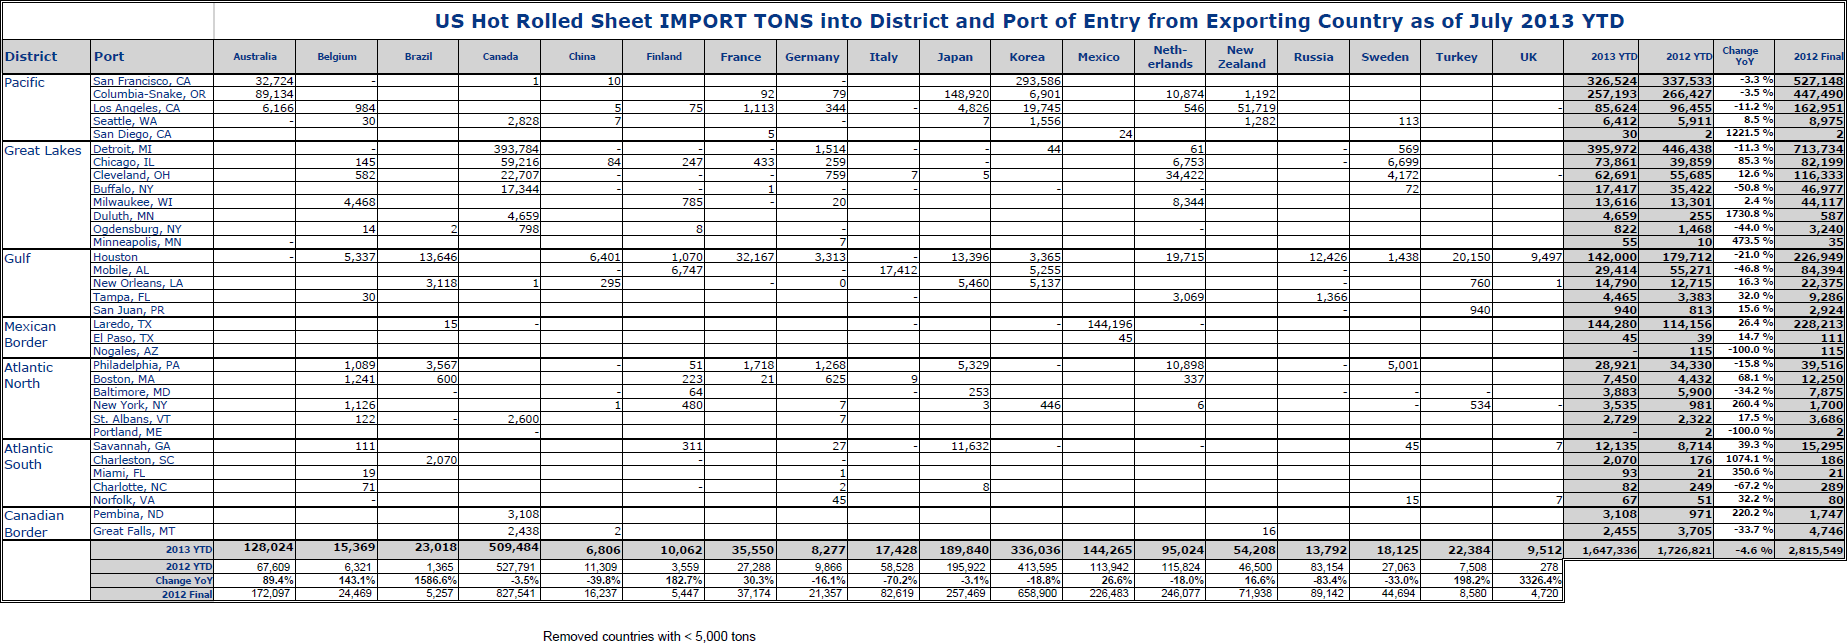
In Tables 1 and 2 the smaller volume sources and ports of entry have been removed to make the tables more readable but the totals include the deleted tonnage and are therefore accurate.
Total HR sheet tonnage in July was 311,101 up from 227,620 tons in June and up by 2.2 percent from July last year. Table 1 shows the detail by port of entry and country of origin. The Pacific region received by far the most tonnage in July with 160,812 tons of which 60,464 tons entered San Francisco from Korea. The Great Lakes came in a distant second with 98,161 tons of which 56,748 tons entered through Detroit from Canada. Canada as usual shipped in the most tonnage with a total of 79,916 tons which mainly entered Detroit. Korea once again came in second with 68,073 tons mostly into San Francisco. Tables 1 and 2 are much too complex for a comprehensive written description but are designed to provide a detailed description of import activity into all regions of the country.
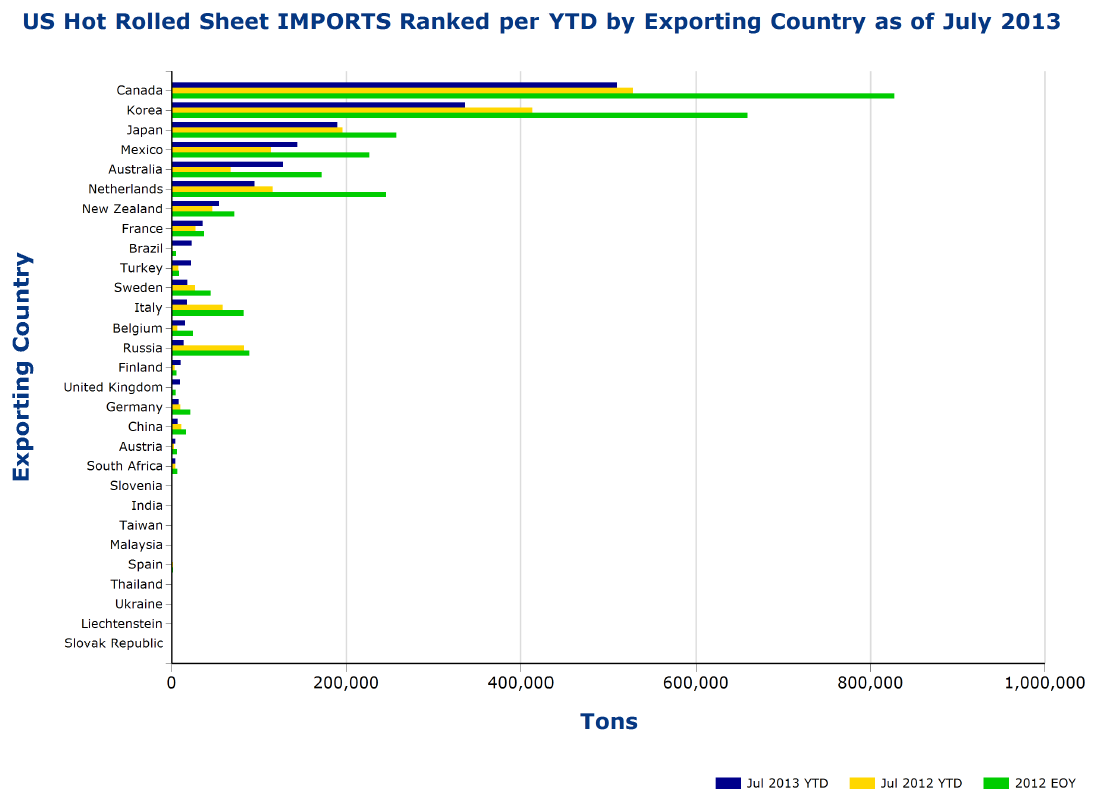
In 2013 YTD through July 1,647,336 tons entered the US, down by 4.6 percent from the same period in 2012. Canada has been the largest source with 509,484 tons of which 393,784 tons entered Detroit. Korea was second with 336,036 tons of which 293,586 tons entered through San Francisco. Other countries with > 100,000 tons YTD through July were Australia, Japan and Mexico. Significant changes this year are that Australia is up by 75.3 percent and tonnage from Brazil has grown from 980 tons in 2012 to 23,918 tons in 2013. Table 2 gives detail of tons by port of entry and by country of origin for 2013 through July.
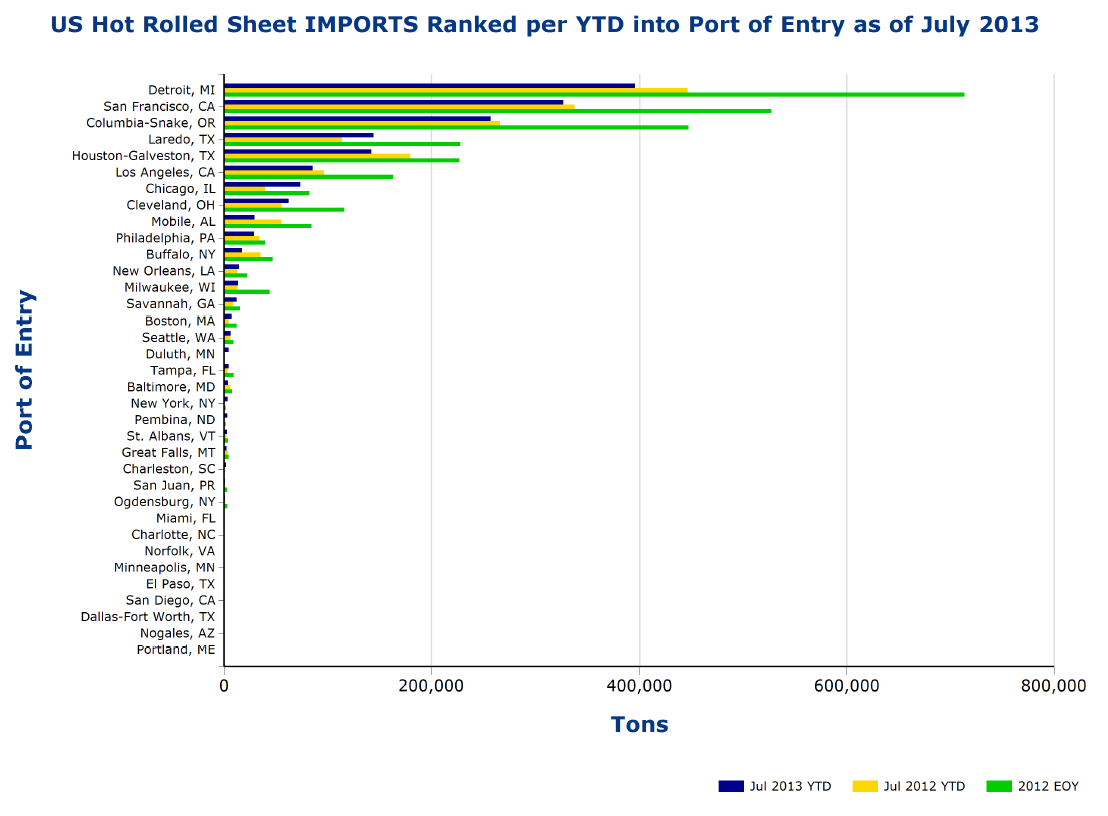
Volume YTD by source and by district of entry are shown graphically in Figures 1 and 2. The green bars indicate the final 2012 tonnage in each case. Countries and ports are ranked by the 2013 YTD tonnage. Figure 1 shows that tonnage from Canada, Korea, the Netherlands, Russia and Italy is down this year as tonnage from Mexico and Australia has increased. Figure 2 shows the tonnage by port. Detroit, Houston and Mobile are down this year, and tonnage into Laredo and Chicago has increased.


